
Energy & Commodities
Ed Note: It is probably advisable for retail investors to diversify as much as possible so trading in physical commodities and companies that are in that business is obviously a huge area that you can seek out positive new investments. Given that commodities generally follow international trends and separate cycles that domestic investors may not be entirely versed in, I have chosen an article on Cycles by Chris for you to both diversify into commodities (we will never stop eating for example). Also possibly improve your abilities in other investment areas by brushing up your skills in Cycle analysis. Below is Chris Vermulen’s great article on Cycles:
THE MARKET YOU TRADE IS NOT RANDOM…
The use of cycles is perhaps the most misunderstood areas of technical analysis. And is widely miss used within automated trading systems. This is because there are a wide variety of approaches ranging from magnetic, to astrology to time based cycles.
The purpose of this tutorial on cycle analysis and implementation into automated trading systems is to present a logical perspective on what cycles and how they enhance your technical analysis studies.
Originally I was attracted to cycle analysis back in 2001. Back then, there was very little information about cycle analysis and even less on how to identify them within financial instruments. Cycles can be somewhat measured using conventional indicators such as RSI, stochastics and moving averages. But, better yet is a custom cycle analyzer indicator I created to make cycle identification and implementation automatic within my trading strategies and my fully automated trading system.
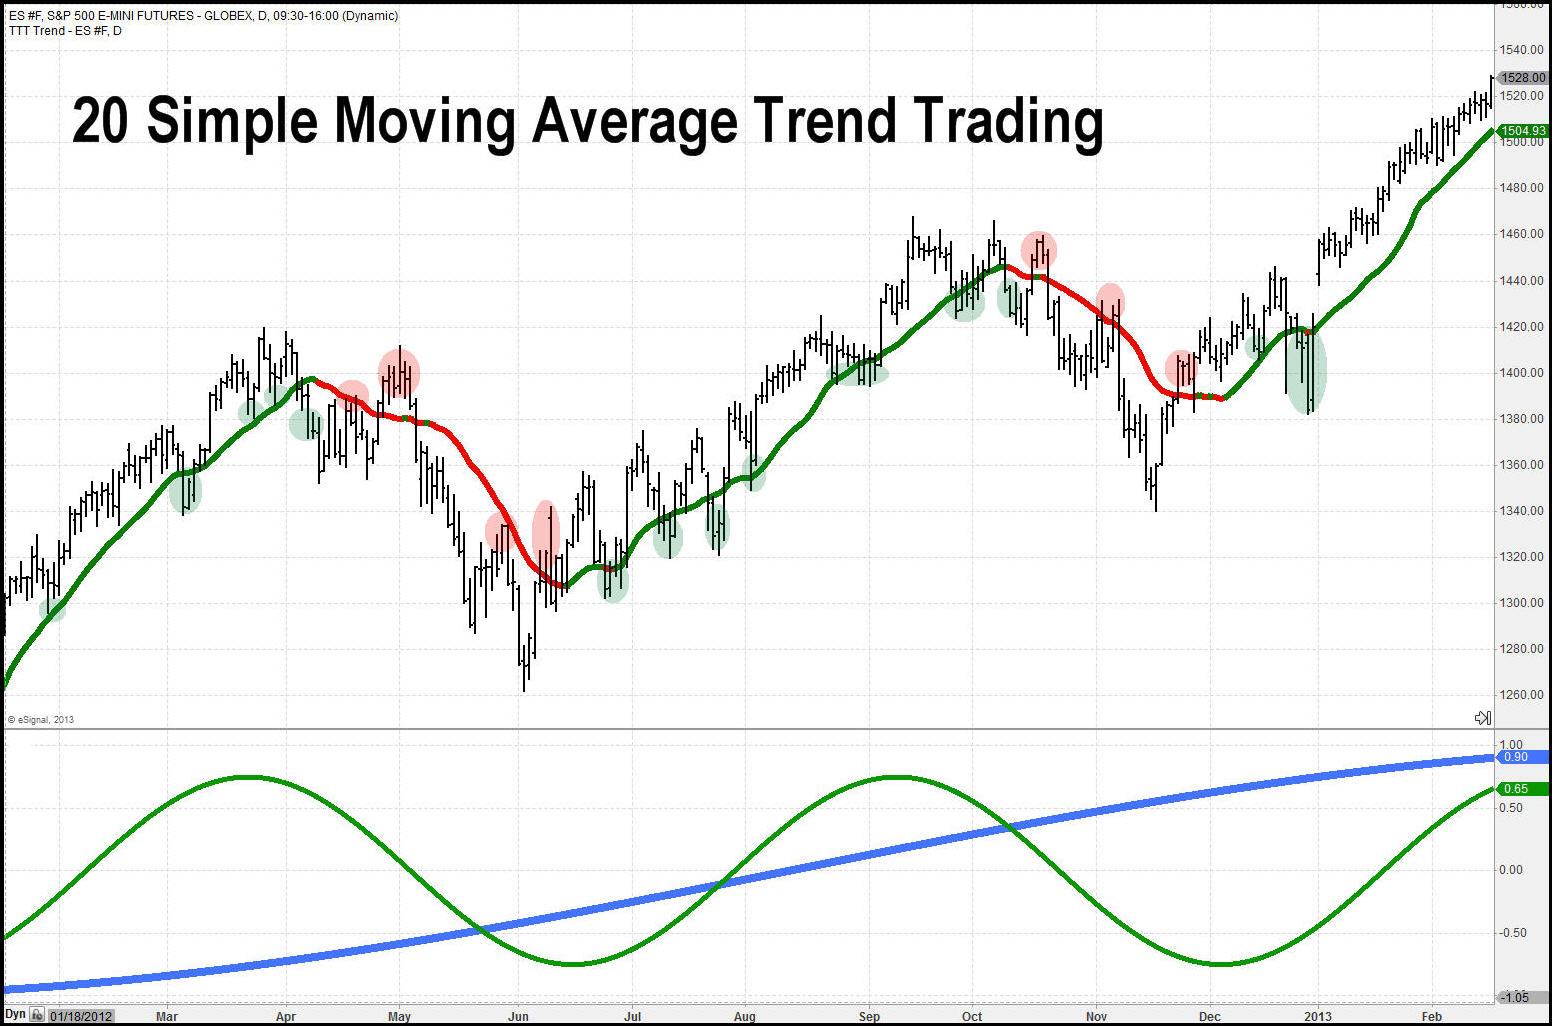
Here is how the moving average can help spot cycles, but keep in mind they are lagging indicators. The lower indicator shows the long term cycle and swing trading cycle I focus on. Remember cycle lengths change over time which is why I automated the indicator and have it run within my automated trading system. But you should get the gist of how cycles look and function.
I am going to touch quickly on a few areas of cycle analysis which I hope you find somewhat interesting.
Cycle Perspective by Market Participants
Cycles also known as waves are observed almost everywhere including nature. Ancient civilizations designed calendars and time measurements cased around cycles. This has creating the most standard measurements we all live by and track on a regular basis. The length of day, year, seasonal changes and even the phases of the moon and stars. These are just time based cycles but the same type of thing carries across noise like musical notes, light spectrum’s, and in liquids like waves in the ocean.
Philosophical Cycle Foundation
The financial markets are truly efficient and follow random walk principle. The fact that so many like Larry Williams and Paul Tudor Jones along with many other long term consistent traders pull money from the financial markets prove this if a more detailed analysis of the random walk theory is applied and you will see some interesting results through cycle analysis.
Understanding cycles and through tracking where they are I their current phase gives you a pretty good idea to where the financial market is headed for a short distance into the future with high level of accuracy.
Understanding Cycles & Automated Trading System Implementation
The stock market or any financial instrument chart is similar to an aerial photo of a river. There are times (sections) where the price movements appear random while other sections have distinctive cyclic pattern (waves or a snake like pattern).
No matter how good you are of a trader or investor you are, trading the markets requires us to take a leap of faith along with many assumptions to follow our trading system whether it is an automated trading system or not.
Understanding cycles is just a piece of the overall puzzle although I would account for it to be 1/3rd of my analysis for timing and position management of my automated investing system.
So what are the other pieces of the puzzle?
Glad you asked (subconsciously)!
According to my research the market is in a cyclical state roughly 20-35% of the time. Logic indicates that you should have a trading strategy that can identify and trade this type of price action.
The stock market trends roughly 25-35% of the time also. So another trading strategy is required for taking advantage of this price action also.
And then there is the random none tradable price action. This is when the market is giving off mixed signals and this typically happens during a change in market conditions from an uptrend to a down trend or from cyclical price action to a trending market.
Understanding and identifying what I just talked about will greatly improve your trading, investing and reduce stress and emotional trading.
My Automated Trading System Identifies Active Cycles and Trades
In conclusion, it took me years of studying cycles to master identification and timing of trades based around them and to be honest I am still learning and improving this process.
If this short tutorial sparked some interest. In a week I will be making my soon to be published book “Technical Trading Mastery – 7 Steps To Win With Logic” which is the perfect holiday read and trading education book to kick start 2014. I will be making the book available to my followers only two months before it’s available on Amazon, Barns & Noble’s etc., which won’t be until Feb.
While I am bias towards this MUST READ BOOK, I do feel it will truly improve how you think, feel and trade the markets for the rest of your life.
Happy Holidays, and remember to send me your feedback and ideas on topics you would like me to learn more about!
Cheers,
Chris Vermeulen
ETF Trading Strategies Newsletter

As a general rule, the most successful man in life is the man who has the best information
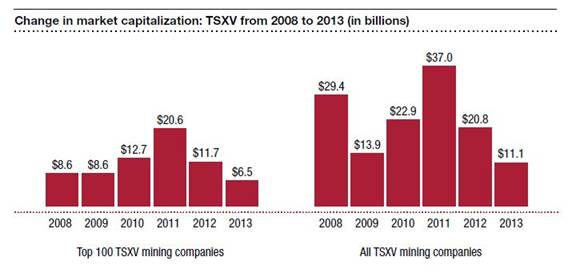
PricewaterhouseCooper’s annual look at the state of the top 100 on the Toronto Stock Exchange Venture (TSX.V) paints a dismal picture:
- Cash generated from financing activities fell 52% in 2012 from 2011 levels and then another 34% in 2013. The top 100 raised $795 million in equity financing, down by half from $1.6 billion in 2012, with only four of 15 producers raising more than $1 million
- Assets held dropped 36% because of a draw-down of cash and short-term investments
- In 2011 the top 100’s Market Capitalization was $20.6 billion, as of June 30th 2013 it was $6.5 billion
- Explorers cut 28%, or $133 million from their budgets in 2013
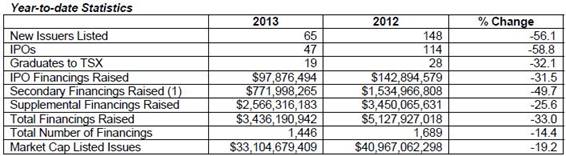
Below is the year to date statistics from the TSX Venture exchange.
“The price-driven, seemingly indiscriminate support that speculative juniors received from retail equity investors prior to the financial crisis is not on hand today.” E&Y’s Global Mining and Metals Center in the report, Business risks facing mining and metals 2013-2014
Consider:
- Canadian, United States and Australia have, over the last 20 years, cut exploration expenditures by half.
- The average time between discovery and production has climbed to roughly 11 years.
- The mining industry is threatened by looming labor and skills shortages caused by the recent downturn making the entire industry not as attractive a place to seek employment.
- A great number of long time industry workers are now entering retirement and taking with them the very experience, skills and knowledge needed to explore for and develop deposits into mines.
- The drought in junior financing is three years long. It’s very likely going to continue and in fact might get worse.
- Resource nationalism and native activism is picking up in many countries putting potential investment at risk.
“Contracting risk appetites have weighed heavily on junior miners’ access to funding. A high risk-reward ratio is the industry’s “sweet spot,” notes PwC. But it is apparent that market participants currently prefer less volatility, more security and higher rewards.” Michelle Smith, Resource Investing News
It’s a fact in the mining world that most discoveries are made by junior exploration companies – juniors are the most adept at finding our future mines. They already own, and find more of, what the world’s larger mining companies need to replace reserves and grow their asset base.
Who might a couple of these juniors be?
What we’re looking for is a quality management, cash in the treasury, ability to raise more if needed, pretty much a ‘no-brainer going mining’ situation and the holy grail of success for juniors – upcoming cash flow – and all of this has to be not only in a politically stable country but one that is also free from resource nationalism and native activism.
Hudson Resources Inc. HUD:TSX.V. Hudson has the White Mountain anorthosite project in the southwest coastal region of Greenland. Anorthosite is calcium feldspar, which is basically sand containing aluminum, calcium, low levels of soda and 1% iron. It could serve as an alternative material in many industrial applications:
- Replace kaolin, a major component of glass fiber manufacturing.
- A replacement for bauxite. Hudson has produced alumina from its anorthosite, which is aluminum oxide, and is well on its way to producing a marketable smelter-grade alumina.
The company is close to the point where it can load its anorthosite onto a deep-sea cargo ship and transport it anywhere in the world, year-round.
Uranerz Energy Corp., TSX and NYSE MKT – URZ (Frankfurt Stock Exchange – U9E). The companycurrently controls a large strategic land position in the Pumpkin Buttes Uranium Mining District of the central Powder River Basin of Wyoming and has almost completed construction of its first in-situ recovery (ISR) uranium mine.
URZ is approximately one month from mine completion and starting a three month inventory stockpiling program. After shipment of its first inventory it will be 30 days before Uranerz receives payment – let’s call for the cash flow to start in the second quarter of 2014. URZ recently announced receipt of a $20,000,000.00 Wyoming State Industrial Bond.
VMS Ventures Ltd. VMS:TSX.V, is the discoverer of Reed Copper deposit – likely the next copper mine to enter production in Canada. In 2010 the VMS Ventures team signed a Joint Venture Agreement with Hudbay Minerals Inc. for the Reed Copper project. The JV agreement established that Hudbay would hold a 70 per cent and VMS a 30 per cent interest in the property and act as the operator.
VMS Ventures’ portion of the mine construction costs is to be financed by Hudbay and is to be paid back out of the proceeds from production. Full production remains on schedule to commence by the second quarter of 2014.
Global Cobalt Corp. GCO:TSX.V, is focused on developing it’s Karakul Cobalt Project in the Republic of Altai, Russia. Currently there is a $3 million drill program utilizing 3 drill rigs underway as well as a feasibility study which will include latest results as well as historical Soviet results.
The company has signed an off-take agreement for up to 100% of the property’s production with Beijing Easpring Material Technology, which counts Beijing General Research Institute of Mining & Metallurgy among its major shareholders.
Conclusion
If junior exploration companies aren’t exploring and making discoveries because of a lack of funding then those juniors already with discoveries, the ones that are well along the development path to being a mine, are definitely considered to be in an investor’s sweet spot.
They are also worth that much more – because of the upcoming reserve replacement squeeze – to a major mining company and investors looking for a potential takeover candidate. Beginning cash flow also enables management to grow the company by taking advantage of the poor situations so many others find themselves in.
A lack of exploration means a lack of discoveries, add in the fact it takes 11 years to get into production and we can see the enormous mineral supply deficit gaping wider, and for far longer than in a normal mining cycle downturn.
Juniors with quality deposits heading to cash flow should be on every investors radar screen. I’ve given you four, are they on your radar screen?
If not, they should be.
Richard (Rick) Mills
Richard is the owner of Aheadoftheherd.com and invests in the junior resource/bio-tech sectors. His articles have been published on over 400 websites, including:
WallStreetJournal, USAToday, NationalPost, Lewrockwell, MontrealGazette, VancouverSun, CBSnews, HuffingtonPost, Londonthenews, Wealthwire, CalgaryHerald, Forbes, Dallasnews, SGTreport, Vantagewire, Indiatimes, Ninemsn, Ibtimes, Businessweek, HongKongHerald, Moneytalks and the Association of Mining Analysts.
If you’re interested in learning more about the junior resource and bio-med sectors, and quality individual company’s within these sectors, please come and visit us atwww.aheadoftheherd.com
If you are interested in advertising on Richard’s site please contact him for more information,rick@aheadoftheherd.com
***
Legal Notice / Disclaimer
This document is not and should not be construed as an offer to sell or the solicitation of an offer to purchase or subscribe for any investment.
Richard Mills has based this document on information obtained from sources he believes to be reliable but which has not been independently verified.
Richard Mills makes no guarantee, representation or warranty and accepts no responsibility or liability as to its accuracy or completeness. Expressions of opinion are those of Richard Mills only and are subject to change without notice. Richard Mills assumes no warranty, liability or guarantee for the current relevance, correctness or completeness of any information provided within this Report and will not be held liable for the consequence of reliance upon any opinion or statement contained herein or any omission.
Furthermore, I, Richard Mills, assume no liability for any direct or indirect loss or damage or, in particular, for lost profit, which you may incur as a result of the use and existence of the information provided within this Report.
Richard does not own shares in any of the companies mentioned in this report. Hudson Resources, Uranerz Energy Corp., VMS Ventures and Global Cobalt Corp. are sponsors of Richard’s site aheadoftheherd.com

- Moore’s Law disrupts the digital … the biomedical … and now, the energy sector.
- Better energy detection, better energy production
- Making controversy obsolete… with oil-and-gas… human health… and more!
When people think of computer and IT companies, names like Intel, Microsoft, IBM and Apple are usually the first that spring to mind. Companies, in other words, that specialize in computers, software and consumer electronics.
The reach of computer tech, however, is far greater and more transformational. It has come to touch everything we do. Rapid improvements in computer processing capacity, thanks to the ongoing fulfillment of Moore’s law, mean the things we are doing keep getting better.
We’ve seen this sort of transformation of the U.S. economy before. Waves of new general-purpose technologies have historically grown the U.S. economy and improved the standard of living for its citizens.
Take rail transportation as an example. In 1850, before this tech was widespread, U.S. gross domestic product was smaller than that of Italy. Then came the railroads, connecting the vast continent and making it possible for the U.S. to become an industrial, urban nation. This disruptive technological change made the U.S. the world’s top manufacturer and largest economy by 1900. The adoption of electrification and automobiles would continue the trend into the new century.
These technologies gave the U.S. economy muscles. Now, with the computer and information tech revolution, it is growing brains. Furthermore, this revolution still has a long way to run. While the physical economy still dwarfs the digital one, that will change over the next 20 years.
As I often like to point out, one of the much overlooked areas where this is happening is biomedical research. This year’s Nobel Prize in chemistry was awarded to three researchers, Martin Karplus, Michael Levitt and Arieh Warshel, “for the development of multiscale models for complex chemical systems.” Instead of using balls and sticks to model molecules, chemists are now able to do so using fast computer models.
And of course, no chemical system is more complex than human biology. This sort of modeling, made possible by computer tech, means that software is replacing wetware. We can now create computer models as silicon-based stand-ins for biology. Using these algorithms for cells and tissues, we are discovering new ways to treat disease. High-performance computers are making possible higher rates of drug discovery that haven’t been possible in the past.
Health care, of course, is a huge chunk of the U.S. economy, accounting for some one-sixth of the nation’s GDP, but it isn’t the only area that is being disrupted in this way. Energy also makes up a large share, and it too is being transformed by computational tech.
We are in the midst of an energy revolution, although it has been a long time in the making.
New computer tech, along with sensors and networks, has made it possible to extract oil and gas where it wasn’t possible before. Back in 1979, exploratory drilling turned up a productive well only once in every seven tries. By the 1980s, however, new computing tech made it possible to perform seismic surveys and model what things look like underground. The number of unproductive holes drilled into the ground fell sharply.
But things really got going in the 2000s in the U.S., where for decades, oil and gas production had been in decline.
 As you know, new tech called fracking began to be used to make previously unproductive deposits viable, as well as bring old tapped-out fields back into production.
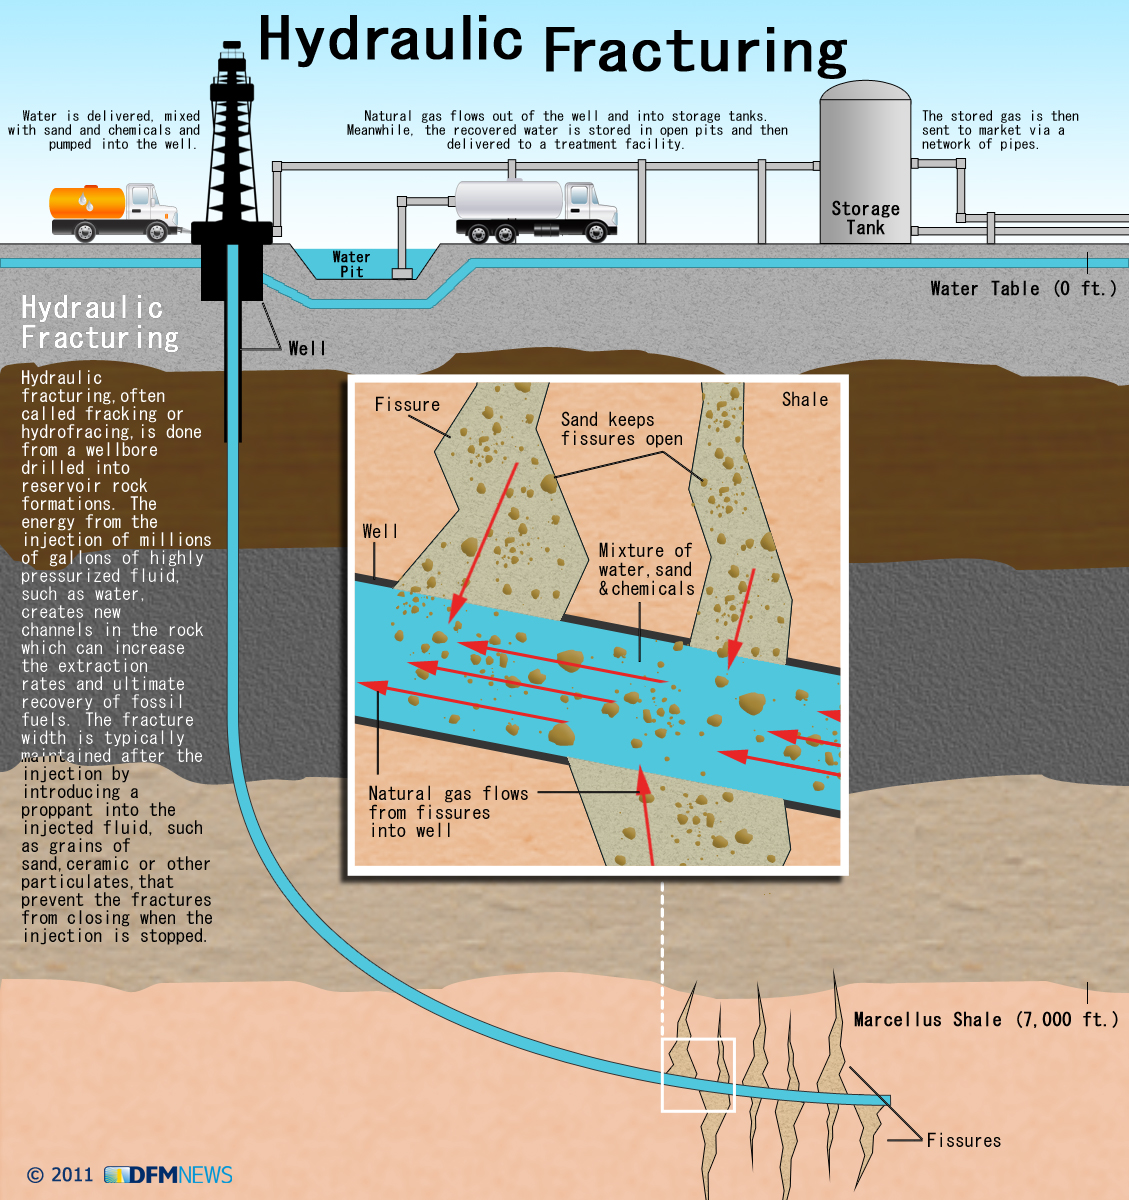
Also known as hydrofracking, this method of oil extraction uses high-pressure fluid to fracture oil-bearing formations underground, releasing their valuable hydrocarbon content. But fracking depends on the latest in sensing and computing technology.
Since 2008, U.S. production has enjoyed a sharp upswing. In fact, the International Energy Agency is now projecting that the U.S. could become the world’s largest oil producer in the next two years, surpassing Russia and even Saudi Arabia.
All of this is being driven by tech. There’s plenty of money to be made in oil itself, of course, but there is also the tech making it possible.
Seismic Change in Sensing Technology
Computer-assisted oil and gas production relies on sound propagated underground in order to learn about the subterranean environment. Seismic sensors, also called geophones, are used to detect vibrations in the ground generated by special ground-vibrating equipment. The data are then used to build an underground 3-D map.
The seismic maps are critical for tapping previously unavailable resources. In many shale formations, for example, the oil- and gas-bearing layer might be only 200 feet thick but reside a mile underground. When the vertical well is drilled, it must be precisely located in order for horizontal shafts to branch out. Enhanced recovery techniques, which allow for greater production from aging fields, also require the use of sensing tech.
The sensors aren’t only helpful for finding oil in the ground; they are also used to draw a map while a well is hydrofracked. In hydrofracking, fluids are pumped into the well at high pressure, fracturing the rock. Particulate matter, such as sand, is injected along with the fluid to hold the fractures open. The fracturing itself is like a seismic event, and is detectable using seismic equipment, which can be used to determine the location and extent of the fractures.
There are also environmental reasons for good detection tech. Aquifers can be located near oil- and gas-bearing formations, and improper fracturing can cause leaks into the groundwater. Good sensing technology can be used to monitor and control the process, protecting this natural resource.
In short, the energy industry will have to make a major shift in seismic technology.
Conventional seismic sensing equipment uses cables run deep underground to the sensors. This is expensive, and cabling can cost millions for a single location. Deploying cabled systems is also a time-consuming and high-maintenance proposition. The rough environment of drilling sites isn’t friendly to equipment.
That’s why what the world needs now is new seismic sensing equipment. Stay tuned as we cover specific companies in this space in future issues!
Ad lucrum per scientia (toward wealth through science),
Ray Blanco
Ed. Note: There’s no doubt that we need to be careful about the aquifers near oil-and-gas bearing formations, so our groundwater isn’t contaminated…
Better to innovate toward good sensing tech than backtrack on our energy production.
But you can bet people will continue to make a fuss if they don’t know about new innovation.
The same goes for the biotech field. People used to vehemently oppose stem cell research, since the research used to rely on using unborn fetuses. But innovation is changing all of that. One company in particular is riding on the back of Moore’s law in order to disrupt what makes up one-sixth of the economy: healthcare.
Click here for the full story behind one of our favorite biotech companies.
Thank you for reading Tomorrow in Review. We greatly value your questions and comments. Click here to send us feedback.
 In our last essay we examined the situation in the U.S. Dollar Index (from many perspectives) and the Euro Index, as many times in the past it gave us important clues about future precious metals’ moves. Back then we wrote that the implications for the precious metal market were bearish just as the outlook for the Euro Index and just as it was bullish for the USD Index.
On the next trading day, after the essay was posted, gold, silver and mining stocks declined along with the European currency and hit their fresh monthly lows. Does it mean that the final bottom for the decline in gold, silver and mining stocks is already in?
Many times in our previous essays we wrote that if you want to be an effective and profitable investor, you should look at the situation from different perspectives and make sure that the actions that you are about to take are really justified. That’s why in today’s essay we’ll examine gold and silver mining stocks to find out what kind of impact they can have on precious metals’ future moves.
Additionally, it’s been almost a month since we wrote in greater detail about the precious metals mining stock sector, so we thought that you might appreciate an update. As a reminder, on Nov. 8 we wrote that the outlook remained bearish and even though we couldn’t rule out a few days of strength, it didn’t seem that a rally would be a sustainable development.
Let’s start with two of the most followed commodity stock indices – the Philadelphia Gold/Silver XAU Index and the AMEX Gold Bugs HUI Index (charts courtesy of http://stockcharts.com).
This week we saw a major breakdown below two critical support levels: the long-term rising support line and the 2013 low. Taking this fact into account, we can conclude that the implications are clearly bearish for the coming weeks.
Now, let’s have a look at the HUI Index. The chart below expresses a simplicity that betrays potential information on where this market may ultimately be heading. (Click on image for larger view)

In our previous Premium Update, we wrote that the HUI Index extended declines and dropped below the previous 2013 low, which was a very bearish sign. Back then we also mentioned that a similar breakdown in mining stocks preceded the plunge in the entire precious metals sector in April and taking this fact into account we could expect big moves to the downside in the days or weeks ahead.
Looking at the above chart, we see that we have indeed seen a big move to the downside, even though it’s been only a few days since the above was posted. This is another bearish confirmation, as back in 2008 the breakdown below the previous local low meant that the final sharp downswing was already underway. We expect the final bottom to be seen close to the 150 level.
What about the short term?
Let’s start by quoting what we wrote in Friday’s Premium Update:
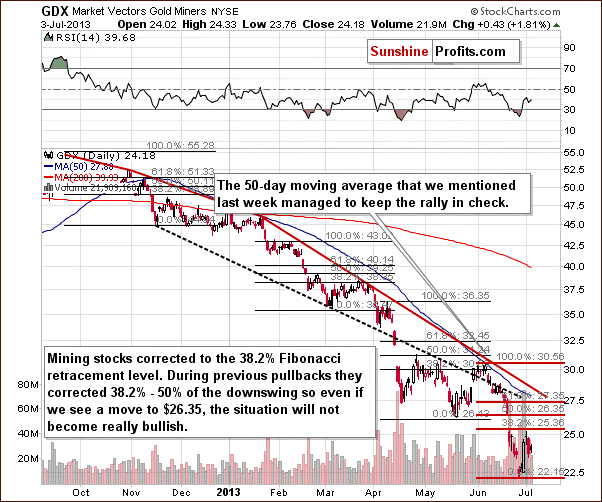
From the short-term point of view, we see that the situation has deteriorated recently. At the beginning of the week mining stocks declined below the previous 2013 low and stayed there for three consecutive trading days. This means that the breakdown is confirmed at the moment and the implications are bearish.
As you can see on the above chart, miners reached the medium-term declining support line created by the August and September high – similarly to what we saw at the beginning of the month. Back then, this line triggered a consolidation (just like now); however, as it turned out it was just a pause within a short-term decline.
Taking this fact into account and combining it with the confirmed breakdown below the previous 2013 low, the current decline could become a major, medium-term decline.
It seems that we indeed see mining stocks in a major medium-term term decline as they dropped significantly this week.
There was even another breakdown – below the declining support line based on the August and September highs. The implications of the above chart remain bearish.
Finally, we would like to discuss the current situation in the gold-stocks-to-gold ratio.
On the above chart, we clearly see that the situation has again deteriorated in recent days. On Monday, the HUI-to-gold ratio dropped slightly below its previous 2013 low and we saw it close there on Tuesday as well. The breakdown is not confirmed at the moment but just one more daily close below the previous 2013 low will make the situation much more bearish.
Summing up, the medium-term trend remains down, the decline is quite likely to accelerate shortly and the outlook for the mining stocks sector is very bearish. It seems that practically all markets – gold, silver, main stock indices – are going down right now (except for crude oil, where we just saw a major breakout on huge volume) and mining stocks are declining along with them. Actually, they are leading the way.
 As a distant but interested observer of history and investment markets I am fascinated how major events that arose from longer-term trends are often explained by short-term causes. The First World War is explained as a consequence of the assassination of Archduke Franz Ferdinand, heir to the Austrian-Hungarian throne; the Depression in the 1930s as a result of the tight monetary policies of the Fed; the Second World War as having been caused by Hitler; and the Vietnam War as a result of the communist threat.
Similarly, the disinflation that followed after 1980 is attributed to Paul Volcker’s tight monetary policies. The 1987 stock market crash is blamed on portfolio insurance. And the Asian Crisis and the stock market crash of 1997 are attributed to foreigners attacking the Thai Baht (Thailand’s currency). A closer analysis of all these events, however, shows that their causes were far more complex and that there was always some “inevitability” at play.
Simply put, a financial crisis doesn’t happen accidentally, but follows after a prolonged period of excesses…
Take the 1987 stock market crash. By the summer of 1987, the stock market had become extremely overbought and a correction was due regardless of how bright the future looked. Between the August 1987 high and the October 1987 low, the Dow Jones declined by 41%. As we all know, the Dow rose for another 20 years, to reach a high of 14,198 in October of 2007.
These swings remind us that we can have huge corrections within longer term trends. The Asian Crisis of 1997-98 is also interesting because it occurred long after Asian macroeconomic fundamentals had begun to deteriorate. Not surprisingly, the eternally optimistic Asian analysts, fund managers , and strategists remained positive about the Asian markets right up until disaster struck in 1997.
But even to the most casual observer it should have been obvious that something wasn’t quite right. The Nikkei Index and the Taiwan stock market had peaked out in 1990 and thereafter trended down or sidewards, while most other stock markets in Asia topped out in 1994. In fact, the Thailand SET Index was already down by 60% from its 1994 high when the Asian financial crisis sent the Thai Baht tumbling by 50% within a few months. That waked the perpetually over-confident bullish analyst and media crowd from their slumber of complacency.
I agree with the late Charles Kindleberger, who commented that “financial crises are associated with the peaks of business cycles”, and that financial crisis “is the culmination of a period of expansion and leads to downturn”. However, I also side with J.R. Hicks, who maintained that “really catastrophic depression” is likely to occur “when there is profound monetary instability — when the rot in the monetary system goes very deep”.
Simply put, a financial crisis doesn’t happen accidentally, but follows after a prolonged period of excesses (expansionary monetary policies and/or fiscal policies leading to excessive credit growth and excessive speculation). The problem lies in timing the onset of the crisis. Usually, as was the case in Asia in the 1990s, macroeconomic conditions deteriorate long before the onset of the crisis. However, expansionary monetary policies and excessive debt growth can extend the life of the business expansion for a very long time.
In the case of Asia, macroeconomic conditions began to deteriorate in 1988 when Asian countries’ trade and current account surpluses turned down. They then went negative in 1990. The economic expansion, however, continued — financed largely by excessive foreign borrowings. As a result, by the late 1990s, dead ahead of the 1997-98 crisis, the Asian bears were being totally discredited by the bullish crowd and their views were largely ignored.
While Asians were not quite so gullible as to believe that “the overall level of debt makes no difference … one person’s liability is another person’s asset” (as Paul Krugman has said), they advanced numerous other arguments in favour of Asia’s continuous economic expansion and to explain why Asia would never experience the kind of “tequila crisis” Mexico had encountered at the end of 1994, when the Mexican Peso collapsed by more than 50% within a few months.
In 1994, the Fed increased the Fed Fund Rate from 3% to nearly 6%. This led to a rout in the bond market. Ten-Year Treasury Note yields rose from less than 5.5% at the end of 1993 to over 8% in November 1994. In turn, the emerging market bond and stock markets collapsed. In 1994, it became obvious that the emerging economies were cooling down and that the world was headed towards a major economic slowdown, or even a recession.
But when President Clinton decided to bail out Mexico, over Congress’s opposition but with the support of Republican leaders Newt Gingrich and Bob Dole, and tapped an obscure Treasury fund to lend Mexico more than$20 billion, the markets stabilized. Loans made by the US Treasury, the International Monetary Fund and the Bank for International Settlements totalled almost $50 billion.
However, the bailout attracted criticism. Former co-chairman of Goldman Sachs, US Treasury Secretary Robert Rubin used funds to bail out Mexican bonds of which Goldman Sachs was an underwriter and in which it owned positions valued at about $5 billion.
At this point I am not interested in discussing the merits or failures of the Mexican bailout of 1994. (Regular readers will know my critical stance on any form of bailout.) However, the consequences of the bailout were that bonds and equities soared. In particular, after 1994, emerging market bonds and loans performed superbly — that is, until the Asian Crisis in 1997. Clearly, the cost to the global economy was in the form of moral hazard because investors were emboldened by the bailout and piled into emerging market credits of even lower quality.
…because of the bailout of Mexico, Asia’s expansion was prolonged through the availability of foreign credits.
Above, I mentioned that, by 1994, it had become obvious that the emerging economies were cooling down and that the world was headed towards a meaningful economic slowdown or even a recession. But the bailout of Mexico prolonged the economic expansion in emerging economies by making available foreign capital with which to finance their trade and current account deficits. At the same time, it led to a far more serious crisis in Asia in 1997 and in Russia and the U.S. (LTCM) in 1998.
So, the lesson I learned from the Asian Crisis was that it was devastating because, given the natural business cycle, Asia should already have turned down in 1994. But because of the bailout of Mexico, Asia’s expansion was prolonged through the availability of foreign credits.
This debt financing in foreign currencies created a colossal mismatch of assets and liabilities. Assets that served as collateral for loans were in local currencies, whereas liabilities were denominated in foreign currencies. This mismatch exacerbated the Asian Crisis when the currencies began to weaken, because it induced local businesses to convert local currencies into dollars as fast as they could for the purpose of hedging their foreign exchange risks.
In turn, the weakening of the Asian currencies reduced the value of the collateral, because local assets fall in value not only in local currency terms but even more so in US dollar terms. This led locals and foreigners to liquidate their foreign loans, bonds and local equities. So, whereas the Indonesian stock market declined by “only” 65% between its 1997 high and 1998 low, it fell by 92% in US dollar terms because of the collapse of their currency, the Rupiah.
As an aside, the US enjoys a huge advantage by having the ability to borrow in US dollars against US dollar assets, which doesn’t lead to a mismatch of assets and liabilities. So, maybe Krugman’s economic painkillers, which provided only temporary relief of the symptoms of economic illness, worked for a while in the case of Mexico, but they created a huge problem for Asia in 1997.
Similarly, the housing bubble that Krugman advocated in 2001 relieved temporarily some of the symptoms of the economic malaise but then led to the vicious 2008 crisis. Therefore, it would appear that, more often than not, bailouts create larger problems down the road, and that the authorities should use them only very rarely and with great caution.
Regards,
By Marc Faber via http://dailyreckoning.com/that-financial-crisis-was-no-accident
Marc Faber is an international investor known for his uncanny predictions of the stock market and futures markets around the world.

-
I know Mike is a very solid investor and respect his opinions very much. So if he says pay attention to this or that - I will.
~ Dale G.
-
I've started managing my own investments so view Michael's site as a one-stop shop from which to get information and perspectives.
~ Dave E.
-
Michael offers easy reading, honest, common sense information that anyone can use in a practical manner.
~ der_al.
-
A sane voice in a scrambled investment world.
~ Ed R.
Inside Edge Pro Contributors

Greg Weldon

Josef Schachter

Tyler Bollhorn

Ryan Irvine

Paul Beattie

Martin Straith

Patrick Ceresna

Mark Leibovit

James Thorne

Victor Adair