More news from MarketWatch:
Willard: This bubble-blowing bull market won’t end well
Fed’s Bullard floats idea of small taper in December
Gilburt: Is a 100-point S&P decline out of the question?.

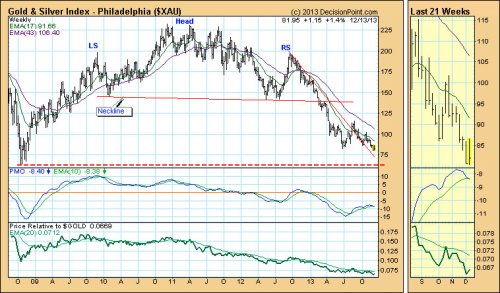
The Gold and Silver Index (XAU) represents a group of precious metal mining stocks. It is in a major decline from the 2010 top.
We have watched the XAU form a massive head and shoulders pattern for over three years. The neckline was violated this year, and the technical downside target was somewhat below the horizontal support line drawn from the 2008 low, so it would seem that there is more downside to go before the target is reached.
The following is an excerpt from the December 13th, 2013 blog for Decision Point subscribers.
….readl more HERE

 In our previous essay, we examined the situation in crude oil in different time horizons. Back then, we wrote that the short-term situation had improved as crude oil had broken above both short-term resistance lines on relatively high volume and had come back above the previously-broken medium-term support line and the long-term one.
In the following days, crude oil extended gains and approached its 200-day moving average. What’s next? Is the worst already behind oil bulls and we will see further improvement? Before we try to answer these questions, we’ll examine three interesting ratios to see if there’s anything on the horizon that could drive crude oil higher or lower in the near future. Let’s start with the oil-to-oil-stocks ratio (charts courtesy by http://stockcharts.com).

At the end of October, the ratio declined and broke below the long-term declining support line created by the 2012 and 2013 lows. Additionally, the WTIC:XOI ratio verified the breakdown, which was a strong bearish signal. In our previous Oil Investment Update we wrote that as long as the breakdown below the bold blue support line was not invalidated, another downswing couldn’t be ruled out.
Looking at the above chart, we see that the ratio reached the next long-term support line (marked with the thin blue line on the previous chart) and rebounded sharply in the previous week. In this way, the ratio invalidated the breakdown below the support line based on the 2012 and 2013 lows, which is a strong bullish sign.
Last week, the ratio reached its 50-day moving average and reversed the course – similarly to what we saw in April, May and June. However, we should keep in mind that back then, new lows in ratio didn’t trigger a fresh low in crude oil. Therefore, if history repeats itself once again, we may see lower values of light crude in near future, but another big move lower doesn’t seem likely.
Having discussed the above, we’ll examine the oil-stocks-to-oil ratio. What impact could it have on future oil moves? Let’s start with the long-term chart.
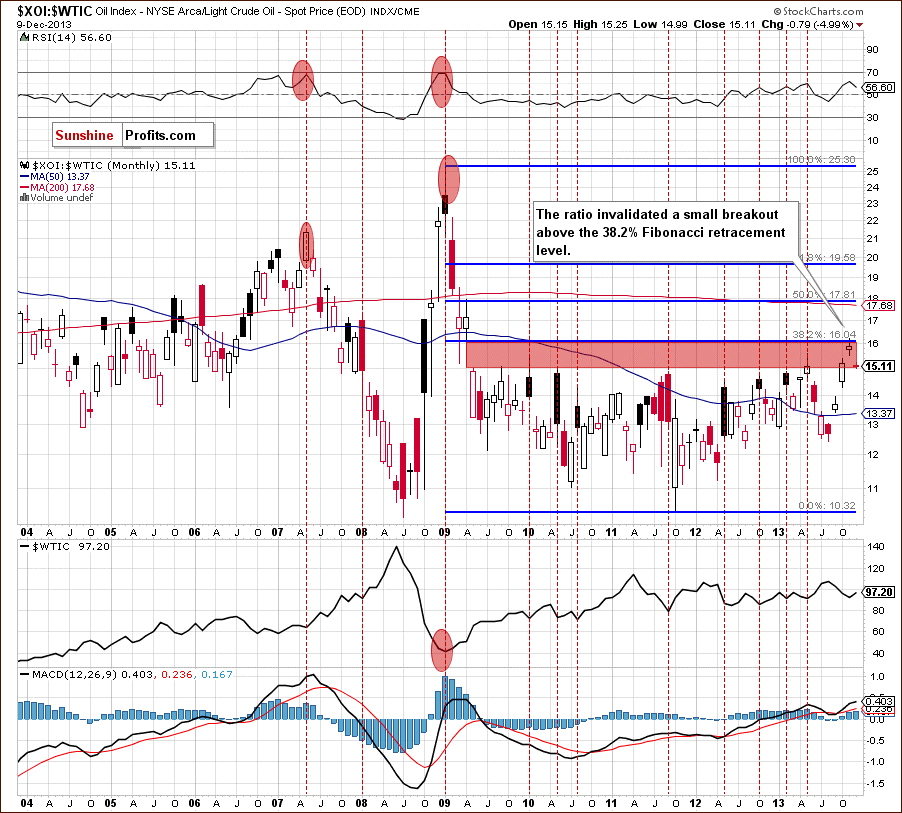
Looking at the above chart, we see that the ratio reached the 38.2% Fibonacci retracement level (based on the entire 2009-2011 decline) and invalidated a small breakout above this strong resistance level, which was a bearish signal. This circumstance triggered a downswing, which took the ratio to the lower line of the gap between the April 2009 low and May 2009 high (marked with the red rectangle), which is not supporting further growth. From this perspective, the implications for oil are bullish.
Now, let’s zoom in on our picture and examine the weekly chart.
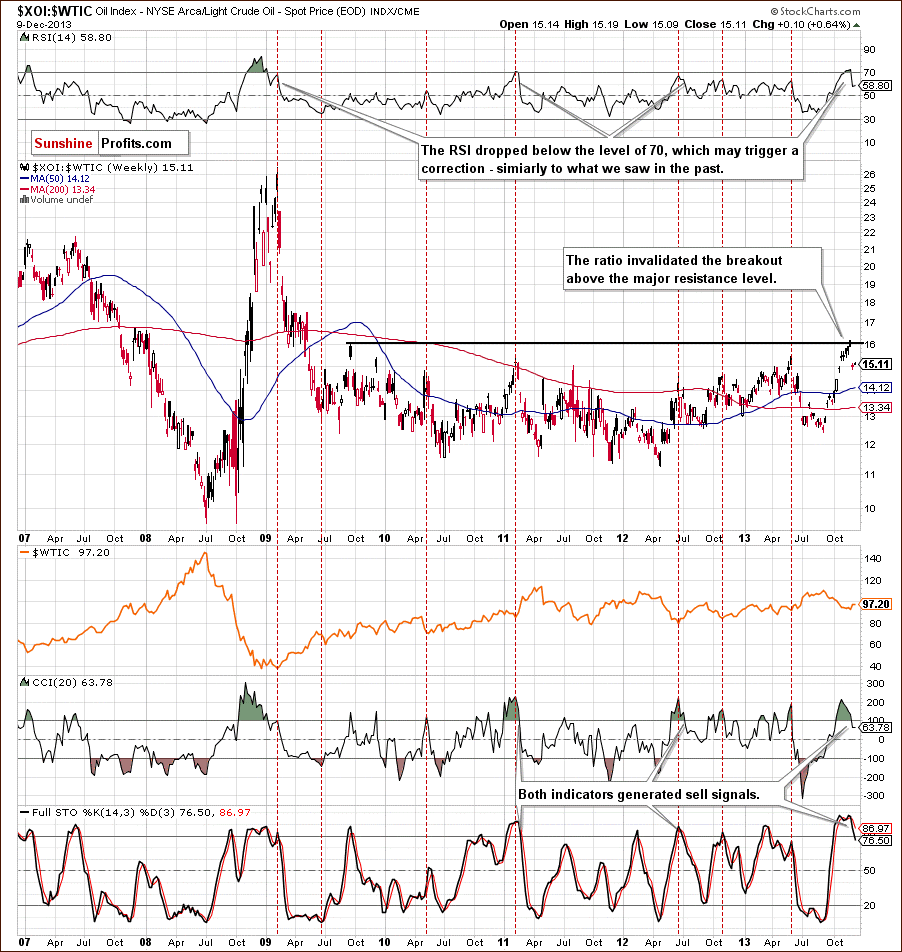
After an invalidation of the breakout above the resistance level created by the September 2009 high, which is slightly below the 38.2% Fibonacci retracement (marked on the previous chart), the ratio declined, which triggered an upswing in crude oil. Additionally, the RSI dropped below the level of 70, which suggests further deterioration in the ratio. We saw similar situations in the past and in all previous cases such circumstances had a positive impact on the price of light crude.
When we factor in the position of the CCI and the Stochastic Oscillator, we clearly see that both indicators generated sell signals, which is another bearish signal. From this perspective, the implications for crude oil are also bullish.
Now, let’s check the short-term outlook.
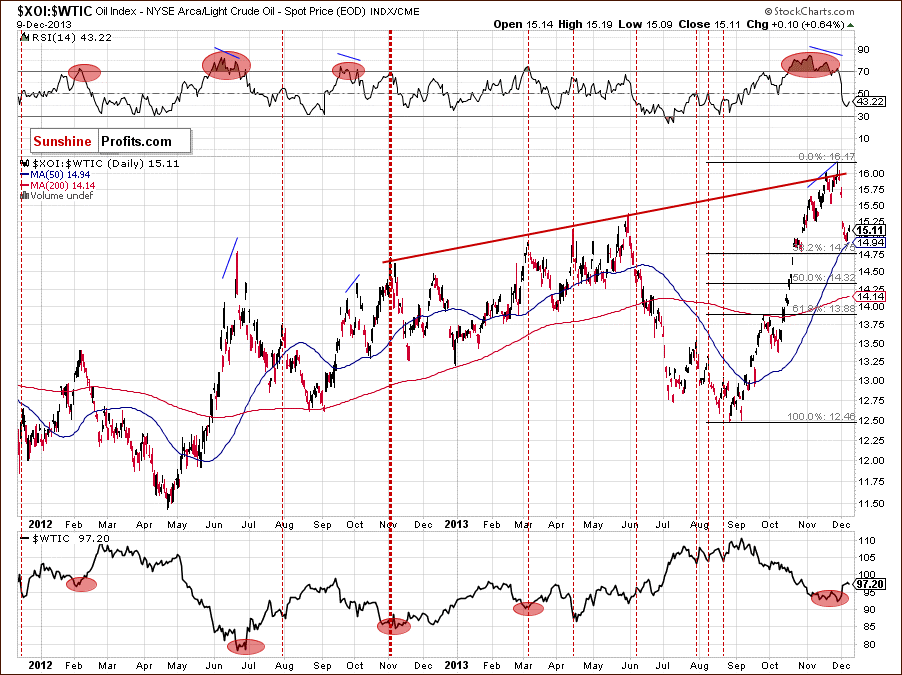
Looking at the above chart, we see that last week the ratio bounced off the medium-term rising resistance line based on the November 2012 and May 2013 highs (marked with the red line) and declined, which was in perfect tune with an upswing in crude oil.
With this downward move, the ratio reached its 50-day moving average and approached the 38.2% Fibonacci retracement level. This strong support zone triggered a corrective upswing in the recent days, which preceded a decline in light crude. Taking into account the fact that the correction is still shallow, we may see further improvement in the ratio and deterioration in crude oil.
When we take a closer look at the chart above, we notice that earlier this year we had similar situation in April. At that time, although we saw a corrective upswing in the ratio, it didn’t pushed light crude to a new low. If history repeats itself, we may see further improvement in crude oil after a corrective downswing.
Before we finish this section, we would like to focus on the oil-to-gold ratio.
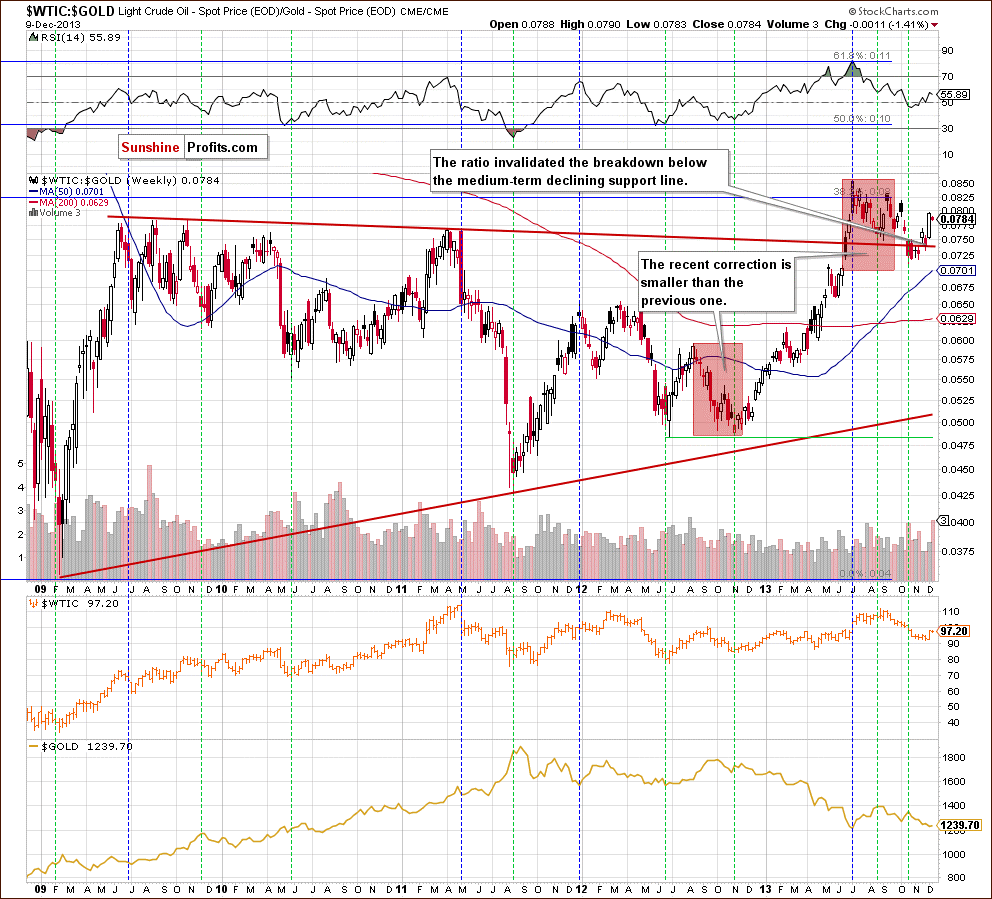
As you can see on the weekly chart, the ratio’s 2012 low was in tune with the bottom of a correction in crude oil. In November 2012, the ratio declined to its previous low, which triggered a corrective move in light crude. After that, we saw a post-double-bottom rally, which supported higher prices of crude oil.
Looking at the above chart, we see that the ratio’s 2013 top wasn’t in perfect tune with light crude’s 2013 high. However, when we take a closer look, we notice that the ratio’s September high was visibly lower than the previous one. Meanwhile, crude oil was trading near its 2013 high. This negative divergence between the ratio and the price of light crude was a negative sign and resulted in a decline in the following weeks.
With this downward move, the ratio dropped below long-term declining support line, which was a bearish sign. However, as it turned out in recent weeks, the breakdown was invalidated, which is a bullish signal for light crude.
Additionally, the recent correction is smaller than the previous one (August-November 2012), which suggests that another move to the upside is quite likely. As mentioned earlier, the rising ratio has had a positive impact on the price of crude oil since the beginning of the year. We can assume that higher values of the ratio will likely support the price of light crude.
What’ interesting, earlier this year the rising ratio had a negative impact on the price of gold. The ratio’s 2013 high was in tune with gold’s low in July. After that, this negative correlation between the ratio and gold pushed the yellow metal higher. There was a short period of time (in September), when they both dropped together, however, as it turned out, it was just a temporary phenomenon and the October decline in the ratio triggered an upward move in gold.
As you can see on the above chart, the negative correlation between the ratio and gold remains in place at the moment. Since the beginning of November the rising ratio has pushed the yellow metal lower and it seems that if this relationship remains in place in the coming days/weeks, we will likely see further deterioration in gold.
Summing up, the WTIC:XOI ratio invalidated the breakdown below the support line based on the 2012 and 2013 lows, which is a positive factor supporting the bullish case.
When we factor in the long-, medium- and the short-term XOI:WTIC charts, we clearly see that the ratio invalidated breakouts above a strong resistance zone created by the long-, medium- and short-term lines. This is another strong positive signal for oil bulls. On top of that, after discussing the situation in the oil-to-gold ratio, we can assume that the implications for crude oil are also bullish and further growth in crude oil is just around the corner.
Nadia is a private investor and trader, dealing in stocks, currencies, and commodities. Using her background in technical analysis, she spends countless hours identifying market trends, major support and resistance zones, breakouts and failures. In her writing, she presents complex ideas with clarity that enables you to easily understand market changes, and profit on them.
You can read Nadia’s analyses at SunshineProfits.com where she publishes her articles on gold and crude oil trading.
Last week I looked at breaking developments that suggest the Duvernay shale may be the most profitable play in Canadian history.
Consider just two points on the play—hot off the press at a tight-knit gathering of Duvernay insiders put on by TD Securities in Toronto a few weeks ago:
Incredibly, those figures make the one-year payouts predicted by Duvernay operators like Chevron (CVX-NYSE) and Trilogy (TET-TSX) look conservative.
Numbers like this are creating a lot of excitement.
Like the Viking oil play in 2012, fat returns from drilling here may be setting the stage for a big round of M&A in this acreage—to the tune of millions or even billions of dollars. We’ve already seen that international plays are willing to put up that kind of money for Canadian shales—just look at Progress/Petronas paying $1.5 billion this month for Talisman’s (TLM-TSX) Montney land package.
The question is: which companies are best-positioned to benefit from Duvernay profits?
A Sneak Peak At Financial Returns
There’s two parts to this. Firstly—who’s drilling right now and starting to get a bump from Duvernay production in their cash flow numbers? Then—who has the land holdings to scale drilling out and offer the kind of “factory” that incoming majors want?
In terms of financial results, it’s still early days for the play. You’d expect drilling results to start having a material, bottom-line effect only for the smallest, least-diversified juniors here—the ones most exposed to Duvernay production.
The company that fits this bill is Yoho Resources (YO-TSX Venture). This small developer today gets about 30% of its overall production from the Duvernay.
Financials from Yoho are thus an important indication about Duvernay profitability. And so far they look pretty good.
In 2012, the company spent just under $35 million in the field and added about $58 million in proven and probable reserves. Overall, each dollar spent created about $1.70 in 2P reserves value. That’s very good—not quite the 140% returns some analysts have modeled for the Duvernay, but we may not be fully seeing yet the effect of recent wells.
Other, bigger players in the Duvernay like Athabasca Oil (TSX: ATH) and Trilogy Energy (TSX: TET) have yet to show much bump in profitability from their drilling here. Both companies saw returns on their invested capital in 2012 come in negative (victims of the higher costs that are hampering the industry).
But these firms may simply need more time for the Duvernay to trickle through to their bottom line. Both have significant operations outside of the play, which are likely affecting their stats. And a lot of their best Duvernay wells have been drilled only during the past year—we’ll need to look at the new reserves evaluations that come out early in 2014.
The Leaders in the Land Rush
But let’s assume for the moment that phenomenal early drilling results like the ones mentioned above are going to make the Duvernay a profitable play. Which companies have the land positions to develop it at scale?
The chart below from TD shows the top 10 Duvernay land holders. These holdings span three different core areas in Alberta for the Duvernay—from north to south, Kaybob, Edson and Willesden Green. Locations are shown in the map from TD. These land holdings are dominated by majors—with the smaller end represented by Athabasca, Vermillion (TSX-VET) and Trilogy.
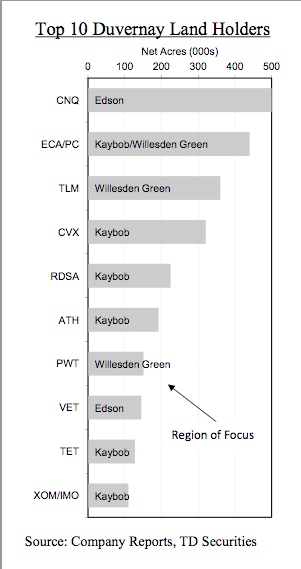
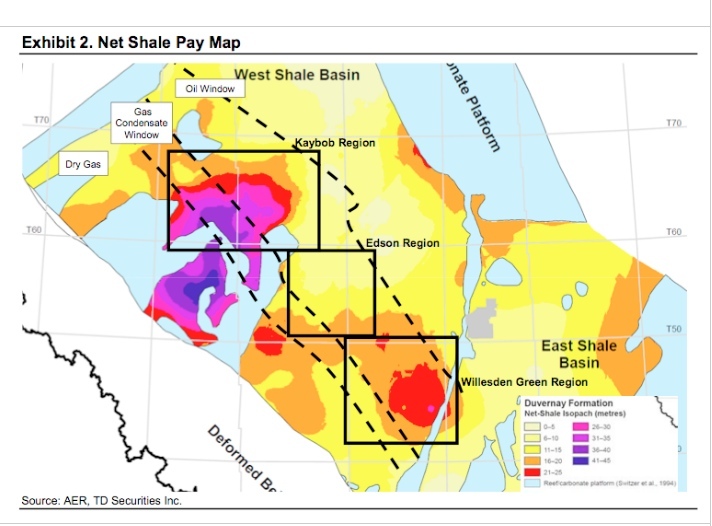
But it’s obvious from the map above that not all acreage is equal. The thickness of the Duvernay (what geo-wonks call the “isopach”) is much greater in the Kaybob area than the other cores (the purple sections are the thickest). Companies drilling in Kaybob get up to 30 metres more shale pay than those in Edson and Willesden.
One key factor appears to be making the difference: natural gas liquids.
That’s important because liquids are the main driver for gas drilling in North America today. They are why producers can still make a profit at $3/mcf gas in Canada.
For the Duvernay, liquids are especially critical—because the play produces mainly high-value condensate, which right now in Canada sells for a 10% premium to crude oil.
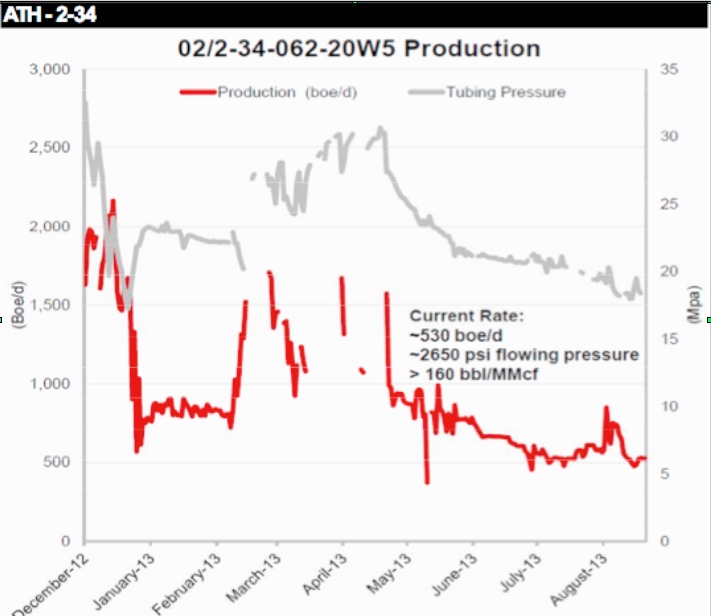
This condensate output is the key to the Duvernay’s outstanding well economics. The Athabasca 2-34 well that cash flowed $11 million in 8 months has seen averagecondensate production of 377 b/d. The big EnCana 8-5 well is the best liquids producer so far drilled in the play (at least that we know about), at 501 b/d ofcondensate.
Both of these wells were drilled in the Kaybob area—where EnCana and Athabasca are focused. Liquids production here looks to be significantly higher than in the other Duvernay operating areas.
Research from Canadian brokerage boutique Peters & Co. shows that the best liquids-producing wells in the Willesden area are only doing 140 b/d—less than half of what the good Kaybob wells are putting out.
This might be why big landholders in Edson/Willesden like Penn West (TSX-PWT) are putting their acreage up for joint venture rather than drilling it themselves.
The Best Producers in the Best Part of the Play
So, who are the leaders in the liquids-rich Kaybob area then?
Again, you need to look beyond the raw acreage numbers—to see who is in the right part of Kaybob. In this case, the liquids window.
As the map below from Dundee Capital Markets shows, the Kaybob area is oil-prone to the northeast, and produces dry gas (no liquids) to the southwest. Only in the central portion (between the two dotted black lines) does the Duvernay produce liquids-rich gas. Of course, the lines are approximate—I’ve circled in blue the approximate area that’s so far seen wells with high average condensate production of a few hundred barrels per day.
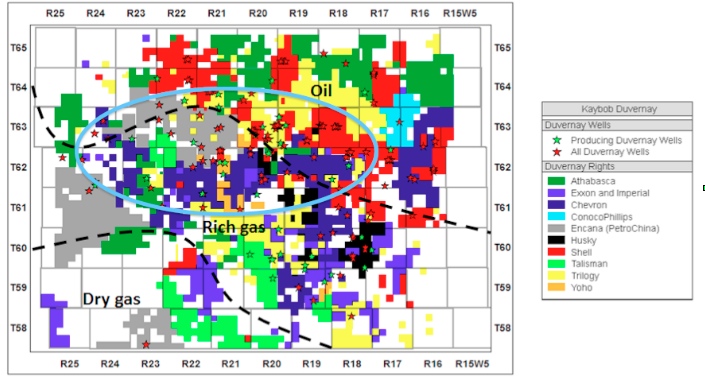
Looking at it this way changes the picture a lot.
A big landholder like Athabasca looks great on paper—except that most of its holdings (shown in dark green above) are in the oil-prone part of the Duvernay. The jury is still out on the oil window thus far. This could prove profitable too—but the big numbers on economics we’re talking about are for liquids-rich gas wells. You have to make sure you’re comparing apples to apples.
Athabasca did have the big 2-34 gas well. But this was drilled on one of only a few sections of its land that push south into the liquids-rich window.
Exxon/Imperial have also missed the spot to some degree. Although these companies have scattered holdings in the liquids-rich window, their biggest contiguous land packages are in the dry gas part of the play.
The core of the liquids-rich acreage is really held by four companies: Chevron (dark blue), EnCana (grey), Shell (red) and Trilogy (yellow). Yoho also holds a strip of land in the right area (orange)—small in the grand scheme of things, but probably material to a company with a $150 million market cap.
While Yoho is indeed a pure play, their challenge is that they are not in the data sharing group with the majors so it’s likely they will be behind on how/what technologies are improving production and lowering costs. So capital efficiencies—the cost to bring up a barrel of oil/condensate/gas–will be poorer.
Shell and Chevron are too big to get much recognition for this play in their share price. EnCana might—maybe helping them shed their reputation as an unexciting dry gas play.
Trilogy is running quickly in the Duvernay, having drilled 11 horizontals here as of October. The company will dedicate $75 million to the play in 2013—a good chunk of its total budgeted capex of $350 million for the year.
Trilogy also holds a unique advantage when it comes to producing Duvernay liquids-rich gas. The firm has a liquids processing agreement with an extraction plant in Illinois—allowing it to ship high-liquids gas here. That means two great things–they don’t have to finance expensive separation facilities—and they accessbetter product pricing in Chicago.
This will be the company to watch to see how wells here ultimately affect the bottom line.
– Keith
Related posts:
They [Different commodities] move in general in the similar direction but maybe at different times. Now, say if the price of corn goes up substantially, the farmers can right away increase the production of corn and a year later the additional supplies will then essentially contain further price increase and the price will go down.
In the case of the oil industry and also for copper, once you have shortages developing, until new large reserves come on stream and until new mines essentially produce, the response time is very long and we have essentially in the world, coming from emerging economies – those would be China and India – very rapidly rising oil demands.
In China over the last fifteen years, oil imports, they have risen three times. China consumes now almost ten million barrels of oil a day. So the demand is there, if they slow down somewhat, long-term it’s there. Every oil well eventually runs dry. It cannot produce forever. New oil is very costly to produce. In other words you have to go and drill and you have to then extract the oil and there’s a lot of safety regulations and very costly, probably around eighty Dollars a barrel.
Ed Note: You might also like:
Crude Oil is Probably Among the Most Attractive Commodities
Faber : I think it’s too late to Buy US Stocks
MADRID (MarketWatch) — Oil futures shot higher on Tuesday, paring losses from a day earlier as investor optimism grew ahead of weekly data on U.S. crude supplies that’s expected to show a drop in inventories.
Crude oil for January delivery jumped $1.15, or 1.1%, to $98.48 a barrel in electronic trading.
Brent crude for January delivery rose 87 cents, or 0.8%, to $110.26 a barrel. A continuous futures chart from FactSet shows Brent at the highest levels since September.
“WTI has been bought on expectations of another strong week of refinery demand for crude while Brent has been a reluctant follower on news that oil from Libya’s east may soon begin to flow again,” said Ole Hansen, head of commodity strategy at Saxo Bank, in emailed comments. “Upside in WTI seems limited to $100 for the time being not least considering that a Brent Crude price much above $110 seems limited at the moment.”
Oil prices on Monday settled down 0.3% on the New York Mercantile Exchange for their first loss in seven sessions after Federal Reserve officials said the central bank could begin tapering down its stimulus program at its meeting next week.
Oil prices rose 5.3% last week for their best performance since July, according to FactSet data tracking the most-active contracts.
More news from MarketWatch:
Willard: This bubble-blowing bull market won’t end well
Fed’s Bullard floats idea of small taper in December
Gilburt: Is a 100-point S&P decline out of the question?.

I know Mike is a very solid investor and respect his opinions very much. So if he says pay attention to this or that - I will.
~ Dale G.
I've started managing my own investments so view Michael's site as a one-stop shop from which to get information and perspectives.
~ Dave E.
Michael offers easy reading, honest, common sense information that anyone can use in a practical manner.
~ der_al.
A sane voice in a scrambled investment world.
~ Ed R.

Greg Weldon

Josef Schachter

Tyler Bollhorn

Ryan Irvine

Paul Beattie

Martin Straith

Patrick Ceresna

Mark Leibovit

James Thorne

Victor Adair