
Energy & Commodities
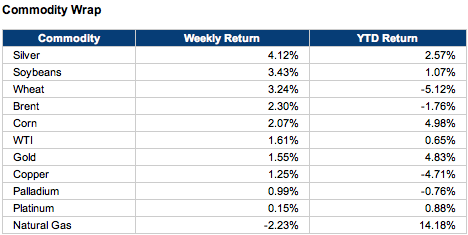
Commodities rose broadly despite challenging economic data.
It was a strong week for commodities. With the exception of natural gas, prices rallied across the board. Even stocks, which saw intense volatility early in the week, managed to finish the period up, by less than half a percent. The S&P 500 cut its year-to-date loss down to 3.2 percent from as much as 6 percent on Monday.
Macroeconomic Highlights
A pair of rather disappointing economic reports were released this week, but bullish traders hoped they were a reflection of the severe weather affecting the U.S. and not broader problems with the economy.
On Monday, ISM reported that its manufacturing PMI for the U.S. plunged from 56.5 to 51.3 in January, the lowest level since May. On the other hand, ISM said that its nonmanufacturing index ticked up from 53 to 54 to January, better than the expected 53.7 reading.
Meanwhile, the Bureau of Labor Statistics reported that employers added 113K jobs in January, well below the 180K increase that was expected. At the same time, December’s job gain was left essentially unchanged at 75K.
On the positive side, the BLS said that the unemployment rate ticked down from 6.7 percent to 6.6 percent, the lowest rate since October 2008. The fall in the unemployment rate came despite an increase in the labor force, which edged up from 62.8 percent to 63 percent.
Importantly, the nonfarm payrolls figure and the unemployment rate are derived from separate surveys, which may help explain the mixed message from these reports.
….read page 2-5 HERE

Hedge funds raised bullish gold (COMEX:GCJ14) wagers by the most since July and sold copper (COMEX:HGH14) holdings as emerging-market turmoil boosted concern the global economy will slow and increased demand for precious metals as a haven.
The net-long position in gold jumped 40% to 60,672 futures and options in the week ended Jan. 28, U.S. Commodity Futures Trading Commission data show. Long wagers rose 5.5% to the highest since September, and short bets dropped 16%. Net-bullish copper holdings tumbled 62% as shorts gained by the most in 11 weeks.
About $1.9 trillion was erased from the value of global equities last month as China’s economy slowed and the Federal Reserve further cut stimulus on Jan. 29. South Africa’s central bank increased interest rates, Turkey more than doubled them and Argentina’s peso dropped 19% against the dollar in January, more than any other currency tracked by Bloomberg. The tumult drove gold to its first monthly gain since August and copper to the worst start to a year since 2010.
“China rules the copper market, and it’s obvious that there are no reasons for this market to move higher as supply is ample, and demand is sluggish,” said Peter Jankovskis, who helps oversee $3.5 billion as co-chief investment officer of Lisle, Illinois-based OakBrook Investments LLC. “Gold, on the other hand, is seeing some buying given the turmoil in many countries, but what remains to be seen is if the rally can sustain in the face of tapering.”
Gold Rally
Gold futures gained 3.1% last month to $1,239.80 an ounce, while copper dropped 5.9% on the Comex in New York. The Standard & Poor’s GSCI Spot Index of 24 commodities fell 1.6%. The MSCI All-Country World Index of equities declined 4.1%. The Bloomberg Dollar Spot Index, a gauge against 10 major trading partners, rose 1.2%. The Bloomberg Treasury Bond Index climbed 1.8%.
Net wagers across 18 U.S.-traded commodities rose 6.5% to 782,818 contracts last week, the highest since October, the CFTC data showed.
The U.S. Mint sold 91,500 ounces of gold coins last month, the most since April, joining counterparts from Australia to Europe in reporting higher demand. Prices rebounded more than 5% since reaching a 34-month low in June as physical buying rose. Bullion shipments to China from Hong Kong in 2013 more than doubled to a record 1,108.8 metric tons from a year earlier, according to customs data. Gold futures for April delivery rose 1.6% to $1,259.50 at 1:48 p.m. in New York.
Copper Supplies
 Copper stockpiles monitored by the Shanghai Futures Exchange jumped 18% last month, the first increase since October. Global production will outstrip use by 167,000 tons this year, following a deficit of 137,000 tons in 2013, Barclays Plc estimates. The London Metal Exchange Index of the six main metals traded on the bourse fell 3.7% last month, the worst start to a year since 2010.
The economy in China, the world’s biggest consumer of everything from copper to cotton to pork, will expand 7.4% this year, the slowest pace since 1990, a Bloomberg survey showed.
Robust growth in the U.S. will help stem declines for industrial metals, and the rally in gold will be short-lived, according to James Paulsen, the Minneapolis-based chief investment strategist at Wells Capital Management, which oversees about $340 billion in assets.
Fed Stimulus
U.S. household purchases, which account for about 70% of the economy, climbed more than expected in December, Commerce Department figures showed Jan. 31. The Fed last week cut its monthly bond purchases to $65 billion from $75 billion, a second straight $10 billion cut. Goldman Sachs Group Inc. is forecasting more declines for gold after it fell 28% last year. Prices will reach $1,050 in the next 12 months, the bank said in a Jan. 12 report.
Bullion holdings through exchange-traded products fell 33% in the past year, erasing about $71 billion from the value of the funds.
“What we are seeing is broadening of economic growth, and and China is not contracting — the growth rate has slowed, but it’s still growing,” Paulsen said. “Industrial metals may slowly see an upturn once the turmoil in emerging markets calms. At that point, there will not be much upside for gold.”
Goldman View
Banks from Goldman to Citigroup say raw materials are heading for more losses in 2014 as rising supplies and slowing demand compound slumps that led to bear markets last year in gold, copper and corn. The super cycle that led commodities to almost quadruple since 2001 is reversing, with prices set to drop 3% in 12 months, Jeffrey Currie, Goldman’s head of commodities research, said in the Jan. 12 report. The asset class will be a “wallflower” compared with equities, Citigroup said in a Jan. 6 note.
Bullish bets on crude oil climbed 13% to 260,282 contracts, the biggest gain since July, government data show. Prices dropped 0.9% in January, the fourth loss in five months. The U.S. is extracting the most oil since 1989 as producers tap shale-rock formations, cutting costs for refiners and driving fuel prices at the pump down 9.7% since March.
A measure of speculative positions across 11 farm goods slid 0.3% last week, the CFTC data show. The S&P GSCI Agriculture Index of eight components dropped 1.3% in January, after a 22% decline in 2013 that was the biggest annual slump since 1981.
Wheat Bears
Investors became more bearish on wheat, boosting their net- short position, or bets on a decline, to 62,501 contracts. That compares with 56,571 a week earlier. Global production will reach 707 million tons in the season that ends in 2014, higher than a November forecast of 698 million tons, because of improving harvests from Canada to China, the London-based International Grains Council said Jan. 30.
The net-short coffee position reached 5,454 contracts, compared with 2,755 a week earlier. Arabica-coffee prices surged 9.4% last week, entering a bull market on Jan. 31, as dry weather threatened production in Brazil, the world’s top grower and exporter.
“The time when people were buying anything has moved, and now people are taking a view on individual commodities,” said Frances Hudson, a strategist at Standard Life in Edinburgh, which oversees $294 billion. “The super cycle has ended. The story for copper is neutral. The days of seeing high numbers from China may be ending. People saw gold was oversold last year, and money was moving to equities. There has been some reshuffle, but I don’t think there has been a reversal of fortune for gold.”

The lack of cheap oil will soon collapse global markets.
A bold statement, I know — especially with a U.S. “shale boom” at hand and stocks still near all-time highs.
But stocks have only risen that high because of the largest governmental intrusion on free markets the world has ever seen. Of course stocks will go up when money is free and banks aren’t accountable for their actions.
None of the problems that led up to the 2008 crash have been fixed.
And it’s been my mission for the last year or so to determine what would cause this new ruse to come to an end.
My conclusion is the perception of cheap energy is the only thing that’s keeping the free-money paper asset bubble inflated.
Let me put a finer point on it for you with a section of a brand new report I put together specifically to address this issue:
Once we understand that the majority of the world’s pension assets (including a significant portion of mutual and insurance funds) are invested into equities and bonds, it’s no secret why the Fed and the central banks are propping up the markets with their huge injections of monetary liquidity. And, of course, these injections are funneled into the broader stock indexes as well as the Treasury and bond markets.
But energy has to be burned to produce economic growth that will pay back or settle these global conventional paper assets in the future. That is why it is indeed a huge Ponzi scheme.
An individual with a retirement account or pension plan, for example, really only has a promise to receive future income streams when they retire if, “and only if,” there is a healthy growing economy. And a healthy growing economy is predicated upon a growing global energy supply.
Due to the propping-up of the economy by a massive amount of debt, Americans are able to purchase a percentage of this energy — oil that, in all likelihood, they probably could not afford otherwise.
Furthermore, this debt will never be repaid, as there will not be the available energy supply in the future to do so. As I mentioned before, there needs to be a growing economy that allows a small profit or percentage left over to either pay back debts or satisfy future retirement income streams.
Thus, the majority of conventional paper assets will lose a great deal of their value as debts are either written off or excused due to the inability to service them any longer (just like is happening in Detroit).
We must remember the majority of paper assets have parties on the other side holding the debt. For instance, the bank owns the home (asset), while the homeowner holds the mortgage (debt).
And in many cases, the bank has transferred the ownership of these mortgage-backed securities to another party such as the Federal Reserve, who purchases $40 billion a month of these financial products. So now the Fed owns the assets (really the American public), allowing the banks to sell homeowners more mortgages, which the majority will never be able to pay back in the future.
It’s one giant, happy merry-go-round to nowhere.
Now that you have a good idea of what assets are going to be experiencing serious trouble in the future and why, the proper question to ask is…. what are some of the safest assets to own?
I released this report last week, and already events are unfolding that are proving its merit.
Concerning consumers, we now know Americans burned through $46 billion in personal savings to fund December purchases. That left the Personal Savings Rate at its lowest level since January 2013.
And holiday sales were still down 0.7% at department stores in December… and down 3.3% for the full year. Last year saw the weakest retail sales in four years.
Thanks to a report out last week from the Corporation for Enterprise Development, we now also know that almost half of Americans are living in a state of “persistent economic insecurity” that makes it “difficult to look beyond immediate needs and plan for a more secure future.”
As Time Magazine summarized:
In other words, too many of us are living paycheck to paycheck. The CFED calls these folks “liquid asset poor,” and its report finds that 44% of Americans are living with less than $5,887 in savings for a family of four. The plight of these folks is compounded by the fact that the recession ravaged many Americans’ credit scores to the point that now 56% percent of us have subprime credit. That means that if emergencies arise, many Americans are forced to resort to high-interest debt from credit cards or payday loans. And this financial insecurity isn’t just affected the lower classes. According to the CFED, one-quarter of middle-class households also fall into the category of “liquid asset poor.”
So that’s the first piece of this equation: The real economy is not recovering, which is necessary for assets to increase in value.
The other way for assets to increase is with perpetually cheap energy. Many have said the shale boom guarantees this. But that is simply not the case.
Here’s what we learned last week from major oil companies…
ExxonMobil, Chevron, Shell, and Conoco all reported seriously disappointing earnings last week.
Amidst this “shale boom,” Exxon production actually fell 1.5%. And that was despite it increasing capital expenditures by 4% to over $38 billion.
Let that sink in. It spent 4% more to produce 1.5% less.
That is not a “boom” by any measure.
And it was the same story for other majors.
Chevron’s production was down 3% while it increased its debt position to $5 billion and only replaced 85% of its produced reserves.
(Five years ago, we would have been shouting this from the rooftops as proof of peak oil. So why not now?)
Conoco production fell 6%, and the company had an abysmal 3% reserve growth. Shell actually took billions in write-downs from disappointing programs in the Eagle Ford and Mississippi Lime formations.
Are you supposed to produce less, spend more, and lose money during a boom?
And remember, this comes in a $100 oil environment. These guys can’t even make money while you’re paying $3.35 at the pump.
It doesn’t get any more ironic than Bloomberg Businessweek’s write-up of what’s going on. Here’s a piece from its article last week entitled, “Big Oil Has Big Problems”:
In a way, the world’s major oil companies all suffer from some version of the same problem: They’re spending more money to produce less oil. The world’s cheap, easy-to-find reserves are basically gone; the low-hanging fruit was picked decades ago. Not only is the new stuff harder to find, but the older stuff is running out faster and faster.
Just to maintain production rates, oil companies have to race to find new reserves faster than the old ones dry up. That essentially puts them on a treadmill at which they must run faster just to keep pace—a horrible problem in any business. “It’s like feeding an elephant,” says Fadel Gheit, an energy analyst at Oppenheimer. “You can’t just give him a couple bags of peanuts. You have to find a truck load every day, just to keep him happy.”
Folks, Bloomberg just admitted all the major oil companies are facing peak oil. It’s a treadmill to nowhere.
And as this research shows, it’s going to have dire implications for the value of your paper assets.
The fire of inflated assets stoked by free money and the illusion of cheap energy is coming to a close.
Call it like you see it,

Nick Hodge
 @nickchodge on Twitter
Nick is the Founder and President of the Outsider Club, and the Investment Director of the thousands-strong stock advisory, Early Advantage. Co-author of two best-selling investment books, including Energy Investing for Dummies, his insights have been shared on news programs and in magazines and newspapers around the world. For more on Nick, take a look at his editor’spage.
On Monday, crude oil lost 0.84% as weaker-than-expected U.S. and Chinese economic data fueled concerns over crude oil demand. Thanks to this news, light crude closed the day below $97 for the first time since Jan.27.
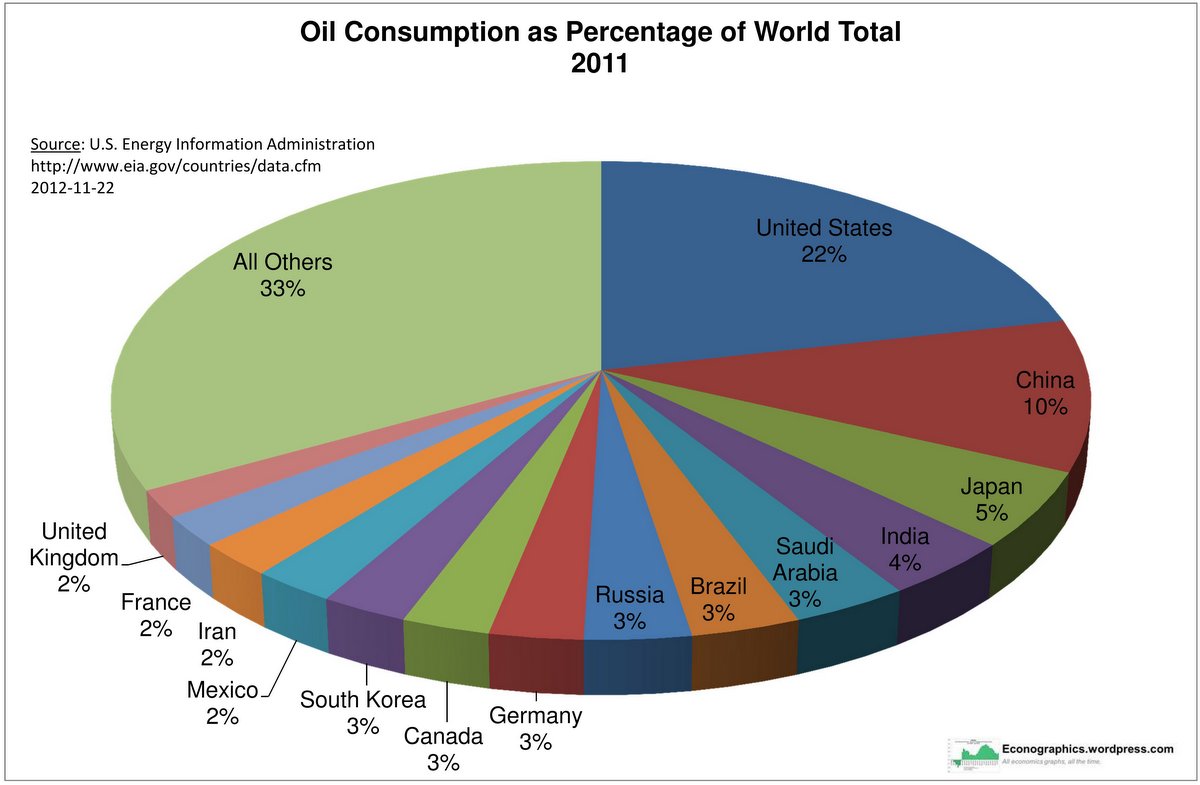
Data released over the weekend showed that China’s Manufacturing Purchasing Managers’ Index dropped to a six-month low, falling to 50.5 in January from 51.0 in December. This weaker-than-expected numbers raised questions about economic growth in the world’s second largest oil consumer (after the U.S.) and weighted on the price of light crude.
On top of that, yesterday’s data showed that U.S. manufacturing PMI dropped to 53.7 in January (from December’s 55.0). Additionally, the Institute for Supply Management said that its manufacturing purchasing managers index fell to 51.3 in January (a seven-month low), while analysts expected the index to moved down to 56.4. The above data added to recent worries about weakness in emerging markets and fueled concerns over crude oil demand sending crude oil below $97.
Having discussed the above, let’s move on to the technical changes in the crude oil market (charts courtesy of http://stockcharts.com).
In our last Oil Trading Alert, we wrote:
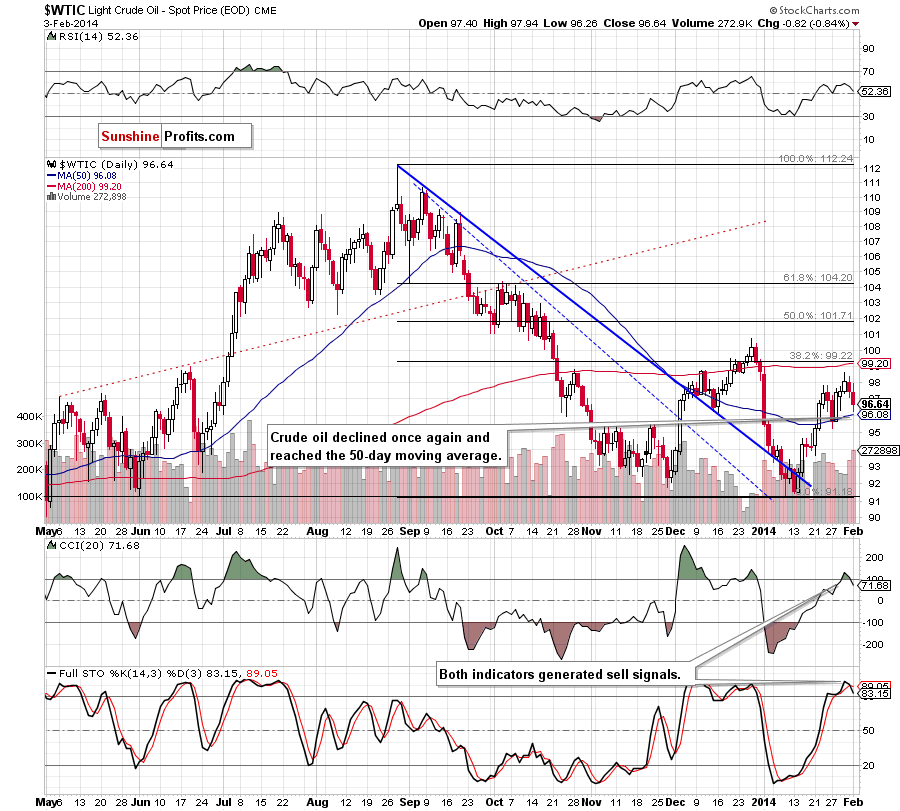
(…) crude oil extended its decline and (…) slipped below the previous high, which is not a positive signal – especially when we take into account the fact that Friday’s drop materialized on relatively large volume. On top of that, the CCI and Stochastic Oscillator are overbought and close to generating sell signals. Connecting the dots, it seems that a bigger pullback is just around the corner.
As you see on the above chart, crude oil extended losses and approached the 50-day moving once again. If this strong support encourages buyers to push the order button, we will likely see a corrective upswing in the coming days. However, if it is broken, we will see further deterioration and the next downside target will be the Jan.27 low at $95.21. At this point it’s worth noting that yesterday’s downswing materialized on large volume, which confirms the strength of the sellers. Additionally, the CCI and Stochastic Oscillator generated sell signal, which supports the latter scenario.
Having discussed the current situation in light crude, let’s take a look at WTI Crude Oil (the CFD).
Quoting our last Oil Trading Alert:
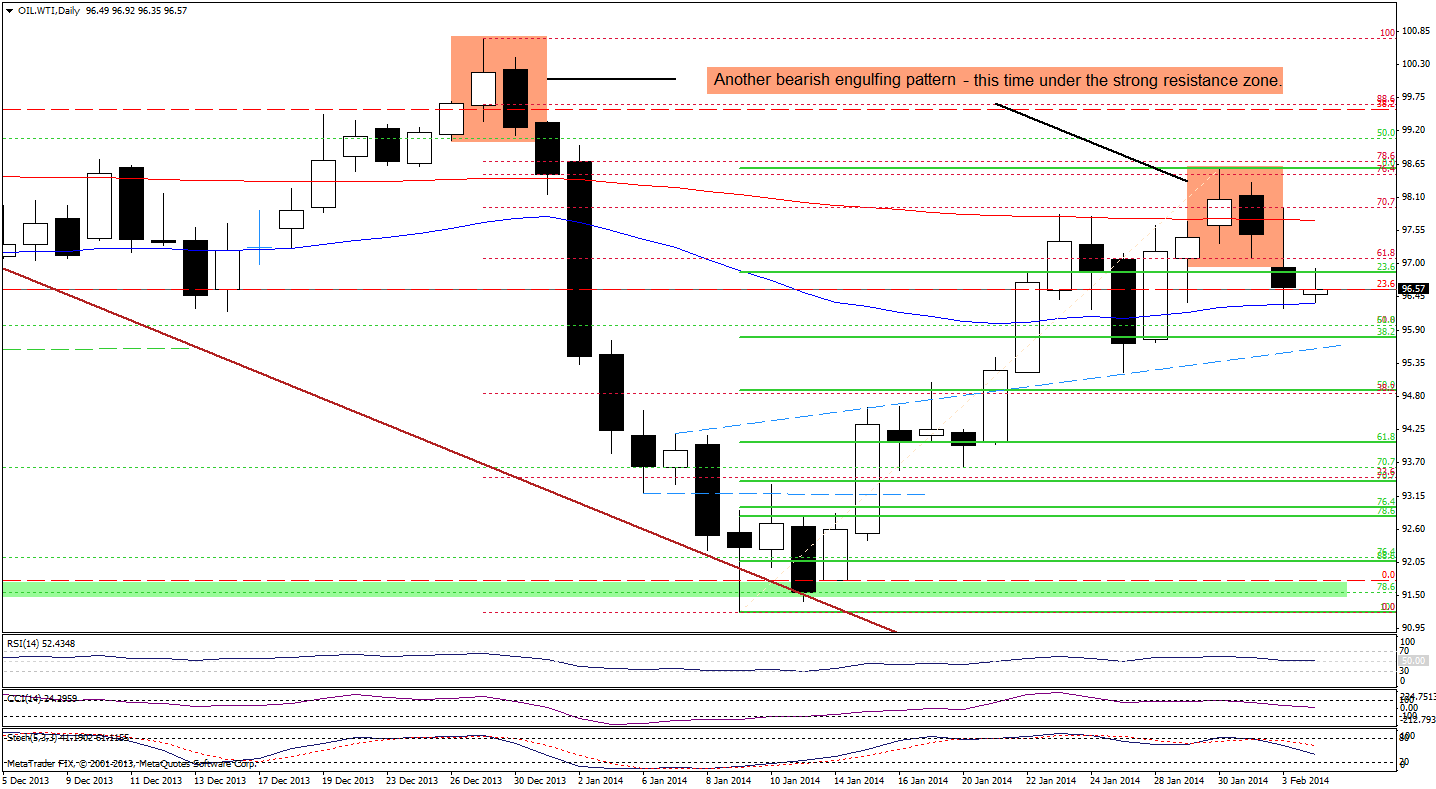
(…) the CFD formed a bearish engulfing pattern (…) such candlestick formation triggered a strong sell off at the end of December. From this perspective, it seems that if oil bulls do not manage to invalidate this bearish pattern, we may see similar price action in the coming days (…) the CCI and Stochastic Oscillator generated sell signals, which is another bearish sign (we saw similar situation in previous months and back then it had a negative impact on the price). Please note that the nearest support is the 50-day moving average (currently around $96.37), which corresponds to the Jan.29 low.
Looking at the above chart, we see that WTI Crude Oil extended its decline, dropped below the 23.6% Fibonacci retracement level and reached the 50-day moving average. As you see on the daily chart, this strong support encouraged oil bulls to act and triggered a small (at least at the moment when these words are written) corrective upswing earlier today. Despite this growth, the CFD still remains below the previously-broken 200-day moving average, which serves as resistance. Additionally, sell signals remain in play supporting the bearish case.
At this point, we should consider two scenarios. On one hand, as long as the CFD remains above the 50-day moving average, further declines are limited and we may see another attempt to move higher (even to the 200-day moving average). On the other hand, we should keep in mind that oil bears have more favorable factors on their side and if the 50-day moving average is broken, we will see a drop to (at least) the 38.2% Fibonacci retracement level based on the recent rally.
Summing up, the situation has deteriorated as the CCI and Stochastic Oscillator generated sell signals and crude oil declined (on large volume) to the 50-day moving average. As mentioned earlier, if this strong support encourages oil bulls to act, we will likely see a corrective upswing in the coming day (or days). However, if it is broken, we will see further deterioration and the next downside target will be the Jan.27 low at $95.21. Please note that the current situation in the CFD is similar to what we noticed in the case of light crude, and WTI Crude Oil doesn’t give us any particular clues about future’s moves in crude oil. Nevertheless, in both cases oil bears have more favorable factors on their side and it seems that further deterioration is just around the corner.
Very short-term outlook: mixed
Short-term outlook: bullish
MT outlook: bullish
LT outlook: mixed
Trading position (short-term): In our opinion, there were no significant changes in crude oil that justify opening short or long positions at the moment. We will keep you informed should anything change, or should we see a confirmation/invalidation of the above.
Thank you.
Nadia Simmons
Forex & Oil Trading Strategist
* * * * *
Disclaimer
All essays, research and information found above represent analyses and opinions of Nadia Simmons and Sunshine Profits’ associates only. As such, it may prove wrong and be a subject to change without notice. Opinions and analyses were based on data available to authors of respective essays at the time of writing. Although the information provided above is based on careful research and sources that are believed to be accurate, Nadia Simmons and his associates do not guarantee the accuracy or thoroughness of the data or information reported. The opinions published above are neither an offer nor a recommendation to purchase or sell any securities. Nadia Simmons is not a Registered Securities Advisor. By reading Nadia Simmons’s reports you fully agree that he will not be held responsible or liable for any decisions you make regarding any information provided in these reports. Investing, trading and speculation in any financial markets may involve high risk of loss. Nadia Simmons, Sunshine Profits’ employees and affiliates as well as members of their families may have a short or long position in any securities, including those mentioned in any of the reports or essays, and may make additional purchases and/or sales of those securities without notice.

-
I know Mike is a very solid investor and respect his opinions very much. So if he says pay attention to this or that - I will.
~ Dale G.
-
I've started managing my own investments so view Michael's site as a one-stop shop from which to get information and perspectives.
~ Dave E.
-
Michael offers easy reading, honest, common sense information that anyone can use in a practical manner.
~ der_al.
-
A sane voice in a scrambled investment world.
~ Ed R.
Inside Edge Pro Contributors

Greg Weldon

Josef Schachter

Tyler Bollhorn

Ryan Irvine

Paul Beattie

Martin Straith

Patrick Ceresna

Mark Leibovit

James Thorne

Victor Adair