
Energy & Commodities
There was a time when one nation was indisputably the powerhouse for copper production: Chile.
The South American nation has some unique things going for it. Excellent geology–and good geography. With many Chilean copper projects located in unpopulated desert. A place where there’s little flora or fauna to be impacted by mining activity.
News last week suggests those advantages are now being reenforced by new infrastructure development. Helping alleviate doubts that have arisen of late about Chile’s status as a place for mine development.
Particularly when it comes to electric power.
Chilean electric firm E-CL announced on January 29 it has begun construction on one of the most important power projects in the country. A new electric line that will link Chile’s southern and northern power grids.
This could be a critical boost for miners in Chile’s northern copper-producing regions. Who have of late been faced with power shortages and rising electricity prices due to insufficient feed in this part of the country.
E-CL’s new development should help address these issues. By allowing more-abundant power supply from the south to flow northward to where miners need it most.
This shoring up of the power grid will go a long way in cementing Chile’s place as the best place on Earth to produce copper. There had been some doubts lately over the future of mining here–with concerns over power and water supply being some of the chief sticking points.
But if the power situation gets addressed, the nation will ensure an industry-leading environment for development. Big deposits, low population, and manageable infrastructure costs. You simply don’t find those three things together in many places on Earth.
To be sure, there are still a few kinks to be worked out. Including concerns about water supply, and legal permitting in the country.
But the re-vamped grid should mean at least one big box ticked. The global copper industry is certainly paying attention.
Here’s to staying on top,
dforest@piercepoints.com / @piercepoints / Facebook


On Friday the State Department released its environmental impact report on the Keystone XL pipeline.
In short, the report concluded that the Keystone XL pipeline, which brings Canadian crude oil to the U.S., will have a negligible effect on climate change.
This is huge news for America’s energy future.
As we’ve covered in the past, the State Dept’s report will play a huge role in Obama’s final approval/denial of the pipeline deal. Today we’ll take a look at the latest news, and show why one geographically challenged province is in for a windfall…
To make sure we’re on the same page, the Keystone XL Pipeline is a project slated to carry 800,000 barrels of crude oil from Hardisty, Alberta (Canada) to Steele City, Nebraska. From there, the oil will head south and find its way to U.S. refineries on the Gulf Coast.
“Because the northern stretch of Keystone XL, which would carry 830,000 barrels a day from Hardisty, Alberta, Canada, to Steele City, Neb., would cross a U.S. border” the LA Times reports, “it needs a so-called presidential permit from the State Department.”
Long story short, this approval has been waiting in the wings for years. And most recently, president Obama has said that his (long-awaited) decision to approve/deny the pipeline will hinge on whether or not the project will increase climate change.
That’s where Friday’s report comes in to play.
According to the Bloomberg, “In its final environmental review, the U.S. State Department found the Canada-U.S. oil pipeline would not greatly increase carbon emissions because the oil sands in Alberta will be developed anyway.”
In a nutshell, this paves the way for a presidential approval. (A good thing if you ask me!)
Whether you like Canadian oil sands and shale oil development or not, it’s much better that the oil comes through the U.S. than just bypassing us all together and heading to Asia. [What to see some common misconceptions about this pipeline project? Click here for 5 Myths About The Keystone XL]
With the approval of Keystone XL, the U.S. will be much, much, much more removed from our dependence on Middle East oil. Frankly, it’s a joke that our president wouldn’t be honored to approve this pipeline deal. But instead he tried – with tooth and nail – to stop it.
With Friday’s environmental report, an approval is looking much more inevitable. That means more abundant, secure crude will be flowing into the pipeline arteries of America.
But, of course, there’s much more to the story!
The Great Reversal
This is all part of a fantastic turnaround story here in the U.S.
For decades leading up to 2005, America’s energy future looked grim. Crude imports from the Middle East continued to edge higher, while at the same time domestic production continued to dwindle.
More imports and less production at home? It was a horrible recipe for our country’s trade balance. Not to mention, much of that oil was coming from unstable hot zones like the Middle East, Nigeria and Venezuela. Ugh.
But the tide started to change after 2005. Whispers in the U.S. oil and gas field started getting louder. And before anyone knew it oil and gas production was heading higher here in the states. America was sitting on a huge bounty of unconventional oil and gas. Energy that was once thought to be trapped in tight rock or “shale” formations, was now coming to the surface.
U.S. ingenuity, hard work, established infrastructure and two technological breakthroughs – hydraulic fracturing and horizontal drilling – changed the game here in the U.S. Oil and gas are coming to the surface at an stunning rate – and to be sure this unexpected U.S. production is changing the game.
Add it all up and we’re in the middle innings of a great reversal.
Instead of importing OPEC oil at our Houston refineries and shipping it north to the rest of the country. We’re starting to produce much more oil and gas inland – so much so that a glut of oil was being sent to a major storage center at Cushing, OK.
With a new direction for U.S. oil, it all comes back to pipelines.
A year ago, as we reported here, another pipeline (the Seaway Pipeline) made headlines when it completed a symbolic reversal. Instead of shipping oil north from Houston to Cushing – the pipeline reversed its flow and now sends 400,000 barrels per day SOUTH, from Cushing to Houston.
Another big part of America’s “new” energy direction was the southern leg of the Keystone Pipeline (noted below in the southern section of the dotted yellow line.)
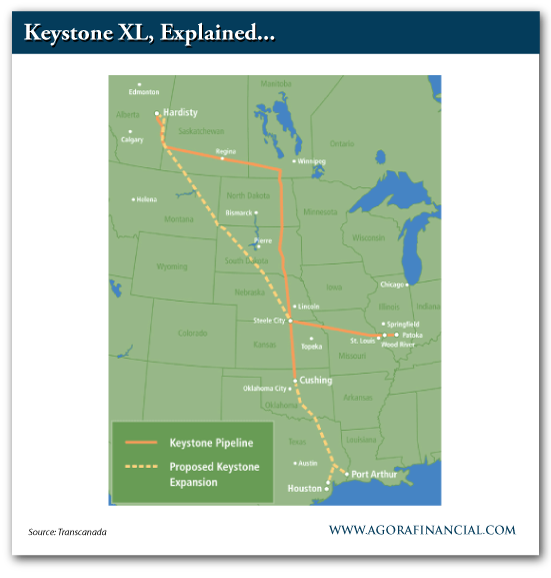
This month oil started flowing in this southern leg, which carries crude south from Cushing to Port Arthur, TX.
The southern leg of Keystone and the Seaway Pipeline are alleviating the glut of “stranded” oil from Cushing – they’re helping balance and utilize America’s new oil bounty.
And to be sure, it’s not just America that’s seeing booming oil and gas production (and the need for pipelines), which brings us back to Friday’s State Dept. report…
Big News For Our Neighbors To The North
Although the northern leg of the Keystone XL pipeline hasn’t been officially approved yet, the State Dept’s report all but paves the way for an Obama approval.
This is huge news for our neighbors to the north, especially Alberta, Canada where the Keystone pipeline begins.
Alberta, Canada is an energy rich province with one major drawback: it’s landlocked.
Without a diplomatic way to get its crude oil and natural gas to market the province was essentially out of luck. At one point several months ago the price for Alberta’s crude (since it was landlocked) had plummeted some $20-30/barrel lower than the price of most U.S. barrels.
That glut of energy spells opportunity.
With a pipeline approval Alberta’s budding oil sands and shale plays are bound to blossom. This is huge news for energy producers – oil sands and shale plays.
With the penultimate step for this pipeline approval in our rearview, now’s the time to look north for potential windfalls.
Friday’s report marks the next phase of North America’s energy boom – and it starts in Alberta.
Keep your boots muddy,
Matt Insley
P.S. We’re witnessing a sea-change in America’s energy future. With more shale oil coming from the U.S. and Canada the companies that can move the crude are set for massive growth. And remember, it’s not just pipelines you should look at. In fact, one overlooked sector has been chugging along over the past 18 months. For our favorite ways to play it, read more here.

The proposed Keystone XL pipeline cleared a key hurdle today with a government study that found its impact on the climate would be minimal, which supporters said meets President Barack Obama’s test for allowing the project to be built.
In its final environmental review, the U.S. State Department found the Canada-U.S. oil pipeline would not greatly increasecarbon emissions because the oil sandsin Alberta will be developed anyway.
The study, while not the final word, is important because Obama has said he wouldn’t approve Keystone if it would exacerbate carbon pollution. Now the pipeline’s fate comes down to broader questions about whether the project is in the U.S. national interest, weighing matters such as energy needs and diplomatic relations. – Full Article HERE
Related: This Is Not the Keystone Decision That You Think It Is
CNBC’s “By the Numbers” recently reviewed the predictive power of the January Barometer with the following observations:
“The January barometer has been right in 62 of the last 85 years, or 73 percent of the time. Since 1929, the index followed January’s direction 80 percent of the time when it finished positive, and 60 percent of the time, when it finished negative.
More recently, in the past 35 years, the S&P 500 (SPY) followed January’s direction 25 times, or 71 percent of the time…”
I was happy to see that the first set of observations segmented the analysis by up and down January months. I was puzzled why the analysis of the last 35 years did not include the same segmentation…until I reviewed the table the article provided for readers to see the numbers for themselves.
The past 35 years have been VERY bullish in terms of the number of up years. Thus it should come as little surprise that it is very difficult to find a good barometer for a down year. There have only been eight down years in the past 35 years. This elite group includes 2011 which was down a fraction at -0.003%. Of these elite eight years, only five (63%) January months were also down. So flip one negative January around – say 2002 where January delivered a -1.56% performance – and suddenly the odds are just 50/50 that a down year includes a down January. Even more telling is that in these 35 years, January closed down 12 times, yet, in those years, the S&P 500 closed the year down only FIVE times! This history of just 42% correct is much worse than the 60% cited over the last 85 years. These are poor betting odds for concluding that 2014 will be a down year because January this year delivered a -3.6% performance.
I am not sure why 35 years is considered recent, but I prefer to go back to 1951 when I play with these kinds of historical relationships. I find it convenient to look at the post-war period with a few years of buffer from the end of World War Two. When I look at THIS slice of time, the January barometer is even less convincing for down years or for down months of January.
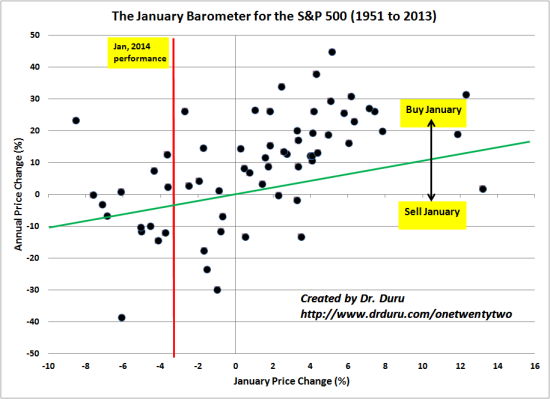
The scatter plot below charts annual price change of the S&P 500 on the y-axis and the monthly price change for January on the x-axis.
The red, vertical line shows where January, 2014 performed. Note that there have only been three years since 1951 where January performed similar to 2014. Two of those three years ended up delivering gains for the entire year: January was an opportunity to buy the dip.
The green diagonal line marks where January and the S&P 500 perform exactly the same. Above that line are years where buying at the end of January still delivered gains at the end of the year. Below that line is where buying at the end of January delivered a loss for the year. Here again, January’s predictive powers are suspect. There are 24 years where January closed down for the month. Buying at the end of January in thirteen, or just over half, of those years would get you at least even by the end of the year. Similarly, in just thirteen of those years did the S&P 500 also decline. Move your eyes to the right half of the graph where January closes the month up, and it is very obvious that the vast majority of up months of January lead a positive year.
The overall correlation between January’s performance and performance for the year is only 0.55 – and remember the annual performance in this correlation includes January’s performance! The correlation between January’s performance and performance for the rest of the year (the remaining eleven months) is ONLY 0.28.
 The January Barometer for the S&P 500 (1951 to 2013)
Source for prices: Yahoo Finance
In other words, celebrate when January is up. Cross your fingers (or roll the dice) when January is down…or choose a timeframe for analysis that makes you feel more comfortable.
The likely reason why people even pay attention to the January barometer is that negatively performing years for the S&P 500 tend to be VERY bad, disastrous even. The one year everyone wish they heeded the call of January was of course 2008 when January closed with a -6.1% performance and the year closed with a -38.5% performance, the absolute worst year almost anyone still active in the stock market can remember…
Be careful out there!
Additional disclosure: I am long SSO through call options, and I also own SSO put options.

The biggest story this week in oil and gas is declining profits and production and soaring project costs for the supermajors as disappointing fourth-quarter 2013 earnings come in, among other bad news for the big boys.
According to the Wall Street Journal, Chevron, Exxon Mobil and Shell spent more than $120 billion in 2013 to boost oil and gas output, but production is declining and they’re having a hard time justifying these costs.
Exxon Mobil’s fourth-quarter earnings, released yesterday, were down largely due to a 1.8% drop in oil and gas output and project delays in Canada and Kazakhstan. Q4 2013 earnings came in at $8.4 billion, down 16.1% from the previous year when it was at $10 billion. Revenues fell to $110.9 billion in Q4 2013, well below market expectations. This is down from $114.7 billion in Q4 2012.
Then we have Shell, which issued a “significant” profit warning on 17 January, and whose Q4 2013 earnings of $2.9 billion were down from $5.6 billion for the same quarter in 2012. Shell blames high exploration costs and problems in Nigeria for the most part. Overall, profits were down 71% based on earnings statements released on Thursday. Shell’s oil production was down 5% in 2013 to 3.25 million barrels per day, largely because of issues in Nigeria and overall natural decline in its mature oil fields.
The situation is forcing Shell and its new CEO, Ben van Beurden (only a month at the helm), to rethink its strategy and start disposing of assets and refocusing this year.
Among other things, Shell is suspending its Arctic drilling program in Alaska. This decision also comes on the heels of a US Court of Appeals decision on 22 January that said the US Department of Interior had violated the law when it auctioned off exploration blocks in Alaska’s Chukchi Sea. It could just mean a break for Shell in the Arctic, or it could derail exploration here entirely—we’re not sure yet. To date, Shell has invested well over $5 billion in its Arctic drilling projects and spent six years fighting legal challenges from environmental groups.
Shell’s new CEO has a new, more conservative vision that involves disposing of some burdensome assets and perhaps looking at some more efficient projects down the line.
“We have lost some momentum in operational delivery, and we can sharpen up in a number of areas,” van Beurden said in a statement. “2014 will be a year where we are changing emphasis, to improve our returns and cash flow performance.”
Shell has agreed to sell $2.1 billion in holdings in Australia and Brazil and is said to be considering divesting some of its troublesome Nigeria assets. There has also been talk that Shell might sell off all or part of its $6.3 billion stake in Woodside Petroleum Ltd. The company has already sold around $300 million in assets in Q4 2013, including a liquids-rich shale play in Ohio.
Chevron is set to announce its Q4 2013 and full-year earnings today, while the expectations here are not the declines we have seen in Shell and Exxon, Chevron, too, is spending a lot on monster projects. Chevron’s Gorgon LNG project, for instance, is expected to come in at $54 billion, or $20 billion more than originally expected.
So this year will be a definitive year for the supermajors and we’ll be watching the divestments—and acquisitions—very carefully. At the same time, we’ll also be looking more closely at some small- and mid-cap companies who are managing to balance risk and reward at a better pace.
This weeks report comes from Premium’s Inside Investor and Dan Dicker takes a look at the natural gas market and whether there are still good opportunities for investors. (See the full report below the introduction.)
Do also take a minute to find out about Oilprice Premium – we have a superb letter lined up this week and in addition to the reports you will have full access to the archive and receive the next 4 weeks letters completely free. There is no risk to you and you can cancel anytime within the 30 day free trial. Click here to find out more.
That’s it from us this week.
I hope you enjoy the below report and have a great weekend.
Best regards,
James Stafford
Editor, Oilprice.com

-
I know Mike is a very solid investor and respect his opinions very much. So if he says pay attention to this or that - I will.
~ Dale G.
-
I've started managing my own investments so view Michael's site as a one-stop shop from which to get information and perspectives.
~ Dave E.
-
Michael offers easy reading, honest, common sense information that anyone can use in a practical manner.
~ der_al.
-
A sane voice in a scrambled investment world.
~ Ed R.
Inside Edge Pro Contributors

Greg Weldon

Josef Schachter

Tyler Bollhorn

Ryan Irvine

Paul Beattie

Martin Straith

Patrick Ceresna

Mark Leibovit

James Thorne

Victor Adair