

CNBC’s “By the Numbers” recently reviewed the predictive power of the January Barometer with the following observations:
“The January barometer has been right in 62 of the last 85 years, or 73 percent of the time. Since 1929, the index followed January’s direction 80 percent of the time when it finished positive, and 60 percent of the time, when it finished negative.
More recently, in the past 35 years, the S&P 500 (SPY) followed January’s direction 25 times, or 71 percent of the time…”
I was happy to see that the first set of observations segmented the analysis by up and down January months. I was puzzled why the analysis of the last 35 years did not include the same segmentation…until I reviewed the table the article provided for readers to see the numbers for themselves.
The past 35 years have been VERY bullish in terms of the number of up years. Thus it should come as little surprise that it is very difficult to find a good barometer for a down year. There have only been eight down years in the past 35 years. This elite group includes 2011 which was down a fraction at -0.003%. Of these elite eight years, only five (63%) January months were also down. So flip one negative January around – say 2002 where January delivered a -1.56% performance – and suddenly the odds are just 50/50 that a down year includes a down January. Even more telling is that in these 35 years, January closed down 12 times, yet, in those years, the S&P 500 closed the year down only FIVE times! This history of just 42% correct is much worse than the 60% cited over the last 85 years. These are poor betting odds for concluding that 2014 will be a down year because January this year delivered a -3.6% performance.
I am not sure why 35 years is considered recent, but I prefer to go back to 1951 when I play with these kinds of historical relationships. I find it convenient to look at the post-war period with a few years of buffer from the end of World War Two. When I look at THIS slice of time, the January barometer is even less convincing for down years or for down months of January.
The scatter plot below charts annual price change of the S&P 500 on the y-axis and the monthly price change for January on the x-axis.
The red, vertical line shows where January, 2014 performed. Note that there have only been three years since 1951 where January performed similar to 2014. Two of those three years ended up delivering gains for the entire year: January was an opportunity to buy the dip.
The green diagonal line marks where January and the S&P 500 perform exactly the same. Above that line are years where buying at the end of January still delivered gains at the end of the year. Below that line is where buying at the end of January delivered a loss for the year. Here again, January’s predictive powers are suspect. There are 24 years where January closed down for the month. Buying at the end of January in thirteen, or just over half, of those years would get you at least even by the end of the year. Similarly, in just thirteen of those years did the S&P 500 also decline. Move your eyes to the right half of the graph where January closes the month up, and it is very obvious that the vast majority of up months of January lead a positive year.
The overall correlation between January’s performance and performance for the year is only 0.55 – and remember the annual performance in this correlation includes January’s performance! The correlation between January’s performance and performance for the rest of the year (the remaining eleven months) is ONLY 0.28.
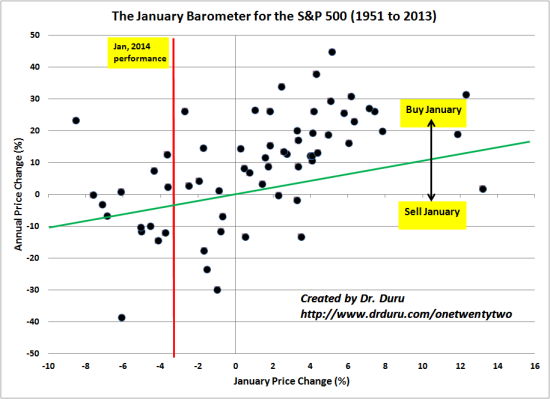 The January Barometer for the S&P 500 (1951 to 2013)
Source for prices: Yahoo Finance
In other words, celebrate when January is up. Cross your fingers (or roll the dice) when January is down…or choose a timeframe for analysis that makes you feel more comfortable.
The likely reason why people even pay attention to the January barometer is that negatively performing years for the S&P 500 tend to be VERY bad, disastrous even. The one year everyone wish they heeded the call of January was of course 2008 when January closed with a -6.1% performance and the year closed with a -38.5% performance, the absolute worst year almost anyone still active in the stock market can remember…
Be careful out there!
Additional disclosure: I am long SSO through call options, and I also own SSO put options.


