
Economic Outlook
When no-name naysayers opine that the U.S. economy is headed into a tailspin, you can often take it with a grain of salt.
But when credible, well-established government agencies issue hard data denoting a big decline, it’s a different story: You’ve got to stand up and pay attention.
Consider, for example …
The U.S. Energy Information Administration (EIA), the primary government authority on energy stats and analysis. Unlike the Fed, it doesn’t make policy or even advocate policy. By law, no outside officer or employee of the government can interfere with what it concludes or says.
And right now, the EIA says that …
Just from August to September, U.S. crude oil production declined by 120,000 barrels per day …
Production will continue to fall sharply next year, leading to a mass reduction in spending on major oil projects. And, to add insult to injury …
U.S. crude oil supplies have just surged by 7.6 million barrels — over four times more than analysts expected.
Meanwhile, executives attending the Oil and Money conference in London warn that a “dramatic decline” in U.S. production is now under way.
Their reasons: world oil prices are now too low to support U.S. shale oil output, the biggest addition to world production over the last decade. And it’s not just because of declining oil prices; bank financing for shale projects has completely dried up.
OPEC agrees. The oil cartel sees U.S. production falling for the first time since 2008. The big problem is that, despite falling global demand, OPEC members are not cutting production like they might have in prior years. They’re too afraid to lose an even bigger share of the global oil market. So they continue to pump oil at a feverish pace.
Impact on global oil prices: No relief from record lows.
Impact on U.S. economy: Huge. The U.S. energy industry is the third-largest industry in the U.S. And that excludes thousands of companies and millions of jobs that feed off the industry indirectly.
 The U.S. Department of Agriculture (USDA), unlike the EIA, is responsible for policy. But ever since Abraham Lincoln started the agency during the U.S. Civil War, millions of players in the commodity markets have relied on its forecasts.
And right now, U.S. agriculture is getting killed.
Take wheat, for example, one of the America’s largest field crops: According to the USDA’s Economic Research Service, U.S. wheat exports have plunged to their lowest level in guess how many years!
Not 10. Not 20. But 44!
That’s right. The last time our wheat exports were this bad was back in 1971.
The big problem: The United States is virtually priced out of the global wheat trade, with still more hits to U.S. exports on the way.
But this disaster is not limited to just one crop or even one industry. Indeed, the primary driver of the slump is a powerful force that cuts across all U.S. exports — the sharp rise in the U.S. dollar.
According to Bob Young, chief economist at the American Farm Bureau Federation, it’s the dollar’s 20% surge since July 2014 that’s mostly responsible for gutting U.S. farmers. (And, as I’ll illustrate in a moment, it’s also the same force that’s now killing U.S. corporate earnings.)
Meanwhile, foreign farmers and agribusinesses can jump in and sell their commodities at dramatic discounts, thanks to an unprecedented plunge in their local currencies.
Brazilians, for example — leading producers of soybeans, coffee and sugar — can greatly undercut U.S. farmers thanks to a 42% crash in the Brazilian real since last July. Russian farmers? They’re leveraging a currency collapse of 48%.
All “contained” to energy and commodities? No way! Anyone who buys that argument is in for a rude awakening, as I’ll show you next.
 At the U.S. Department of Labor, the headline unemployment number is not quite as reliable as stats from the other government agencies I just told you about.
But when all their underlying data is terrible … when big companies are announcing layoffs … and when every other source paints the same dark picture, then you know the trouble is for real.
That’s the situation we have now: In the last couple of months, nervous U.S. employers — small, big and huge — have suddenly started to pull back sharply on their hiring.
A key reason: On top of the U.S. dollar being strong, foreign markets have plunged, foreign buyers have shunned U.S. goods, and U.S. manufacturers are getting stuck with big unsold inventories.
But if you think the latest job numbers were bad, brace yourself for what’s coming next. Giant U.S. companies like Caterpillar, Hershey, Wal-Mart, ConAgra Foods, Chesapeake Energy and others have already announced big layoffs, and these layoffs are not yet included in the Labor Department’s unemployment stats.
There was one bright spot in the September job numbers, though: Most retail companies continued hiring.
The problem: Now the retail sector is also starting to take a hit …
 We know because of the latest release last week from the U.S. Department of Commerce.
Now, if sheer size (not gross inefficiencies) were the criteria, this executive-branch agency would probably be the most impressive data source in the world.
But regardless of their problems, there’s little argument that U.S. retail sales are now getting hammered.
September sales were only half of what economists were expecting …
The gains previously reported for August were totally bogus — completely wiped out by revisions, and …
Only six out of 13 categories showed sales gains, a sign that the malaise is starting to spread throughout the economy.
The clincher to all this is corporate earnings: Despite a few notable exceptions here and there (like Citigroup last Thursday), one major company after another is releasing shockers that cast a shadow over the entire U.S. economy.
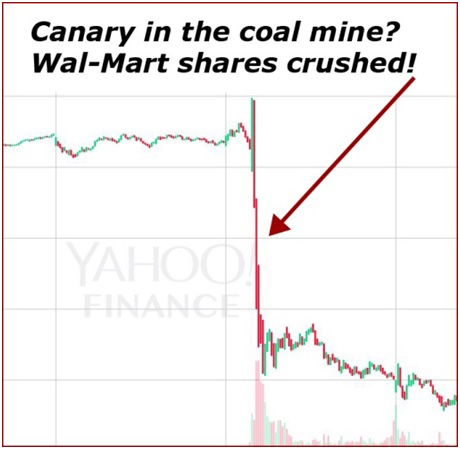 The prime example is retail supergiant Wal-Mart.
It’s the world’s largest retailer. It has nearly half of a trillion dollars in annual revenues. And it’s gotten crushed.
Last Wednesday, it announced its profits will miss forecasts by a country mile: Rather than rising 4% in the next fiscal year as analysts expected, they’re going to fall 12%.
Result: Wal-Mart shares suffered their biggest one-day crash in 17 years.
But they’re not alone. CNBC highlights how even industry sectors thought to be immune are now falling by the wayside — luxury goods (example — Burberry), health care (e.g. HCA), consumer discretionary (Garmin), and many more.
Look. Even assuming stock analysts have learned their lesson and are finally getting it right, S&P 500 profits are now forecast to drop at the fastest rate since the tail end of the Great Recession.
What does all this mean? I don’t think I have to connect the dots for you. It’s obviously not good for stock investors … unless you can do four things:
- Use stock market rallies — like the one we’ve seen in recent days — to help build a huge, oversized cash position.
- Wait patiently for most stock prices to take another big hit, whether now or later.
- Then, consider strictly extreme top-notch quality.
- And hedge your risk with investments that are designed to go up when stocks go down.
Good luck and God bless!
Martin

 The Government’s strange and awesome powers
Six years after the recession ended, we are due for another recession. Many experts say that the government is “out of bullets” to fight the next severe downturn. That’s quite false because 2008 marked the start of a new era in which our leaders manage the business cycles using strange and awesome tools. We’ll learn the long-term effects of these tools slowly, probably only decades later.
“All is not lost until you run out of airspeed, altitude, and ideas.” — Pilots’ wisdom.
….continue reading this interesting article HERE – Money Talks Editor
Historic. Landmark. Groundbreaking. Revolutionary.
These are among many of the words that have been used lately to describe the Trans-Pacific Partnership (TPP) trade pact, which was finally signed in Atlanta this Monday by 12 participating Pacific Rim nations.
The current members include Canada, the United States, Mexico, Peru, Chile, Japan, Vietnam, Malaysia, Brunei, Singapore, Australia and New Zealand.

After nearly seven years of negotiations, the TPP promises to deliver unprecedented free and fair global trade among the 12 participant nations.
Once ratified by each country’s congress or parliament—which is likely to happen in early 2016—the accord will become the most significant, most economically-impactful trade deal in history. As many as 18,000 tariffs are expected to be eliminated. It will remove barriers to foreign investment, streamline customs procedures and create an international investor-state dispute settlement (ISDS) system, among much more.
The Peterson Institute for International Economics, a Washington, D.C.-based think tank, predicts that the resultant savings could boost the world economy by an incredible $223 billion by 2025.
….read much more on TPP as well as SWOT analysis of Stocks, Bonds, Gold and Energy HERE
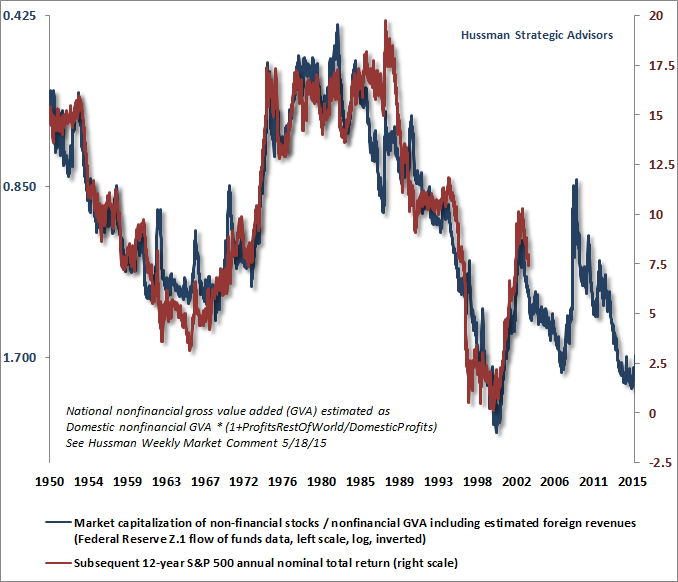
With the S&P 500 within about 8% of its highest level in history, with historically reliable valuation measures at obscene levels, implying near-zero 10-12 year S&P 500 nominal total returns; with an extended period of extreme overvalued, overbought, overbullish conditions replaced by deterioration in market internals that signal a clear shift toward risk-aversion among investors; with credit spreads on low-grade debt blowing out to multi-year highs; and with leading economic measures deteriorating rapidly, we continue to classify market conditions within the most hostile return/risk profile we identify – a classification that has been observed in only about 9% of history.
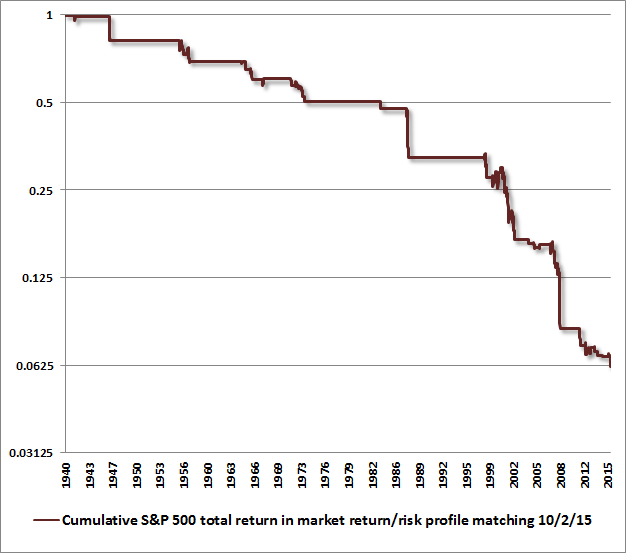
The primary feature driving our current market return/risk classification is that market internals and credit spreads have clearly deteriorated, following an extended period of extremely overvalued, overbought, overbullish conditions. Essentially, this is equivalent to saying that investors have shifted toward risk aversion in an environment where valuations are rich and risk premiums are extremely thin.While the market has experienced both short-term gains and losses under similar conditions, the most dominant outcomes are abrupt air-pockets, panics and crashes, with annualized losses in the S&P 500 under this 9% of history averaging about -33% at an annual rate. As shown below, this small subset of historical conditions captures a cumulative market loss of about 94%. The corollary is that the remaining 91% of market conditions capture roughly 16 times the overall total return of the passive index since 1940.
If market internals and credit spreads improve materially, the return/risk classification we identify will also change. Such an improvement would reduce the immediacy of our downside concerns, regardless of the level of overvaluation, and regardless of other economic data. While valuations drive long-term returns, the primary driver of market returns over shorter portions of the market cycle is the attitude of investors toward risk, as indicated by the uniformity or divergence of market internals. Those risk preferences determine when Fed easing tends to be favorable for stocks and when Fed easing provides no support for a collapsing market (see When An Easy Fed Doesn’t Help Stocks). Those investor risk preferences also determine when extreme overvaluation tends to be ignored by investors, and when it tends to produce vertical losses (See A Better Lesson Than “This Time is Different”). On that front, we’ll take our evidence as it comes.
Importantly, even fairly simple information from stock prices can have a profound impact on the recession probabilities implied by tepid economic data, as Bill Hester nicely points out in his latest research piece, When Market Trends Break, Even Borderline Data Is Recessionary (additional link at the end of this comment).
On Friday, the Bureau of Labor Statistics reported that non-farm payrolls for September grew by 142,000, versus a consensus that expected over 200,000 new jobs. At the same time, August job growth was revised lower from 173,000 to 136,000 jobs. All of this is very much in line with the deterioration that we’ve observed for months in leading measures of economic activity.
Keep in mind that labor is the most lagging of economic indicators. As I observed in February (see Market Action Suggests Abrupt Slowing in Global Economic Growth):
“The combination of widening credit spreads, deteriorating market internals, plunging commodity prices, and collapsing yields on Treasury debt continues to be most consistent with an abrupt slowing in global economic activity. Generally speaking, joint market action like this provides the earliest signal of potential economic strains, followed by the new orders and production components of regional purchasing managers indices and Fed surveys, followed by real sales, followed by real production, followed by real income, followed by new claims for unemployment, and confirmed much later by payroll employment.”
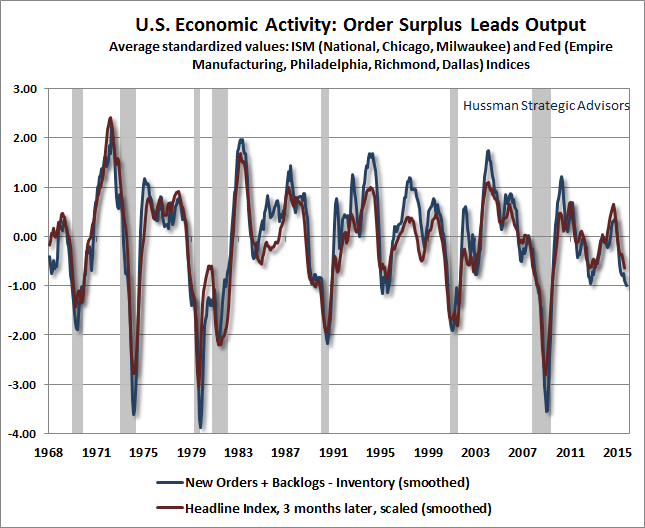
In our view, the recent deterioration in employment measures is likely to accelerate in the months ahead. The following chart presents our standard review of economic activity, drawn from a broad range of regional Federal Reserve and purchasing manager’s surveys. Recent levels have dropped to about the same level we saw at the beginning of the 2007-2009 recession. However, they haven’t significantly broken the lows we observed in 2012, so we should be careful not to draw too strong an inference from this data alone.
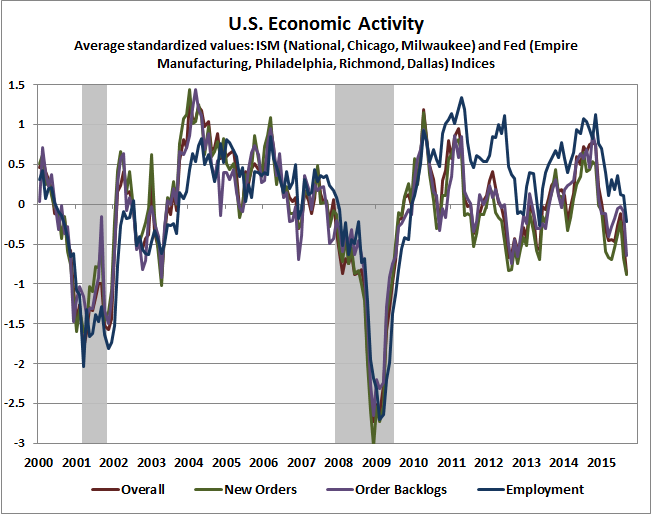
In terms of likely direction in the coming months, we can exploit the leading information available by looking at the production pipeline. What causes a business to increase its activity? Essentially new orders and order backlogs that can’t be filled out of existing inventory. As a result, we find that the “order surplus” signal we derive from regional economic surveys (new orders + order backlogs – inventories) typically leads the headline indices by about three months. That order surplus signal is still deteriorating.
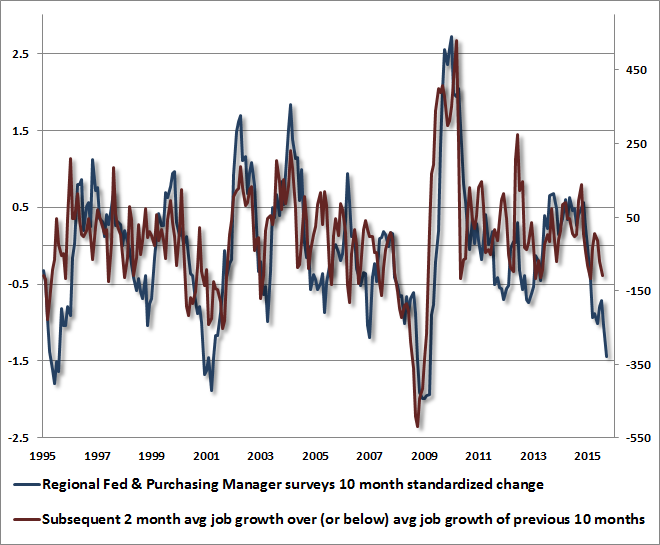
We know that employment measures lag other economic measures quite a bit in absolute terms, but we also know that the momentum of job growth typically follows with a shorter lag. What we find here is that the 10-month change in our economic activity composite is significantly, though imperfectly, related to employment growth over the following two months, above or below the average level of job growth over the preceding 10 months. Specifically, over the past 10 months, non-farm payrolls have grown an average of about 211,000 jobs per month. Given the deterioration we’ve seen in broad regional surveys, we should not be surprised if average job growth falls short of that average by between 150,000 and 300,000 jobs per month. That is, the data is now consistent with the potential for zero or negative job growth over the coming months.
In longer term data since 1950 (with varying availability of the component data series), deterioration of the current magnitude has always been associated with a shortfall of at least 150,000 jobs from the prior 10-month average, but has not always been associated with recession. So again, on the recession question, we can’t draw too strong an inference from this data alone.
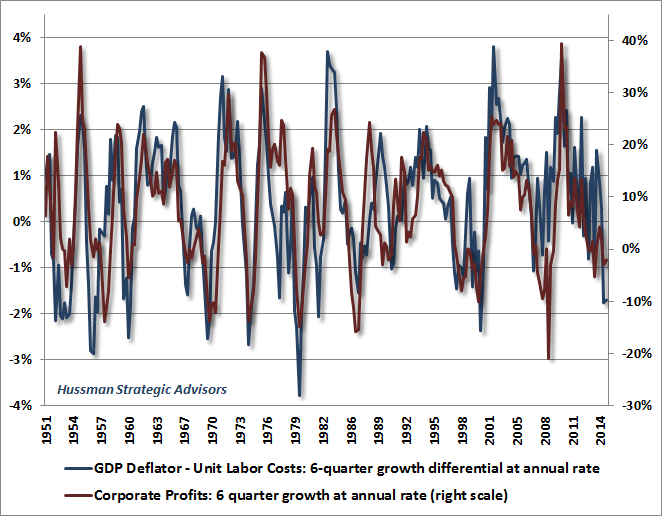
On the profits front, we’ve developed a number of approaches over the years to understand what drives cyclical fluctuations in profit margins (see for example Recognizing the Valuation Bubble in Equities and The Coming Retreat in Corporate Earnings). One of these is to examine the difference between the growth of output prices and the labor cost required to produce each unit of output. Despite some recent slowing, unit labor costs have grown at a significantly greater rate, in recent quarters, than output prices as measured by the GDP deflator. As shown below, we’ve observed downward pressure on corporate profits in recent quarters as a result.
Combined with pressures we observe on profit margins, my impression is that investors may be surprised at the number of companies that attempt to offset earnings disappointments in the coming weeks by pairing those reports with cost-cutting, in the form of layoff announcements.
A Growing Risk of Recession
On the prospect of recession, I’m reasonably well-known as one of the only economists who correctly warned in real-time of oncoming recessions in October 2000 and again in November 2007 – both points where the consensus of economic forecasters indicated no expectation of oncoming trouble at all. Like Lakshman Achuthan of ECRI – the only other economist we know of who identified both recessions in a timely way – I also incorrectlyanticipated a recession in 2011-2012, which did not emerge in that instance. The signal from our Recession Warning Composite at that time was triggered by a shortfall in employment growth (alternate condition 4 below) that was subsequently revised away, so the last signal on this composite in the revised data appears during the global financial crisis. As for other conditions, the ISM Purchasing Managers Index was above 50 between August-December 2011, which is the only part of that span when the S&P 500 was below its level of 6-months earlier. Needless to say, we consider a great deal of additional economic evidence, but our reliance on subsequently revised payroll data, and the need to place stronger emphasis on market internals (which we imposed on our methods in mid-2014) was our Achilles’ heel in that instance.
Still, over a longer span, our simple Recession Warning Composite has proved to be an invaluable rule of thumb. As of last week, the one condition in our Recession Warning Composite that has not dropped into place is the ISM Purchasing Managers Index, which came in at 50.2 for September, but not below 50. I should note, however, that on the basis of a much broader set of regional and national Fed and purchasing managers surveys, the 50.2 number was a large outlier – a figure closer to 48 was implied by that other data. If stock market internals were favorable here, we would quickly dismiss the prospect of an oncoming recession, for the same reason we would defer our concerns about potentially vertical market losses (see A Most Important Distinction). Favorable market internals would also provide a much greater benefit of the doubt that Fed easing might encourage both fresh speculation and a short-term boost to economic activity. But as we’ve detailed – particularly since mid-2014 – all of those prospects actually hinge on whether individuals in the economy are risk-seeking or risk-averse, and poor market action presently signals risk-aversion. In that environment, Murphy’s Law tends to hold: whatever can go wrong probably will go wrong.
The following segment, from my November 12, 2007 comment Expecting A Recession, details the basic syndromeof conditions (none of which is particularly informative in and of itself) that comprise our Recession Warning Composite, which is strongly associated with U.S. economic downturns:
1: Widening credit spreads: An increase over the past 6 months in either the spread between commercial paper and 3-month Treasury yields, or between the Dow Corporate Bond Index yield and 10-year Treasury yields.
2: Moderate or flat yield curve: 10-year Treasury yield no more than 2.5% above 3-month Treasury yields (this doesn’t create a strong risk of recession in and of itself).
3: Falling stock prices: S&P 500 below its level of 6 months earlier. Again, this is not terribly unusual by itself, which is why people say that market declines have called 11 of the past 6 recessions, but falling stock prices are very important as part of the broader syndrome.
4: Weak ISM Purchasing Managers Index: PMI below 50.
We can further improve the accuracy and immediacy of the recession signal by allowing any PMI in the low 50’s, and requiring moderating employment as additional confirmation:
4 (alternate): Moderating ISM and employment growth: PMI below 54, coupled with either total nonfarm employment growth below 1.3% over the preceding year (this is a figure that Marty Zweig noted in a Barron’s piece years ago), or an unemployment rate up 0.4% or more from its 12-month low.
[Note – Applying this alternate criteria also relaxes the yield curve criterion (2) so that any difference of less than 3.1% between the 10-year Treasury yield and the 3-month Treasury bill yield is actually sufficient to complete the syndrome].
For quick accessibility, here’s a review of useful confirming indicators of oncoming recession, aside from the indicators noted above. These will be important to monitor in the months ahead, but some have significant reporting lags, so are more useful for confirmation than for advance warning.
A sudden widening in the “consumer confidence spread,” with the “future expectations” index falling more sharply than the “present situation” index (currently in place). In general, a drop in consumer confidence by more than 20 points below its 12-month average has accompanied the beginning of recessions;
Low or negative real interest rates, measured by the difference between the 3-month Treasury bill yield and the year-over-year rate of CPI inflation. Real short term rates have now declined to negative levels on this basis;
Falling factory capacity utilization from above 80% to below 80% has generally accompanied the beginning of recessions;
Slowing growth in employment and hours worked. The unemployment rate itself rarely turns sharply higher until well into recessions (and rarely turns down until well into economic recoveries). So while the unemployment rate is an indicator of economic health, it is not useful to wait for major increases in unemployment as the primary indicator of oncoming economic changes. As for employment-related data, slowing growth in employment and hours worked tend to accompany the beginning of recessions.
With a clear breakdown in market internals, and leading economic measures deteriorating, we should be aware of the growing potential for a recession, but there is no need to take a strong view on this. Given that observable market conditions already hold us to a defensive outlook in stocks, there’s nothing we would do differently from an investment standpoint by “calling” a recession in any event.
While leading measures and our Recession Warning Composite do not currently provide enough evidence to anticipate an oncoming recession with confidence, they do suggest much greater prospects for economic weakness than the Wall Street consensus suggests. The disappointing job figures were met with initial market weakness on Friday, but enthusiasm later in the day on expectations that the Federal Reserve will be unable to raise interest rates from zero. I actually very much agree that the Fed has missed that opportunity. As I noted last month, the strongest reason to normalize monetary policy was to reduce speculative risks, but the proper time to have done that was years ago. At this point, obscene equity valuations are already baked in the cake on valuation measures that are reliably correlated with actual subsequent stock market returns.
That said, I strongly disagree that investors should view weaker economic prospects as a good thing. Recall that the Federal Reserve eased through the entire duration of the 2000-2002 and 2007-2009 market plunges. In an environment of risk aversion (which we currently infer on the basis of clear breakdowns in market internals) and credit spreads blowing out to multi-year highs, Fed easing has typically done nothing to support stock prices (see When An Easy Fed Doesn’t Help Stocks).
While Wall Street speculators are increasingly calling for QE4, they should be careful what they wish for now that market internals are unfavorable. The initiation of QE4 would be likely only in the face of even deeper economic weakness. An about-face by the Fed driven by economic weakness would more likely – after a brief celebration – contribute to panic that the Fed had lost credibility and control. We believe the Fed already has neither.
That point is nothing new. As I detailed in August 2007, just before the global financial crisis and a 55% collapse in the S&P 500 (see Knowing What Ain’t True):
“On the subject of what investors know that ain’t true, it’s not clear that investors should really be cheering for an environment in which the Fed would be prompted to cut rates because of recession risk. Recall that the ’98 cuts were largely due to illiquidity problems from the LTCM crisis, not because of more general economic risks. In contrast, the FOMC successively cut the Fed Funds rate in attempts to avoid recession in 2000-2002 and 1981-1982. Those cuts certainly didn’t prevent deep market losses. Speculators hoping for a ‘Bernanke put’ to save their assets are likely to discover – too late – that the strike price is way out of the money.”
New from Bill Hester: When Market Trends Break, Even Borderline Data Is Recessionary
The foregoing comments represent the general investment analysis and economic views of the Advisor, and are provided solely for the purpose of information, instruction and discourse. Please see periodic remarks on the Fund Notes and Commentary page for discussion relating specifically to the Hussman Funds and the investment positions of the Funds.

 Recession Watch
Earnings Recession
Is GDP Flatlining?
High-Yield – Rising Defaults
Reverse Deleveraging
Who Are These Reckless Borrowers?
Working Out of Debt
San Francisco, Portland, New York
“Growth is never by mere chance; it is the result of forces working together.”
– J.C. Penney
“Strength and growth come only through continuous effort and struggle.”
– Napoleon Hill
“We’re lost, but we’re making good time.”
– Yogi Berra, 1925-2015, RIP (For a most moving and memory-laden tribute to Yogi, see The Lefsetz Letter.)
The Yogi Berra quote above, which was brought to my attention this week, seems an apt description of where the markets and the economy are today. Nobody is quite sure where we are or where we’re going, but we all seem to think we’re going to get there soon.
I think it’s pretty much a given that we’re in for a cyclical bear market in the coming quarters. The question is, will it be 1998 or
2001/2007? Will the recovery look V-shaped, or will it drag out? Remember, there is always a recovery. But at the same time, there is always a recession out in front of us; and that fact of life is what makes for long and difficult recoveries, not to mention very deep bear markets.
The problem is that our most reliable indicator for a recession is no longer available to us. The Federal Reserve did a study, which has been replicated. They looked at 26 indicators with regard to their reliability in predicting a recession. There was only one that was accurate all the time, and that was an inverted yield curve of a particular length and depth. Interestingly, it worked almost a year in advance. The inverted yield curve indicator worked very well the last two recessions; but now, with the Federal Reserve holding interest rates at the zero bound, it is simply impossible to get a negative yield curve.
Understand, an inverted yield curve does not cause a recession. It is simply an indicator that an economy is under stress.
So now we are in an environment where we can look only at “predictive” indicators that are not 100% reliable. Actually, most are not even close. Some indicators have predicted seven out of the last four recessions. Some never trigger at all.
All that said, looking at data from the last few weeks suggests that we need to be on “recession watch.” Global GDP is clearly slowing down, and the data we are getting from the US suggests that we are going to see a serious falloff in GDP over the next few quarters. I want to look at the recent (very disappointing) employment numbers, earnings forecasts (and some funny accounting), credit spreads, total leverage in the system, and the overall environment where credit, which has been the fuel for growth, is under pressure. The totality of this data says that we have to be on alert for a recession, because a recession will mean a full-blown bear market (down at least 40%), rising unemployment, and (sadly) QE4.
The jobs report on Friday was just ugly. Private payrolls increased by just 118,000, which is about the minimum level needed for unemployment not to rise. Government payrolls added 24,000. There were serious downward revisions to the last two months, as well. August was taken down by 37,000 jobs, and July was reduced by 22,000. The last three months have averaged just 167,000 new jobs compared to 231,000 for the previous three months and 260,000 for the six months prior to that.
My friend David Rosenberg dug a little deeper into the numbers and noted:
Adding insult to injury and revealing an even softer underbelly to this report was the contraction in the workweek to 34.5 hours from 34.6 hours in August, which is effectively equivalent to an added 348,000 job losses.
So take the headline number, tack on the downward revisions and the loss of labour input from the decline in the workweek, and the “real” payroll number was [a minus] 265,000. You read that right.
He added: “Have no doubt that if the contours of the job market continue on this recent surprising downward path… [m]arket chatter of QE four by March 2016 is going to be making the rounds.”
While the unemployment rate remained at 5.1%, it did so largely because of a significant drop in the labor participation rate, which is not a good way to enhance employment. Further, the U-6 unemployment number is still a rather depressing 10%. Those are the people who are working part-time but would like full-time jobs, as well as discouraged and marginally attached workers. Very few part-time jobs pay enough to finance a middle-class lifestyle.
Leo Kolivakis of Pension Pulse has a downbeat earnings season preview, aptly titled “A Looming Catastrophe Ahead?”
Analysts have been steadily cutting 3Q earnings projections, and those revisions threaten to make some richly priced stocks even more so. Thomson Reuters data shows analysts expect a 3.9% year-over-year decline in S&P 500 earnings. Expectations are falling for future quarters as well.
These expectations have some strategists talking about an “earnings recession.” Just as an economic recession is two consecutive quarters of falling GDP, an earnings recession is two consecutive quarters of falling corporate profits.
The headwinds are no mystery. China’s weaker import demand is hurting all kinds of companies, especially raw materials and infrastructure suppliers. Caterpillar (CAT) slashed its revenue forecast and announced 10,000 job cuts. That probably isn’t playing well in Peoria. Accompanying the falloff in Chinese demand is an increase in the number of containers coming into the US as the strong dollar allows us to buy more and sell less. Not a particularly useful combination.
I love this quote from a Reuters story:
“How can we drive the market higher when all of these signals aren’t showing a lot of prosperity?” said Daniel Morgan, senior portfolio manager at Synovus Trust Company in Atlanta, Georgia, who cited earnings growth as one of the drivers of the market.
As we all know, it is every portfolio manager’s job to “drive the market higher.” Daniel evidently wants to do his part.
Sadly, despite our best efforts, the stock market faces an uphill climb. More from Reuters:
Even with the recent selloff, stocks are still expensive by some gauges. The S&P 500 Index is selling at roughly 16 times its expected earnings for the next 12 months, lower than this year’s peak of 17.8 but higher than the historic mean of about 15. The index would have to drop to about 1,800 to bring valuations back to the long-term range. The S&P 500 closed at 1,931.34 on Friday [Sept 25].
Moreover, forward and trailing price-to-earnings ratios for the S&P 500 are converging, another sign of collapsing growth expectations. The trailing P/E stands at about 16.5, Thomson Reuters data shows. Last year at this time, the forward P/E was also 16 but the trailing was 17.6.
The last period of convergence was in 2009 when earnings were declining following the financial crisis.
The Energy sector is the biggest drag on earnings, meaning that we now see analysts everywhere calculating estimates “ex-energy.” I suppose this produces useful information, but if we are going to exclude the bottom outlier, shouldn’t we exclude the top outlier as well? Healthcare is carrying much of the earnings burden for S&P 500 stocks, but I have yet to see an ex-healthcare or ex-energy & healthcare estimate.
A funny thing about earnings: they’ve been going up for the past year, even as top-line revenue has not. Generally, those go hand-in-hand. What’s happening?
And for the answer I have a story. A few years ago I made an assumption as to how a new stream of income would be taxed. I made that assumption based on my knowledge of having had similar income in the ’80s and ’90s. It turned out the rules had changed, and I hit the end of the year owing what was for me a rather large sum, as I was also trying to finance and build my new apartment.
I told my tale of woe to my accountant, Darrell Cain, who obviously detected the distress in my voice. He smiled at me and said, “John, I have an elephant bullet.” He reached under the table and pulled out an imaginary elephant bullet. “This is a big bullet. But I only have one of them. Once you use this bullet you can never use it again. If another elephant comes down the road, there will be nothing you can do.”
And yes, there were some one-time tax maneuvers that reduced my taxes to a manageable number. But as he said, those were a one-time option.
There is no way to prove it, but I think corporate accountants have been using up their elephant bullets this past year, as corporations want to be able to maintain the fiction that earnings are rising, so that price-to-earnings ratios don’t come under stress and cause stock prices to fall. You can move expenses from quarter to quarter, put off certain spending, recharacterize certain expenses one time, and so on. I deeply suspect we are going to find that some recent corporate earnings have been of the smoke and mirrors type.
Further, as I’ve written in previous letters, earnings forecasts are notoriously trend-following and typically miss the turns. If earnings are beginning to fall – and it appears they are – it is highly likely that earnings estimates will miss to the downside. If we slide into a recession at the same time, they will miss to the downside rather dramatically.
The Commerce Department will release its first estimate for 3Q US GDP on Thursday, Oct. 29. By then we will be in the thick of earnings season and will already know how many companies performed.
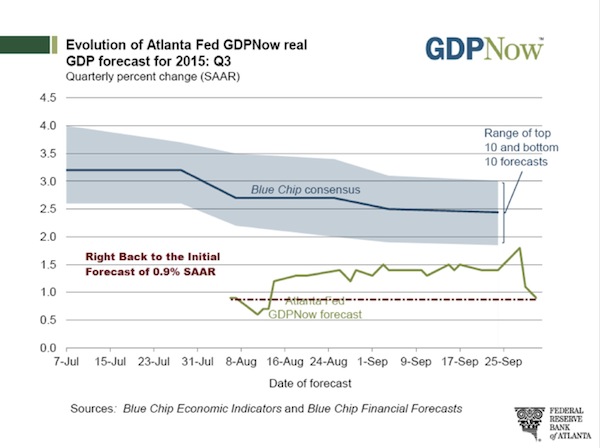
In the big picture, income (corporate or individual) can’t grow unless the economy grows. GDP may be a flawed way to measure economic growth, but it is the best tool we have. Blue-chip estimates right now are that it ran at near a 2.5% annualized growth rate last quarter. However, the Atlanta Fed has sharply revised their GDP estimate for the third quarter down to under 1%. (See chart below.)
Will economic growth come into harmony with income growth? We know they have to meet eventually. At present, it appears GDP will stay in slow-growth mode. That means it probably won’t be able to pull earnings up with it.
High-Yield – Rising Defaults
High-yield spreads have been tightening and interest rates have been rising for some time. This is starting to cause some distress in the high-yield (otherwise known as junk bond) market. My friend Steve Blumenthal has been following and timing the high-yield market for 20 years. He recently wrote the following, which I’m going to blatantly cut and paste as it clearly depicts the level of distress in the high-yield market. If credit becomes more difficult to get, then growth is going to come under stress as well. I note that corporations that I think of as issuing higher-quality debt are paying 10%. Thank you very much. Ten percent interest rates don’t seem to me to be very low.
Don’t take a lot of time to try and absorb the details of the following. What I want you to come away with is an impression of the distress that high-yield markets are facing. Quoting from Steve’s “On My Radar” blog:
Edward Altman, the New York University professor who developed the Z-Score method for predicting bankruptcies, says “Defaults will breach the historical high next year and the Fed is the ‘wild card’ that has the power to determine how quickly the current credit cycle ends.” (Bloomberg)
“We have blamed the wider Junk Bond spreads on Energy issuers, but last week there was a buyer’s strike. If this continues, you can say goodbye to easy financing for M&A, which will remove one large pillar of support from stock prices.” (361 Capital)
- Altice on Friday sold $4.8 billion of junk bonds to fund its $10 billion purchase of Cablevision Systems Corp., according to S&P Capital IQ LCD. When the deal was shopped earlier this month, Altice expected to sell $6.3 billion of debt, investors said. A 10-year bond was priced to yield 10.875%, compared with yields as low as 9.75% that were suggested by bankers initially, according to S&P Capital IQ.
- Olin on Friday sold $1.2 billion of bonds to pay for its pending acquisition of Dow Chemical Co.’s chlorine-products unit. Earlier in the month, Olin was expected to sell $1.5 billion of bonds, fund managers and analysts said. The annual interest rate on Olin’s 10-year bonds sold Friday was 10%, up from 7% expected earlier in the month, according to S&P Capital IQ.
- Companies have announced $3.2 trillion of M&A this year, according to Dealogic, emboldened to merge by cheap debt and the long stock rally that began after the financial crisis.
- That puts 2015 on pace to rival 2007 as the biggest year ever for takeovers. Issuance of junk bonds backing M&A deals hit a year-to-date record of $77 billion through Friday, according to data from Dealogic.
- A souring of investors on junk bonds could limit the availability of financing for deals that require a lot of borrowing. Banks have been under pressure from federal regulators to reduce their loans to such companies, and a pinch in the bond market could leave those deals struggling for financing. (WSJ)
- After investors snapped up more than $37.5 billion of bonds issued by junk-rated energy companies in the first six months of 2015, just $5.9 billion has been raised since then, according to data compiled by Bloomberg. (Bloomberg)
- Junk-bond investors are bracing for a surge in corporate defaults that would exceed the most pessimistic forecast from credit raters as the Federal Reserve contemplates its first interest-rate increase since 2006.
- A measure of distress in the market is suggesting investors have priced in a default rate of 4.8 percent during the next 12 months, according to Martin Fridson, a money manager at Lehmann Livian Fridson Advisors LLC.
- That’s almost two percentage points higher than the pace being projected for June next year by Standard & Poor’s, the world’s biggest credit rater, as concern mounts that energy companies that loaded up on cheap debt are going to struggle to refinance.
- “Unless there is a miraculous turnaround in oil prices there is likely to be a lot of defaults,” Fridson said. “The rating agencies’ approach isn’t capturing the fact that a large part of the economy is far out of step with the overall picture of the mark.” (Bloomberg)
- On HY fair valuation from Martin Fridson this week: Now that the sector has sold off sharply, it’s finally at fair value, finds Fridson, chief investment officer at Lehmann Livian Fridson Advisors. He uses a model that includes current economic and market conditions to judge valuations. (Barrons)
- Note that fair value can move to significantly undervalued as happened in 1991, 2002, and 2008. Recessions are a bear (no pun intended).
- The S&P US High-Yield Corporate Bond Index posted a yield to maturity of 7.51% on Tuesday, up from a recent low of 6.21% in late February. Morningstar data shows that the iShares iBoxx $ High Yield Corporate Bond ETF (HYG) has lost 3.6% in the past six months.
Longtime readers know that one of my core beliefs is that massive debt levels have thrust us into a fundamentally imbalanced world. I believe our next great crisis, whenever it comes, will result from too much of the wrong kind of debt.
Given what happened in 2008, you might think we would have collectively learned our lessons about debt. We have not. Like an alcoholic who wants to cure his affliction with another shot of whiskey, we seemingly have concluded that the way out of a debt crisis is to create more debt.
Does that sound insane? It is insane, but it’s also true. This chart explains:
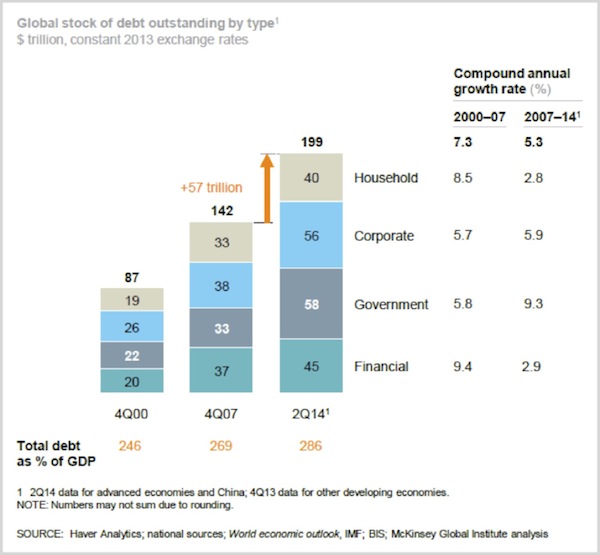
At the end of 2007 the global stock of outstanding debt stood at $142 trillion. Then in 2008 the financial world fell apart. Everyone moaned and groaned about irresponsible lending to irresponsible borrowers. Never again, we said. I actually wrote that I expected to see the world deleverage. Boy, what an optimist.
Less than seven years later, in mid-2014, we had added an additional $57 trillion in global debt, and the data this year is going to show that we’ve hit another record high. All the talk about deleveraging was only talk. We didn’t deleverage; we re-leveraged and then some.
The chart above is from a February 2015 McKinsey Global Institute study called “Debt and (not much) deleveraging.” McKinsey is not an organization given to hyperbole, nor was it necessary in this case. Reality is bad enough.
Does economic growth justify higher worldwide debt levels? Not unless you think the world’s economy grew at a 5.3% annualized rate from 2007–2014. Debt levels grew at that rate. GDP did not grow at that rate anywhere except (possibly) China, where debt growth was in the double digits. Debt as a percentage of GDP is even higher now than it was in 2007: 286% vs. 269%. Using 2007 as a baseline is misleading, too. We now know that debt levels that year were excessive by any measure. If we had too much debt then, we have way too much now.
What has enabled such a debt-fueled boom? Low interest rates. US corporations have spent about $1 trillion over the last 12 months on share repurchases and dividends in order to sustain their stock prices. Much of this money was borrowed. Rather than working for an old-fashioned profit increase, businesses resorted to financial engineering.
Who Are These Reckless Borrowers?
I said above that total debt grew at a 5.3% annual rate from 2007–14. Some types of borrowers added debt faster than others did, according to the McKinsey data.
- Household debt grew 2.8% annually.
- Financial sector debt grew 2.9% annually.
- Corporate debt grew 5.9% annually.
- Government debt grew 9.3% annually.
Banks and households missed their chance to deleverage – which means they will have trouble again in due course – but they at least kept their debt growth in roughly the same neighborhood as nominal GDP growth.
Incidentally, notice that the pattern reverses if we go back further to the 2000–2007 period. Then, household and financial-sector debt grew much faster than corporate or government debt did. That suggests the next crisis won’t look like 2008. However it breaks down, we are now in an even bigger debt bubble than we were in 2008. We are going to pay for it and eventually deleverage, but the process will look different this time. Which is why everyone is so focused on when the Federal Reserve will finally raise rates.
Working Out of Debt
Several years ago, when I was writing Endgame with Jonathan Tepper, I had a fascinating conversation with Kenneth Rogoff and Carmen Reinhart. They wrote the seminal book This Time Is Different, cataloging more than 250 financial crises in 66 countries over 800 years, looking for differences and similarities. You can read some it transcribed in chapter 5 of Endgame.
Among Reinhart and Rogoff’s findings is that it takes much longer to work off the excesses of a banking crisis than it does a typical business-cycle recession. The process can stretch out for years, with unemployment higher than normal and consumer demand sluggish the whole time. Sound familiar?
From Endgame (2011):
REINHART: [We] are still highly, highly leveraged as a nation. And the same can be said for most other advanced economies. So what I am getting at to your question, John, is that I think we are in for a period of subpar growth. And in a period of subpar growth… [y]ou are not going to have the same kind of investment environment that we had in the run-ups to the IT bubble and in the run-ups to the subprime crisis. I think it’s going to be a different, more sobering environment.
ROGOFF: Slow growth is here; that just comes with this debt no matter what way you turn…. Some countries won’t tighten their belts soon enough, won’t figure out how to do it…. But with the slow growth, whatever way you turn, you tighten your belt. Barring certainly a great, unbelievable period of technology growth or a friend from outer space helping us out, we do face slow growth, as Carmen said.
I am not aware of any friends from outer space coming to help us out. If they arrive, I only hope they are more helpful than our friends from Washington, DC.
The working-out process will not be easy. Reinhart and Rogoff said 4+ years ago that after a banking and credit crisis it is typical to have 10 years of slow growth. Elsewhere they talk about how economies in this situation often bump up against a kind of growth “ceiling.” That matches what we see in the US right now.
Are we near the end of the process? I doubt it. If recovery from a banking crisis can take ten years and we are only seven years in, I expect (barring aliens) that we have a few more years to go. A slow, muddle-through recovery may not be exciting – but it’s better than the alternatives. As I noted at the beginning, I am quite worried about the possibility of a recession in our slow-growth, barely limping along at stall speed economy.
A few final thoughts: If we are entering a period of 1% or less growth – or God forbid, a recession – the Fed has few bullets left in its monetary policy gun. Can you actually take the world’s reserve currency to negative rates? Seriously?
A few more months of falling employment growth and the Federal Reserve will be seriously constrained with regard to raising rates. Even though all the talk from the various Fed presidents and governors the last few weeks has been about the high probability of raising rates this year, I don’t think it will take much for the Fed to decide to hold off just another month or three to make sure…
The only real weapon that the Fed thinks they have is another round of QE, but their own research has showed that quantitative easing wasn’t effective this last time. I have no idea what they think it would do next time, but they will feel they have to “do something.” Just for the record, I was talking with my good friend, interest-rate and Federal Reserve expert (he was a former Fed economist) Dr. Lacy Hunt, about what QE might look like the next time. I mentioned providing actual cash to individuals, and he let me know clearly that the Federal Reserve is by law not able to do that. At least the way we interpret the law today. They are also constrained as to the types of assets they can purchase.
I suppose it’s possible that you could get Congress to agree to expand the range of assets the Fed can purchase, but that would require an amendment to the Federal Reserve Act, and no one in their right mind thinks that Congress will actually take that Act up for revision, as the debate would be so contentious as to be almost impossible to resolve.
By the way, if the Fed initiates another round of QE, you can bet that other central banks around the world will double down and match. Try to get your head around another few trillion in various fiat currencies floating around in reserve accounts.
Gold, anyone? Just saying… Right now there is little love for the barbarous yellow relic, but that could change. Stay tuned.
San Francisco, Portland, New York, and Birthdays
The editor of Transformational Technology Alert, my close friend Patrick Cox, will be coming in Sunday, October 11, for a dinner and to meet a few of his readers before we head out the next day to San Francisco, where we will hopefully meet with Dr. Mike West of Biotime and then spend the next day at the Buck Institute, the premier antiaging research center in the world. I hop a later flight to Portland, where I will be doing a speech for Aequitas Capital. Then the plan is that we’ll somehow wind up in New York.
Sunday is my 66th birthday. The kids will be gathering in the evening for what I suspect will be a rather quiet birthday dinner. They say that the older you get, the faster time flies, and that has surely been my experience. There is never enough time in the day or week to get everything done that I want to. Including workouts, which I’ve been lax on this week because of travel.
I’ll close with one of my favorite poems from Dylan Thomas. Its theme seems particularly poignant this week:
Do not go gentle into that good night,
Old age should burn and rave at close of day;
Rage, rage against the dying of the light.
Though wise men at their end know dark is right,
Because their words had forked no lightning they
Do not go gentle into that good night.
Good men, the last wave by, crying how bright
Their frail deeds might have danced in a green bay,
Rage, rage against the dying of the light.
Wild men who caught and sang the sun in flight,
And learn, too late, they grieved it on its way,
Do not go gentle into that good night.
Grave men, near death, who see with blinding sight
Blind eyes could blaze like meteors and be gay,
Rage, rage against the dying of the light.
And you, my father, there on the sad height,
Curse, bless, me now with your fierce tears, I pray.
Do not go gentle into that good night.
Rage, rage against the dying of the light.
You have a great week. Speaking of not going gently into that good night, I intend to see The Martian later tonight. It has been getting rave reviews, and I do enjoy a Ridley Scott movie.
Your not feeling as old as the number suggests analyst,

John Mauldin
subscribers@MauldinEconomics.com
Do you enjoy reading Thoughts From the Frontline each week? If you find it useful and valuable, your friends, family, and business associates will probably enjoy it too.
Now you can send Thoughts From the Frontline to anyone. It’s fast, it’s free, and we will never “spam” your friends and family with unwanted emails.
Copyright 2015 John Mauldin. All Rights Reserved.
Thoughts From the Frontline is a free weekly economic e-letter by best-selling author and renowned financial expert, John Mauldin. You can learn more and get your free subscription by visiting http://www.mauldineconomics.com.
Any full reproduction of Thoughts from the Frontline is prohibited without express written permission. If you would like to quote brief portions only, please reference www.MauldinEconomics.com, keep all links within the portion being used fully active and intact, and include a link to www.mauldineconomics.com/important-disclosures. You can contact affiliates@mauldineconomics.com for more information about our content use policy.
http://www.mauldineconomics.com/subscribe
Thoughts From the Frontline and MauldinEconomics.com is not an offering for any investment. It represents only the opinions of John Mauldin and those that he interviews. Any views expressed are provided for information purposes only and should not be construed in any way as an offer, an endorsement, or inducement to invest and is not in any way a testimony of, or associated with, Mauldin’s other firms. John Mauldin is the Chairman of Mauldin Economics, LLC. He also is the President of Millennium Wave Advisors, LLC (MWA) which is an investment advisory firm registered with multiple states, President and registered representative of Millennium Wave Securities, LLC, (MWS) member FINRA and SIPC, through which securities may be offered. MWS is also a Commodity Trading Advisor (CTA) registered with the CFTC, as well as an Introducing Broker (IB) and NFA Member. Millennium Wave Investments is a dba of MWA LLC and MWS LLC. This message may contain information that is confidential or privileged and is intended only for the individual or entity named above and does not constitute an offer for or advice about any alternative investment product. Such advice can only be made when accompanied by a prospectus or similar offering document. Past performance is not indicative of future performance. Please make sure to review important disclosures at the end of each article. Mauldin companies may have a marketing relationship with products and services mentioned in this letter for a fee.
Note: Joining the Mauldin Circle is not an offering for any investment. It represents only the opinions of John Mauldin and Millennium Wave Investments. It is intended solely for investors who have registered with Millennium Wave Investments and its partners at www.MauldinCircle.com or directly related websites. The Mauldin Circle may send out material that is provided on a confidential basis, and subscribers to the Mauldin Circle are not to send this letter to anyone other than their professional investment counselors. Investors should discuss any investment with their personal investment counsel. John Mauldin is the President of Millennium Wave Advisors, LLC (MWA), which is an investment advisory firm registered with multiple states. John Mauldin is a registered representative of Millennium Wave Securities, LLC, (MWS), an FINRA registered broker-dealer. MWS is also a Commodity Trading Advisor (CTA) registered with the CFTC, as well as an Introducing Broker (IB). Mil lennium Wave Investments is a dba of MWA LLC and MWS LLC. Millennium Wave Investments cooperates in the consulting on and marketing of private and non-private investment offerings with other independent firms such as Altegris Investments; Capital Management Group; Absolute Return Partners, LLP; Fynn Capital; Nicola Wealth Management; and Plexus Asset Management. Investment offerings recommended by Mauldin may pay a portion of their fees to these independent firms, who will share 1/3 of those fees with MWS and thus with Mauldin. Any views expressed herein are provided for information purposes only and should not be construed in any way as an offer, an endorsement, or inducement to invest with any CTA, fund, or program mentioned here or elsewhere. Before seeking any advisor’s services or making an investment in a fund, investors must read and examine thoroughly the respective disclosure document or offering memorandum. Since these firms and Mauldin receive fees from the funds they recommend/market, they only recommend/market products with which they have been able to negotiate fee arrangements.
PAST RESULTS ARE NOT INDICATIVE OF FUTURE RESULTS. THERE IS RISK OF LOSS AS WELL AS THE OPPORTUNITY FOR GAIN WHEN INVESTING IN MANAGED FUNDS. WHEN CONSIDERING ALTERNATIVE INVESTMENTS, INCLUDING HEDGE FUNDS, YOU SHOULD CONSIDER VARIOUS RISKS INCLUDING THE FACT THAT SOME PRODUCTS: OFTEN ENGAGE IN LEVERAGING AND OTHER SPECULATIVE INVESTMENT PRACTICES THAT MAY INCREASE THE RISK OF INVESTMENT LOSS, CAN BE ILLIQUID, ARE NOT REQUIRED TO PROVIDE PERIODIC PRICING OR VALUATION INFORMATION TO INVESTORS, MAY INVOLVE COMPLEX TAX STRUCTURES AND DELAYS IN DISTRIBUTING IMPORTANT TAX INFORMATION, ARE NOT SUBJECT TO THE SAME REGULATORY REQUIREMENTS AS MUTUAL FUNDS, OFTEN CHARGE HIGH FEES, AND IN MANY CASES THE UNDERLYING INVESTMENTS ARE NOT TRANSPARENT AND ARE KNOWN ONLY TO THE INVESTMENT MANAGER. Alternative investment performance can be volatile. An investor could lose all or a substantial amount of his or her investment. Often, alternative investment fund and account managers have t otal trading authority over their funds or accounts; the use of a single advisor applying generally similar trading programs could mean lack of diversification and, consequently, higher risk. There is often no secondary market for an investor’s interest in alternative investments, and none is expected to develop.
All material presented herein is believed to be reliable but we cannot attest to its accuracy. Opinions expressed in these reports may change without prior notice. John Mauldin and/or the staffs may or may not have investments in any funds cited above as well as economic interest. John Mauldin can be reached at 800-829-7273.


-
I know Mike is a very solid investor and respect his opinions very much. So if he says pay attention to this or that - I will.
~ Dale G.
-
I've started managing my own investments so view Michael's site as a one-stop shop from which to get information and perspectives.
~ Dave E.
-
Michael offers easy reading, honest, common sense information that anyone can use in a practical manner.
~ der_al.
-
A sane voice in a scrambled investment world.
~ Ed R.
Inside Edge Pro Contributors

Greg Weldon

Josef Schachter

Tyler Bollhorn

Ryan Irvine

Paul Beattie

Martin Straith

Patrick Ceresna

Mark Leibovit

James Thorne

Victor Adair