
Market Opinion
Quote of the Day
“Buy when everyone else is selling, and hold until everyone else is buying. This is not merely a catchy slogan. It is the very essence of successful investing.” – J. Paul Getty
The Dow made another rally high Thursday. To provide some perspective to the current Dow rally that began back in March, all major market rallies of the last 110 years are plotted on today’s chart.
Each dot represents a major stock market rally as measured by the Dow. As today’s chart illustrates, the Dow has begun a major rally 27 times over the past 110 years which equates to an average of one rally every four years. Also, most major rallies (73%) resulted in a gain of between 30% and 150% and lasted between 200 and 800 trading days — highlighted in today’s chart with a light blue shaded box. As it stands right now, the current Dow rally (hollow blue dot labeled you are here) has entered the low range of a “typical” rally and would currently be classified as both short in duration and below average in magnitude.
How do I get my free Chart of the Day?
Simply enter and submit your email address HERE (we won’t share it with anyone) and you will receive one free chart per week and instantly receive the latest free Chart of the Day.
Notes:
– Where’s the Dow headed? The answer may surprise you. Find out right now with the exclusive & Barron’s recommended charts of Chart of the Day Plus.
So far, the market is saying, “gold goes up.” – Richard Russell
From Bill Murphy – “What’s Love Got To Do With It,” was a great Tina Turner song many years ago. When it comes to gold, “What’s The Dollar Got To Do With It?” For the second day in a row, gold was bombed by The Gold Cartel while the dollar was lower.
With the dollar down .21 this morning, gold was taken down from $1136 to $1117. The move down was all about the US Government being petrified about the deteriorating real economy in the US and the drastic measures they are going to have to take to attempt to remedy the myriad problems they are facing. Over the years it has become apparent to the GATA camp, the worse the problems are, or the worse a specific economic report is, the more The Gold Cartel goes after the price. SHOOT THE MESSENGER! The action in the dollar is meaningless when the US Government orders the price down.
This morning’s AM Fix was a positive $1132.75. After a higher opening on Comex, The Gold Cartel began their attack, which went into high gear after the PM Fix of $1127.25 … PLAN B was the name of their game. Yet, in one of the strangest gold trading days I can ever recall, gold began to climb back, even as the dollar strengthened a bit. With silver leading the way up, gold managed to go positive, and then very late in the day it challenged its opening high of $1136.40 … only to sink in seconds back to $1130 when this news surfaced
13:03 10-yr note auction yields 3.75% with 49.95% allotted at the high
•Bid/cover 3.00 vs. avg of past 10 auctions 2.67
•Indirect participation 29% vs. avg of past 10 auctions 38.82%
•In reaction:
2-yr (2/32) to 0.86%
5-yr (6/32) to 2.45%
Dow 10669.96, 42.70 .
* * * * *
BUT, gold came back once again going into the close and actually made a small new high for the day.
Yes, it is the Battle of the Titans: the physical gold market against The Gold Cartel … with The Gold Cartel getting stuffed today and losing this battle.
Based on how gold traded the past two days with a weaker dollar, it is very clear The Gold Cartel wants the price down, especially during this Treasury auction period. But boy did they get their head handed to them today. Some big money wanted in on gold and they wanted in badly.
The tipoff gold had a shot to come back today was the stunning action in silver. Yes, it was belted early when gold was clocked, falling to $18.18. But, almost immediately, it began to relentlessly move higher, going positive even with gold under a good deal of pressure. Then silver began to make new high after new high, up as much as 23 cents with gold around unchanged.

Silver has now acted very well all year, even holding key support at $18, while gold plunged through its key support at $1140 yesterday and even $1120 at one point this morning. I asked Dave from Denver…
Hi Dave
What do you think is going on in silver? It is trading like a totally different market so far this year?
Do you think it could have anything to do with the CFTC?
B
Bill, that’s a really good question. You know I’m completely skeptical that the CFTC will do anything on the metals. How can they w/out causing major pain to JPM? I’ve been wondering for the past few weeks if maybe some of these big hedge funds have been putting on a short gold/long silver trade to exploit the high ratio. That could be part of it. Also, as the price of gold goes higher, the “poor man’s gold” aspect of silver will kick in and small buyers will buy silver over gold. I know my friend who is a local bullion coin trader told me yesterday that finding supply at the wholesale level and from individual sellers is hard right now. I also think the GATA doctrine that the physical market will overrun the paper market eventually is starting to have some influence.
On another note, JB has been referring to huge demand for gold in Japan. It hit me this morning that Japan’s Govt is in at least as much financial trouble as the U.S. is and now the new Prime Minister is calling for a weaker yen. There’s a lot of savings over there that can flow into gold and silver if the populace decides that it’s time to run from the yen.
***
Yes, it’s very difficult for me to believe the CFTC will do anything about JP Morgan. But perhaps the issue will surface in some way. Dracula can’t stand the light of day and neither can JP Morgan’s short silver position. If so, it could set off bells and whistles, which the CFTC might have to respond to.
Seems to me silver is GONZO if it can clear $18.75…
William J. Murphy III is the Chairman of the Gold Anti-Trust Action Committee and owner of www.LeMetropoleCafe.com. A graduate of the School of Hotel Administration at Cornell University in 1968, he went to become a starting wide receiver with the Boston Patriots of the American Football League. Mr. Murphy, who now resides in Dallas, Texas, spent much of his business career in the Futures Industry with such firms as Drexel Burnham and Shearson Hayden Stone. Today, he writes gold market commentary for his financial web site that features the precious metals and contrarian economic analysis.
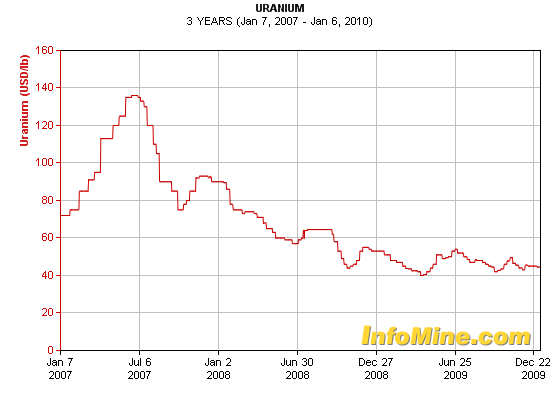
The spot price of uranium quadrupled from 2004 to 2007. When it hit $138/lb, uranium became a certified bubble, which has now burst. For investors, this is the best possible news, of course. Nuclear power is the ultimate alternative fuel, as the French will tell you. You get all the power, 84% cheaper than coal, with none of the politics of rogue nations and none of the greenhouse emissions – Mark Leibovit VRTrader Platinum newsletter of 01/07/10
Ux U3O8 Prices* (Uranium)
January 4, 2010 Posting
Spot: $44.50 UNCHANGED. Bull market high in the cash market was $138.00.
The February Uranium Futures closed at $44.50. The current bear market low is $42.00. June 13, 2007 hosted the bull market high of 154.95. Major support lies well under the market at $36.00.
Uranium – by Alan Knowles of Haywood Securities via TheEnergyReport.com
“China and Kazakhstan were the dominant demand growth (Est. 20 reactor units under construction) and production growth (Est. >35 Mlb U308 annual) forces for 2009, and we anticipate that the trend will continue in 2010. Shifting geopolitical sentiment, particularly across European countries (e.g., Germany, Italy, Belgium & Sweden) has continued to strengthen the commodity’s demand outlook, which will initially comprise the extension or replacement of reactor fleets beyond their earlier planned lifespans.
Globally, support for demand growth is being materialized via the expansion of ancillary industries, particularly heavy industries to accommodate for heightened reactor construction rates, and is an area that is demonstrating consistently greater vertical integration in the sector via continued participation from utilities.
We anticipate that uranium production for 2009 was 127.5 Mlb U308 (12.3% growth on 2008), and may grow by 3.9% to reach 132.4 Mlb U308 in 2010: growth is expected to stem largely from Kazakhstan, Namibia and Malawi. Beyond Kazakhstan, production growth is considered to have materialized from the African continent (Est. 22.5 Mlb), and nowhere else in 2009.
Variable technical, political and financial hurdles have led to several projects either being mothballed, or having their commissioning date postponed over the last several years. Very few projects have escaped these hurdles, which has led to most global production forecasts being progressively lowered over time. Despite these production delays from neo and existing producers, as well as episodic mishaps from the larger mines (e.g., Olympic Dam, BHP Billiton), the uranium price ended 2009 lower (Spot: $44.50 lb-1 U308, Long-Term Contract: $62.00 lb-1 U308).
We believe that much of the downward pressure on the spot price correlated to both the exchange of significant material from funds and other non-producing parties into the largely discretionary spot market (>50 Mlb U308 traded in 2009), and negative sentiment surrounding the uncertainty of the USA Department of Energy’s (DOE) surprise exchange from its uranium inventory for D&D of the Portsmouth Gaseous Diffusion Plant in Ohio.
For early 2010, we believe that the cloud of uncertainty surrounding the DOE’s action will still hang over the market in the short term, but we consider that given our expectations for low growth in uranium production, and continued growth in demand, mainly from non-OECD countries, as well as renewed discretionary budgets for utilities and continued inventory building from China that uranium prices are likely to recover. Given current commodity prices, and our view on the limited number of uranium producers and neo¬producers in 2010, we look towards companies with a demonstrable production growth profile, or with high-grade resources that are being developed and that have expansion potential.”
Ed Note: Go HERE to view an extensive list of Uranium Stocks at u3o8.biz
A few charts chosen at random in each category below. If you want specific Uranium Stock Trading guidance Mark Leibovit of the VRTrader makes recommendations in his VRTrader Platinum Newsletter which also covers Stock, TSE Stocks, Bonds, Gold, Base Metals, Uranium, Oil and the US Dollar – For a trial Subscription of The VR Platinum Newsletter covering Stocks, Bonds, Gold, US Dollar, Oil CLICK HERE
Uranium Companies in Production
Cameco

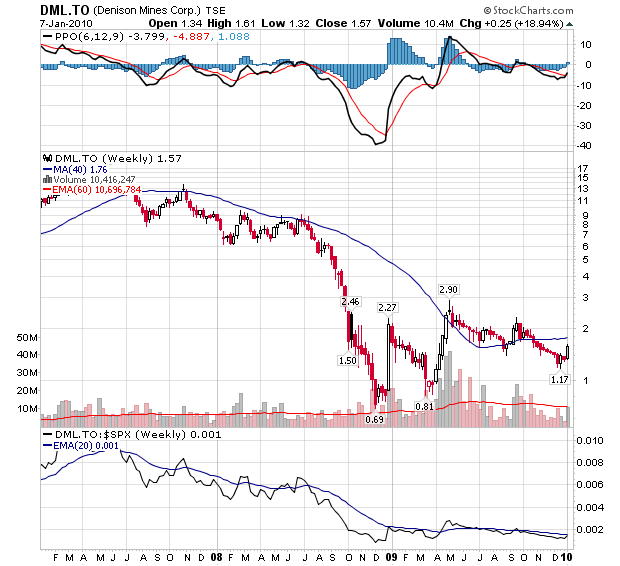
Denison
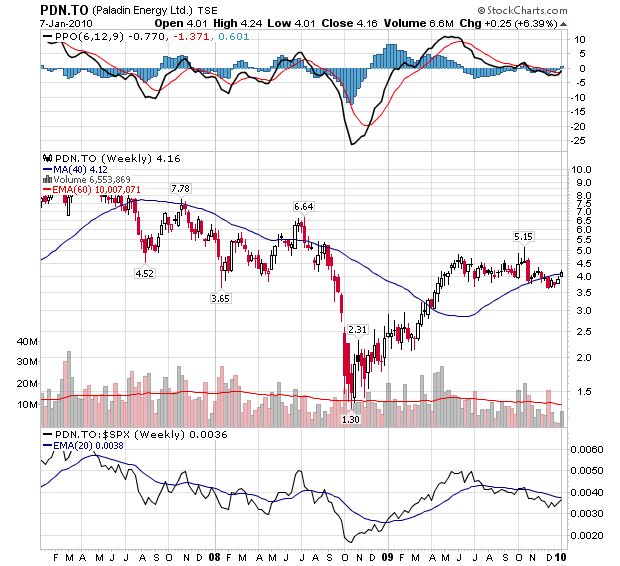
Production Visibility
Paladin Energy Ltd.
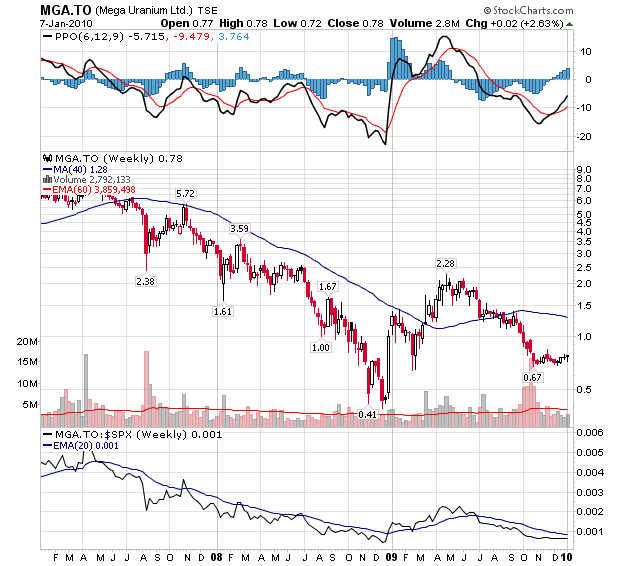
Advanced Exploration
Mega Uranium Ltd.
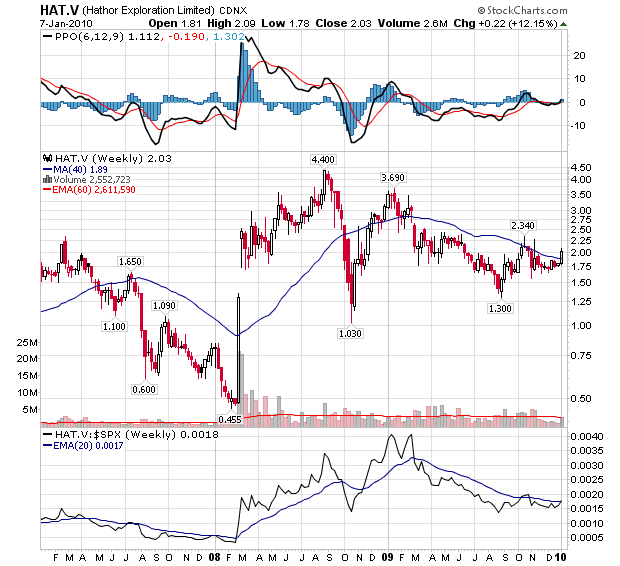
Junior Exploration
Hathor Exploration Ltd.
The ENERGY Report does not render general or specific investment advice and does not endorse or recommend the business, products, services or securities of any industry or company mentioned in this report.
From time to time, Streetwise Inc. and its directors, officers, employees or members of their families, as well as persons interviewed for articles on the site, may have a long or short position in securities mentioned and may make purchases and/or sales of those securities in the open market or otherwise.
Streetwise Inc. does not guarantee the accuracy or thoroughness of the information reported.
Streetwise Inc. receives a fee from companies that are listed on the home page in the In This Issue section. Their sponsor pages may be considered advertising for the purposes of 18 U.S.C. 1734.
Participating companies provide the logos used in The Energy Report. These logos are trademarks and are the property of the individual companies.
Streetwise Inc.
P.O. Box 1099
Kenwood, CA 95452
Tel.: (707) 282-5594
Fax: (707) 282-5592
Email: info@streetwisereports.com
Via Richard Russell: They call it “the poor man’s gold.” But don’t turn your nose up at silver. The dollar was originally defined in terms of silver. When precious metals are on the rise (as now), silver tends to be seen as a monetary metal. When times are bad, silver is seen as an industrial metal. Silver has a huge number of industrial uses, silver is the best conductor of electricity. Unlike gold, silver is actually used (and used up) in industry. Thus, a large amount of silver is lost every year. In contrast, 85% of all the gold ever mined in all history is still around; it’s in your teeth or in your sweeties’ bracelet or in that ancient Egyptian ring that you see in your local museum.
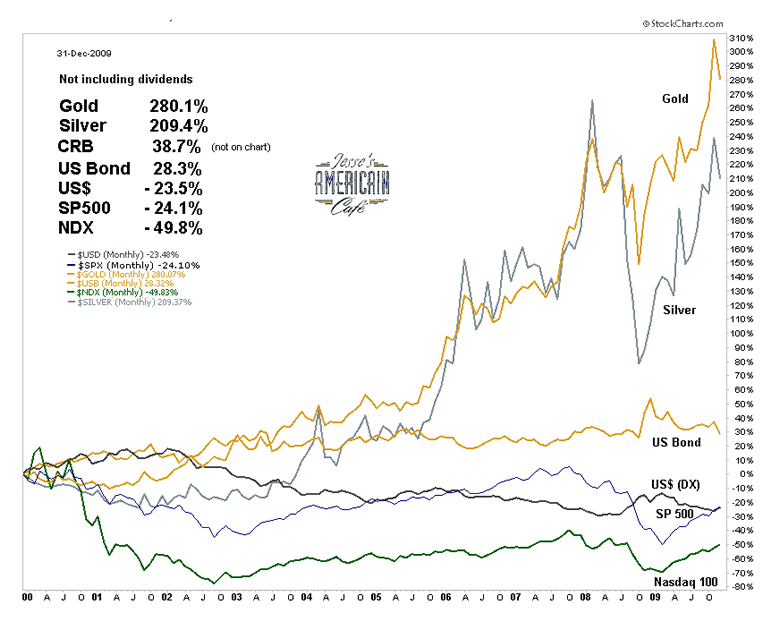
Historically, when silver gets going, it tends to make huge percentage moves. I think you can see that from the long-term chart below. For instance, back in November 2008, silver was selling for 8.65 an ounce. Today an ounce of silver is selling for 18.10 an ounce, more than double.
Silver is now in a erratic bull market. How high it may go I don’t know, but I would not be shocked to see silver ultimately climb above its 1980 price of $50 bucks an ounce. Historically, once ounce of gold will buy around 15 ounces of silver. Today an ounce of gold will buy 62 ounces of silver. Silver compared with gold is dirt-cheap today.
Yesterday, both gold and platinum closed at new highs for the move. Silver is lagging behind, but when silver finally catches up, it may be a stunner. Over the last year the price of silver doubled; gold didn’t perform that well.
To put it briefly, I like silver. Gold has one advantage over silver, every central bank owns some gold, and most want more.
Richard Russell has made his subscribers fortunes. One of the best values anywhere in the financial world at only a $300 subscription to get his DAILY report for a year. HERE to subscribe. Amongst his achievements Richard was in cash before the 2008/2009 Crash and he has been Bullish Gold since below $300
Ed Note: Richard Russell is still bullish Gold and holds one of the largest single positions he has held in his life in the precious metals.
Could a mere tulip bulb be worth $76,000? It is if people are willing to pay for it! It may sound preposterous, but this is exactly what happened in Holland in the 1630’s.
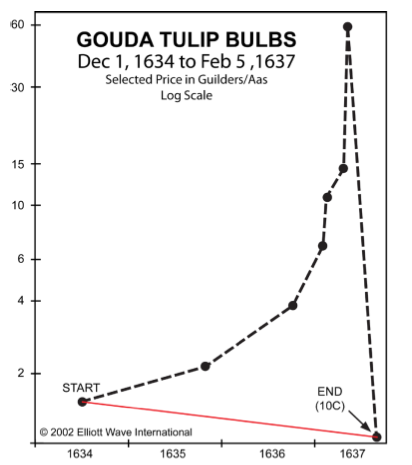
The amount the market declined from peak to bottom: This number is difficult to calculate, but, we can tell you that at the peak of the market, a person could trade a single tulip for an entire estate, and, at the bottom, one tulip was the price of a common onion.
Synopsis: In 1593 tulips were brought from Turkey and introduced to the Dutch. The novelty of the new flower made it widely sought after and therefore fairly pricey. After a time, the tulips contracted a non-fatal virus known as mosaic, which didn’t kill the tulip population but altered them causing “flames” of color to appear upon the petals. The color patterns came in a wide variety, increasing the rarity of an already unique flower. Thus, tulips, which were already selling at a premium, began to rise in price according to how their virus alterations were valued, or desired. Everyone began to deal in bulbs, essentially speculating on the tulip market, which was believed to have no limits.
The true bulb buyers (the garden centers of the past) began to fill up inventories for the growing season, depleting the supply further and increasing scarcity and demand. Soon, prices were rising so fast and high that people were trading their land, life savings, and anything else they could liquidate to get more tulip bulbs. Many Dutch persisted in believing they would sell their hoard to hapless and unenlightened foreigners, thereby reaping enormous profits. Somehow, the originally overpriced tulips enjoyed a twenty-fold increase in value – in one month!
Needless to say, the prices were not an accurate reflection of the value of a tulip bulb. As it happens in many speculative bubbles, some prudent people decided to sell and crystallize their profits. A domino effect of progressively lower and lower prices took place as everyone tried to sell while not many were buying. The price began to dive, causing people to panic and sell regardless of losses.
Dealers refused to honor contracts and people began to realize they traded their homes for a piece of greenery; panic and pandemonium were prevalent throughout the land. The government attempted to step in and halt the crash by offering to honor contracts at 10% of the face value, but then the market plunged even lower, making such restitution impossible. No one emerged unscathed from the crash. Even the people who had locked in their profit by getting out early suffered under the following depression.
The effects of the tulip craze left the Dutch very hesitant about speculative investments for quite some time. Investors now can know that it is better to stop and smell the flowers than to stake your future upon one.
A bubble is a type of investing phenomenon that demonstrates the frailty of some facets of human emotion. A bubble occurs when investors put so much demand on a stock that they drive the price beyond any accurate or rational reflection of its actual worth, which should be determined by the performance of the underlying company. Like the soap bubbles a child likes to blow, investing bubbles often appear as though they will rise forever, but since they are not formed from anything substantial, they eventually pop. And when they do, the money that was invested into them dissipates into the wind.
For more interesting Crashes click on the links below:
Market Crashes: What are Crashes and Bubbles?
4) Market Crashes: The South Sea Bubble
5) Market Crashes: The Florida Real Estate Craze
6) Market Crashes: The Great Depression (1929)
7) Market Crashes: The Crash of 1987
8) Market Crashes: The Asian Crisis
9) Market Crashes: The Dotcom Crash
10) Market Crashes: Conclusion
-
I know Mike is a very solid investor and respect his opinions very much. So if he says pay attention to this or that - I will.
~ Dale G.
-
I've started managing my own investments so view Michael's site as a one-stop shop from which to get information and perspectives.
~ Dave E.
-
Michael offers easy reading, honest, common sense information that anyone can use in a practical manner.
~ der_al.
-
A sane voice in a scrambled investment world.
~ Ed R.
Inside Edge Pro Contributors

Greg Weldon

Josef Schachter

Tyler Bollhorn

Ryan Irvine

Paul Beattie

Martin Straith

Patrick Ceresna

Mark Leibovit

James Thorne

Victor Adair