
Daily Updates
Ed Note: One of Michael Campbell’s favorites, Donald Coxe has 35 years of institutional investing and money management experience in the United States and Canada, and a unique background in North American and global capital markets. He also thinks Canada has the best banks, and the best range of commodity-oriented stocks. And it has the best North American currency.

Chart and Comment by Dennis Gartman of The Gartman Letter L.C.
“C$ VS. THE US$ FOR THE PAST TWENTY YEARS: The sea change came back in ’02‐’03 and the trend ever since has been in favour of the C$, with the world gaining respect for the fact that Canada has all of the things that the other countries of the world need to sustain economic growth including food, energy and water… AND that Canada tends never to abrogate contacts and does support free trade.”
Dem Blues – written by Donald Coxe – Coxe Advisors LLC
The stock market’s September Song is traditionally the blues. If this year’s music of the markets follows the customary dance card, it will be a sharp mood swing from the splendid revels and boleros of spring and summer.
Why should the blues be back? With the S&P up by a half since March, then the recession must be yesterday’s story, and the next bull market has begun. That’s what most of the major indicators—ISM, Leading Economic Indicators and their like—tell us.
Using Fed Chairman McChesney Martin’s hoary punch bowl analogy, the trebling of the Fed’s balance sheet and sustained near-zero interest rates have done their work: the equities party this time isn’t just “interesting”—as it was in previous cycles—butnearly Rabelaisian.
Except that it’s not just stocks that are rising: so are foreclosures, unemployment, bankruptcies, bank failures, and government deficits at all levels. The story of our time has become a Tale of Two Ditties: Roll Out the Barrel, and Brother, Can You Spare a Dime?
This month, we update major cautionary themes we have been discussing in recent issues, in the light of months of ebullient stock markets, an increasingly bullish economic consensus, and a potentially historic shift in voters’ views of the financial and economic implications of President Obama’s policies.
Each week, we read analyses from strategists and economists comparing this recession to its predecessors all the way back to the Depression, on the implicit assumption that we remain in an historic continuum. Yes, each downturn has some different characteristics than others, but the unstated axiom in the reasoning is that the US and other OECD economies today can be understood best by understanding how they have behaved at past turning points.
In our view, this recession is unlike any other since the onset of the Industrial
Revolution in two crucial respects:
• it is the first to hit North America and Europe in which deteriorating demography is a key ingredient—and none of the policymakers and almost none of the elite economic forecasters even mention it;
• it is the first in which the continued strength of the economies of China, and, to a lesser extent, India and East Asia, is widely recognized as the condition precedent to a global recovery, yet the consensus remains unwilling to draw the obvious conclusions from this historic transformation.
We believe that these unprecedented factors make forecasting the shape and strength of the US and European recoveries unusually difficult. Policymakers within the OECD nations are resorting to programs and remedies with roots in Keynesian and Friedmanesque formulas that either should have been used to prevent or end the Great Depression, or that have been employed in subsequent recessions with apparently successful results.
But what if the world is changing so decisively that massive deficits and Depression-era interest rates will not produce—on a sustainable basis—the anticipated good results for the US and other major OECD economies whose demographic decay is even more serious than America’s?
This month’s title is a riff on America’s unique music form. We use it to discuss (1) the implications of the continuing US demographic decay and (2) a possibly momentous shift in American confidence in the Democrats’ ambitious programs to reshape the economy after it escapes the recession.
President Obama’s approval ratings have fallen precipitously since our last issue, as have the ratings for the Democratic Congress. If, with the post- election glow gone, the recovery were to falter, it would be very difficult for the President and his party to rally public support for new stimulus or bailout legislation, and investors worldwide might begin to factor a failed Presidency into their appraisal of US financial assets. The image of a handsome, smart, creative, popular President who would blow away the Bush Blues was wondrous for Americans’ view of themselves and the world’s view of America. If that image were to crack in Dorian Gray fashion, it could be a real negative for US equities and America’s ability to finance its coming decade of deficits.
We believe most equity groups in the US are due for a correction that could be quite prolonged, but we remain bullish on Emerging Markets as an asset class, and on commodities and commodity stocks. Given that outlook, we think balanced portfolios should reduce endogenous risk. We are adjusting our Asset Mix to increase bond exposure—both in percentage and duration terms—and are reducing recommended levels of US and European Equities, and Cash.
INVESTMENT RECOMMENDATIONS
1. Upgrade equity portfolios to reduce endogenous risk. Trade upward in quality, and, in balanced accounts, increase bond exposure. There is, at present, too much froth for comfort. After the grandest recession /recovery stock market rally on record, this is hardly a good time to commit new money into equities.
2. Emphasize Canadian stocks in North American portfolios. Canada has the best banks, and the best range of commodity-oriented stocks. And it has the best North American currency.
3. Continue to overweight commodity-oriented companies in diversified equity portfolios. They have been underperforming the US market since US stocks began to reach the top of the troposphere, and their most volatile and gaseous members soared into the stratosphere. If the economic bulls are right, commodity prices will soar. If it takes more time—and some signs of restraint in Washington—to launch a sustained US recovery, then commodity stocks will have the attraction that comes from producing goods priced by the new Asian economic leaders.
4. The regional banks index (KRE) has not participated in the broad rally recently, and is sharply underperforming the S&P, mostly because of widespread construction loan losses. The BKX has more than doubled since March, but it is dominated by the banks that got the most help from Washington, so we have trouble seeing that steroid-based performance as the signal to buy stocks. Until the KRE starts to show good relative strength, the rally remains suspect, and investors should be lightening up on financial stocks.
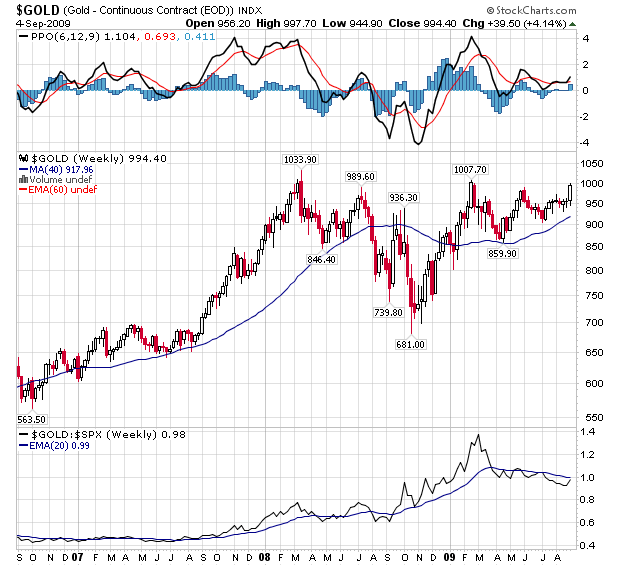
5. Until this week, gold had been range-bound this year, so gold shares sharply underperformed the market. On Tuesday, bullion staged a sudden upside breakout from its pennant pattern, which could signal a sustained move through $1,000. As we were going to press, it had moved through $990. Gold shares are attractive havens, because gold is the only asset that can be expected to outperform under both extreme scenarios— financial collapse and runaway inflation. Remain overweight gold within commodity-oriented portfolios.
6. Whether by coincidence or otherwise, crude oil has been trading rather closely to the S&P. Oil consumption statistics do not support a valuation of $70 for crude oil. We recommend caution on oil stocks here.
With 35 years of institutional investing and money management experience in the United States and Canada, Donald Coxe has a unique background in North American and global capital markets.
As Chairman, Coxe Advisors LLC, a newly incorporated investment advisory firm in Chicago, Don will continue to follow global capital markets, and to write and speak for investors.
The Coxe Commodity Strategy Fund (TSX: COX.UN) was launched in 2008. The Fund provides exposure to commodity-related securities in the raw material sector weightings Mr. Coxe has established.
In 2008, Mr. Coxe was the recipient of the National Post / StarMine lifetime achievement award for excellence in investment research. He has consistently been named as a top portfolio strategist by Brendan Wood International, and was ranked number one in the 2007 and 2008 surveys.
Until December 31, 2008, as Global Portfolio Strategist for BMO Capital Markets, he published a monthly institutional portfolio strategy journal, Basic Points, and conducted a widely-followed weekly institutional strategy conference call.
He was CEO of a major Canadian investment counseling firm, Research Director and Strategist for Canada’s leading institutional dealer, a strategist on Wall Street, and CEO and Chief Investment Officer for Harris Investment Management Inc., an investment management firm specializing in pension and mutual funds. At Harris, he was co-manager of the flagship Harris Insight Equity Fund. In 2005, Harris Investment Management was ranked No.1 overall as the best-performing mutual fund organization in the US.
A respected business writer, he is the author of The New Reality of Wall Street, published in 2003.
Prior to entering the investment business, Mr. Coxe served as Associate Editor of National Review magazine in New York, practiced law in Toronto, and served as General Manager for the Ontario Federation of Agriculture and General Counsel for the Canadian Federation of Agriculture.
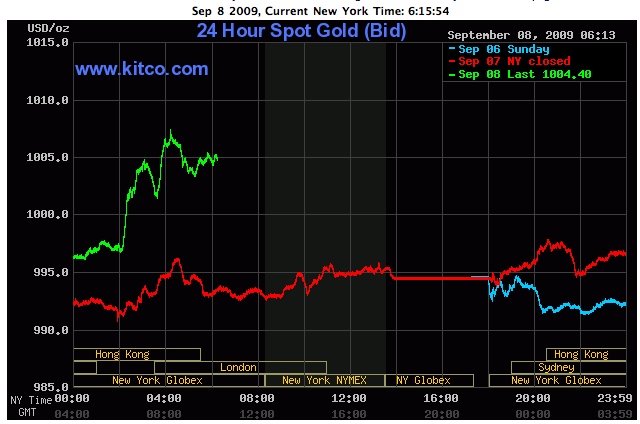
Ed Note: Spot Gold at $1,007.10 at 4:15am PST
Gold is clearly headed to 1000 an ounce now. Last week we saw a key breakout in both gold and gold stocks, with many gold stocks up over 15% in just the past two trading sessions. The HUI and XAU both closed at new highs for the year last week too. This is key, because normally the trend in gold stocks leads the metal – meaning when gold stocks outperform the metal and go up faster than the metal it is bullish for both.
For disclosure purposes I am long gold stocks. I started to buy them and recommend them to my premium subscribers on August 28th.
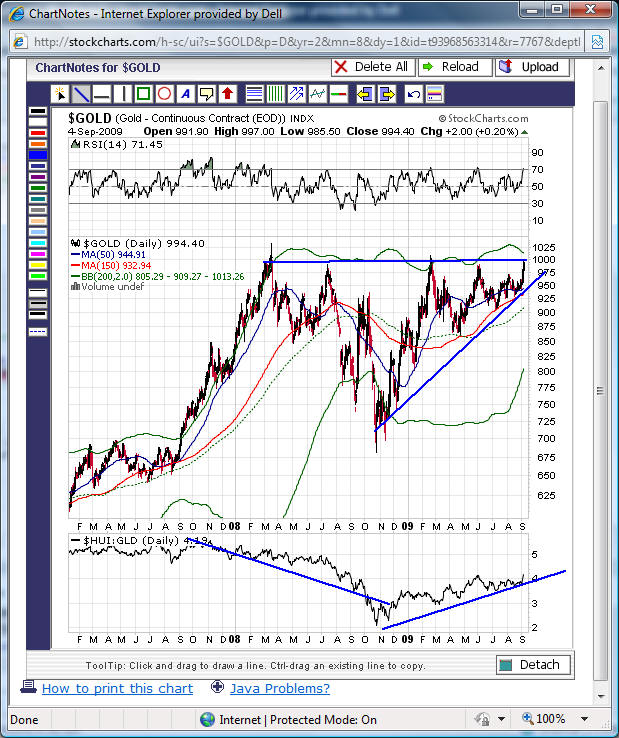
The 1000 mark has held gold prices down for almost two full years and causes gold to trade in a range of 700 to 1000. Of course that range has been narrowing for the past few months with 900 marking the low of this summer.
When a level such as 1000 acts as long-term resistance for this long it can lead to a new massive up leg once it is broken – a new secular move that can last for months and even sometimes years.
The last time it spent this long below a long-term resistance level was from the first quarter of 2006 to the end of 2007 when 700 acted as huge resistance. Once it finally clearly 700 for good gold rallied over 42%.
Before that the previous big bull run in gold happened in 2005 when gold rallied from 450 to about 750 for a 66% gain.
Once gold clears the 1000 mark and stays above it for a few days then in a few months it will be setup to rally into the 1300-1700 area – perhaps even more.
The move last week was so powerful with big volume that it pretty much appears inevitable that gold is going to take out the 1000 level. Don’t forget too that seasonally gold tends to have its best months from September to January.
To me last week is a really huge and important week for both gold and the stock market. Last month a lot of people came out of the woodwork to argue for a Fall stock market crash and a collapse in gold prices. The most prominent of these people were the Elliott Wavers who got some mention on CNBC for claiming that the stock market has to have peaked at this level, because they believe that the stock market peaks and bottoms at exact points that they claim to be able to predict with “wave counts” and “fibonacci sequeneces.”
When a market hits their targets then they assume it must reverse, because it “has to” in their mind in order for their theories to be valid.
They also believe in deflation, because they believe that commodities are going to fall to their predicted levels and that the dollar has put on a bottom. They predict oil going to $20 a barrel so therefore whenever oil or other commodities go up they think they are bear rallies in a bigger “wave structure” based on the number pi.
What I never understand though and always ask this of Elliott Wave believers and have never gotten an answer is this – why in the world would the stock market trade in some sort of exact mathematical fibonacci sequence? As I wrote the other week, “This is more a religion than science. The presuppositions that lay behind wave counts is they claim that all of nature is based on fibonacci numbers. If that were true then it would mean that all of human history – and the future- is predetermined by some math sequence. It would mean you have no free will, because your own behavior must match these numbers. Of course that is ludicrous. I know that the next time I eat, sleep, or go to the bathroom is not going to be predetermined by a fibonacci sequence so I put zero stock in those theories and many of the people espousing them.”
If this doesn’t sound convoluted to you than you understand these things better than I do.
If the Elliott Wave believers are right about all of this though then we should have seen gold and gold stocks break down last week. We should also have seen more selling happen in the broad market.
But neither of these things happened. The broad market firmed up and gold and gold stocks exploded to the upside.
I think last week was not just bullish for gold, but for the broad market too.
I’ve been saying this is a bull market since July and continue to think it is a bull market. What happened in July to make me bullish was the fact that most of the sectors that make up the stock market began bull markets of their own by ending months of consolidation and breaking out above their long-term 150 and 200-day moving averages while the advance/decline line began to rally ahead of the stock market averages – meaning that the average stock was actually going up faster than the S&P 500 stock index.
That was a sign that the rally had broadened from being fueled by short covering to broad based buying. That’s the the type of thing that starts near the beginning of a cyclical bull market.
To me this is a huge complete difference from what happened this time a year ago. A year ago the markets had just put on a bear market rally that lasted from March to May. The broad market averages then went sideways through the summer and rolled over in September as they headed into the Fall wipeout.
Gold and gold stocks had a false break upwards in August and then reversed and broke through their major support levels ahead of the rest of the market.
I remember this clearly, because I was in Las Vegas at a gold investment conference. I had been bearish on the broad stock market, actually being short at the time, but I thought gold had a chance to go higher in the Fall. But when it broke down I took that as a sign that some huge changes were happening in the stock market – ones for the bad.
Now we are in the complete opposite situation. Gold and gold stocks just broke to the upside while the stock market just had a short-term correction in a larger cyclical bull market. Instead of being worried about what the future holds for stocks as I was exactly a year from now, we can now look with hope at the potential returns ahead of us.
It isn’t always clear what is happening in the stock market, especially when the market is at key turning points. In the end you have to watch the market trends and adjust yourself accordingly when it becomes clear that they have changed even when it goes against your expectations and assumptions.
A year ago I was very bearish on the stock market – actually being short much of the time – and I thought the economy was going to be in big trouble. In the summer it became clear that serious banking problems were going to hit the market in the Fall. There were articles explaining why and when Fannie Mae were going to go broke before they did. You could studied this information months before they impacted the stock market and been able to position yourself accordingly. I know you could have, because I did.
I did that by going short the broad market averages and by buying gold stocks. I thought gold stocks would go up when these banks got in trouble, because the US government and Fed would bail them out by printing money. This indeed happened, but gold stocks went down with everything else as hedge funds and institutional investors had to sell everything off to meet redemptions in massive deleveraging.
I wasn’t expecting that in August 2008, but when gold broke down I got stopped out of my gold stock positions and realized that this is what was indeed happening. Now gold is acting contrary to some people’s expectations and they better react to that or they will be punished.
Gold provokes strong reactions in many people and one debate that has been going on for the past year is whether we are headed for deflation due to continued economic weakness and credit contraction or inflation due to the Fed’s money printing and government deficit spending.
In the last quarter of 2008 there were clear deflationary trends in producer and consumer prices following the huge drop in oil, commodities, and consumer demand as the US economy contracted over 6% in a single quarter.
But the deflation slowed down earlier this year and has slowly reversed, with inflation picking up as the GDP swung into positive territory in the last quarter. Economic growth should continue to be weak, but we should have seen the depth of overall weakness earlier this year.
Hardcore deflationists argue that this is just a blip in a much longer deflationary trend that is going to break out in full force this Fall in another stock market collapse. The Elliott Wavers believe in deflation, because they have all of these wild projections for super low commodity prices that haven’t come true yet.
The move in gold right now should force many of those that are stuck believing in deflation to revaluate their beliefs. Those that stuck to the belief that the Fed can solve everything or you always hold stocks last year lost money. Those that stick to a belief in deflation in the face of rising gold prices may similarly lose money or miss out on investment opportunities going forward.
For a few months last year I personally considered the possibility that deflation was going to be a new trend. There are some solid economic arguments for it if you read Murray Rothbard’s book America’s Great Depression, which explains why deflation took hold in the 1930’s. There are some similarities to what happened back then as compared to today, but also many differences.
The problem is that most of the really hardcore deflationists aren’t grounded in real economics, but in very esoteric theories that have very little scientific basis to them and are not accepted at all by the mainstream. It is almost like a religion for these people. I guess believing in fibonacci sequences is a type of modern day religion or investment cult.
But in the end if you want to make money in the stock market you cannot stick with some rigid thought system. All investors face the challenge of having to accept the reality that the market is telling them they are wrong at some point. If you have been in the stock market long enough I’m sure you made the mistake of just sticking to some view while the market kept going against you at some point. I know I have. Everyone has. When the market first went up I thought it was a bear market rally, but eventually I caught on. The trick is minimize such mistakes as much as possible.
And right now gold is going up. Gold is heading to 1000 and beyond. The question is what does that mean to you and should you do anything about it?
Don’t ever chase anything if you want to go long. Gold and gold stocks made a tremendous move last week. They may go straight up from here, but what is more important than catching a move in a market or class of stocks is to only take an investment position with a game plan that includes an evaluation of the amount of money you are willing to risk and an analysis of the potential return you can expect.
Just buying, because you see something moving isn’t enough to meet this criteria. If you buy gold stocks you need to know where you are going to get out if you are wrong. You need to know where you will place a stop loss order. If you can’t do that in a comfortable area, because it already has gone up so much then you are best to be patient and wait for a period of consolidation or a pullback to take an entry point.
Now if you are short and bearish and believe that gold has to top at 1000 because your wave count says so or for other reasons that we are facing deflation and this is a final fake out then still you need to have a stop loss order for your short positions in case you are wrong.
If you are short and refuse to do that then all I can say is I’m going to pray for you.
This article continues in the WSW Premium members area. For the rest of it click here.
Mike Swanson is the founder and chief editor of WallStreetWindow. He won second place in the 2002 Robbins Trading Contest and ran a hedge fun from 2003 to 2006 that generated a return of over 78% for its investors during that time frame. He has published a financial newsletter since 1999 and writes WallStreetWindow Power Investor, a $495.95 a year premium service geared towards accredited investors. Its 1,300 subscribers include hedge fund managers, brokers, newsletter writers, and investment advisors.
What is WallStreetWindow?
Wallstreetwindow is an online community of independent investors, analysts and newsletter writers helping each other succeed in today’s financial markets with over 80,000 opt-in email subscribers and 140,000 visitors and 350,000 page views a month.
Wallstreetwindow provides Mike Swanson’s WallStreetWindow Power Investor posts, members blogs, and aggregated article submissions from other websites and blogs across the internet in order to provide visitors with unique actionable investment ideas.
I hope everyone enjoyed the weekend!
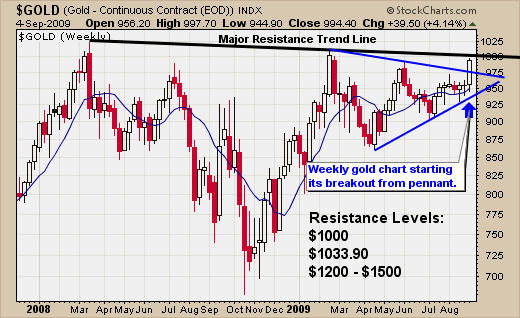
Gold is once again the hot commodity, as the price rises to the $1000 per ounce level. This $1000 – $1033 is a technical pivot point for gold. One of two things is going to take place in the coming weeks.
If the price of gold can move above $1033 then I expect to see a lot of traders and investors buying gold, as they panic into the position because they do not want to miss another gold rally. Also traders who are short gold will be forced to cover their positions and this will send the price of gold rocketing higher towards the $1200- $1500 area.
On the other hand, if gold fails to break higher, we will see a swift sell off, as everyone sells their position.
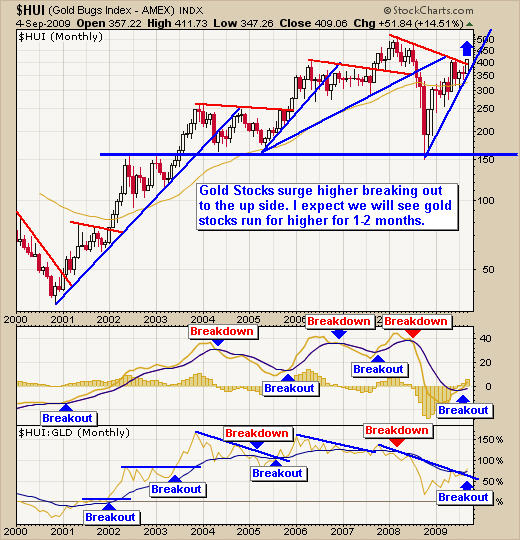
HUI – Gold Stocks Index – Monthly
I like to use this chart for timing longer-term gold investments. Gold stocks tend to lead the price of gold on a percentage gain/loss basis and so far this month, gold stocks are on fire. This bodes well for gold.
When I see breakouts on this monthly chart, I tend to take larger positions in gold and gold stocks because rallies tend to last 2-6 months. I like to take profits, as the price rises, so that I am locking in gains while still taking part in the continuing move.
The gold stocks (Golden Rockets) we purchased 2 months ago are now up 45% and 100% from our entry point and they still look very strong. Taking some money off the table is a great idea. Gold could go either way fast and it’s better to sell some of the position to lock in profits and let the balance of the trade run. Too many traders swing for a home run and never take profits on winning positions. Winners eventually turn into losers if you hold on to them long enough. Money management is the key to successful trades.
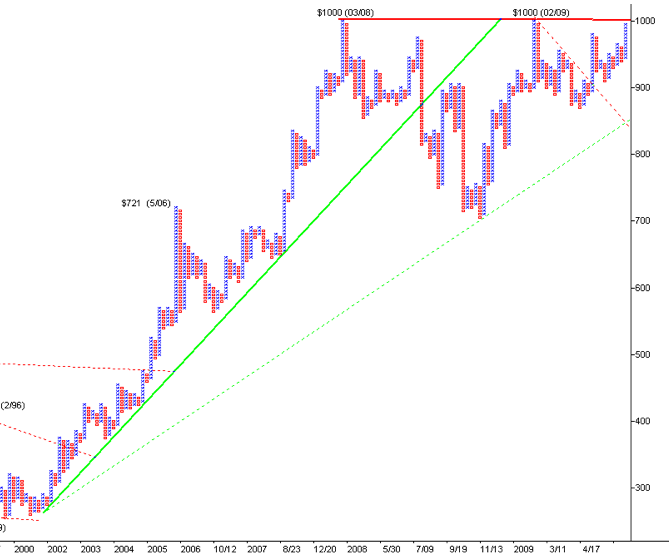
Price of Gold – Gold Bullion – Weekly Chart
This chart clearly shows the breakout last week from the pennant pattern. The price of gold is nearing resistance. This week will be exciting as gold tries to breakout.
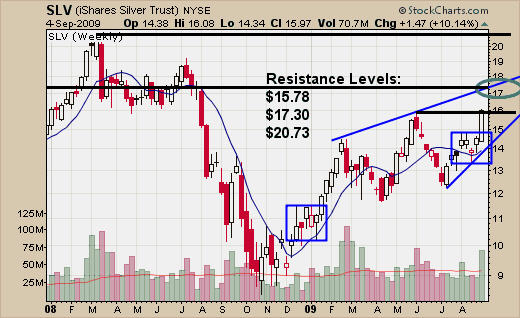
Price of Silver – Silver Bullion – Weekly Chart
Silver is not as close to the 2008 high like gold is, but is still performing well. Silver is trading at a short-term resistance level and I expect to see higher prices this week.
Silver and Gold Newsletter Conclusion:
Gold and silver are starting to run higher and with all the media coverage I expect to see money moving into precious metals for a couple months. This is an exciting time for precious metal investors and a lot of money is going to be changing hands once these metals pick a direction and start moving.
I will be sending out my energy report for oil and natural gas tomorrow. If you would like to receive my trading reports please visit my website at: www.GoldAndOilGuy.com
Chris Vermeulen
About TheGoldAndOilGuy.com:
My name is Chris Vermeulen, founder of TheGoldAndOilGuy newsletter. I provide you with unparalleled trading newsletter with charts, signals and email support. Unlike other investing newsletters, I’m a one man show. That’s because I don’t want some hired hand giving you advice while I take it easy on a beach somewhere. You ALWAYS get precise, valuable information DIRECTLY from ME.
Interview: Trading Expert Helps Investors Learn the Ropes
Testimonial: Chris, Your reports are technical and thoughtful and above all you are cautious. I learn something from every report. WH Toronto.
I believe this is the perfect trading service for active traders who want a conservative yet highly profitable trading strategy and signals. The GLD Gold exchange traded fund allows for very accurate signals when used along with the price of gold, HUI, USD, bullish percent charts and gold stocks. I also focus on USO, UNG, XLE, and XEG.TO energy funds. When these factors are used together with technical analysis and my proven trading strategy, trades become very CLEAR and SIMPLE to execute. My strategy makes your trades extremely accurate with very little downside risk.
YOU get these important Benefits, Features and Tools
TRADING SIGNALS
Spot Gold Bullion Signals
Gold – GLD Fund
Spot Silver Bullion Signal
Silver – SLV – iShares Silver Trust
Gold Stocks – GDX, XGD.TO Funds
Crude Oil Signals
Crude Oil – USO, XLE, XEG.TO Funds
Natural Gas – UNG Fund
TRADING EDUCATION
– Unlimited Email Support
– See My Live Trading Charts
– Clear Entry, Exit and Stops
– Weekly Special Trading Reports
– Learn My Trading Strategy
– 401k, IRA & RRSP Tradable
– Coming Soon Detailed Gold & Oil Trading Blue Print
The Rodney Dangerfield of All Investments
I awoke this morning to find an email from one of the financial journalists I really like and respect. It’s subject was “Gold’s Struggle.” Here’s an excerpt from that email:
“…I’ve noticed that despite most analyst expectations that gold will soon top, and maybe even topple over, the $1,000 mark, it has yet to do this with any conviction. The last time it climbed to a record high, many analysts were saying the price would climb so much higher — even to $2,000 in as little as 2 years. What’s happened to gold, why is it struggling to breach these price levels that so many were so sure it would breach and what would it take to make gold do what most people thought it would?…”
Despite outperforming most assets for quite some time (including the Holy Grail of investments, general equities), gold really never gets the respect it deserves. The reason for this is simple and must be understood by its buyers/lovers. 98% of all the players in the financial world are long financial assets. It’s not in their best interest to see gold going up sharply as it suggests all is not well within the “Don’t Worry, Be Happy’ crowd that greatly influences the financial services arena worldwide. In this case, gold is a thermometer and its taken the temperature of the world reserve currency and its owner and concluded the patient is terminally ill.

This journalist has been among the most open-minded towards gold I’ve known so you can only imagine what’s on the mind of most other journalists, many of whom make their living working with the “Don’t Worry, Be Happy” crowd every day. Don’t expect to find widespread support for gold in the media. It’s really the #1 go-to hate investment among all who apply their trade in and around the financial services industry.
Having said that, one journalist that has been favorable to gold’s appeal penned this column today.
We remain in a secular gold bull market where it’s not a question of if, but when$1,000+ becomes a floor, not a ceiling. Don’t get caught up in gold’s ability or inability to get above $1,000 and stay there. Concentrate on the fact that it’s hovering at its all-time high and yet most of the world has missed the tremendous gains its afforded those of us for several years now. The party will be nearer its end when your neighbor stops speaking about how they’re trading Intel or Google but rather a mining stock they can’t even pronounced. This scenario isn’t even on the drawing board so party on dude!
Ed Note: click HERE for a larger, more easily readable version of the chart below. The larger chart also shows the action from 1982-2009. The snap below is just a section from 1999 – 2009 :
Some bullish articles for gold
This IMHO was dramatic news that the overall market yawn at but was extremely bullish for gold and very bearish for U.S Dollar
China is now a net seller of U.S. Treasuries
The following posted Sunday Sept. 6th/2009
Please note – I’m on a working vacation the next two weeks. My postings may not be as frequent as usual but I’m still here.
While all eyes were on the monthly employment statistics on Friday and what they may be saying about our so-called economic recovery, long-term investors should find this news far more concerning. What does it say about our country’s inability to increase employment over a ten-year period? While the financial crisis of the last 24 months has made many Americans wake up and take notice, they remain mostly unaware of the many other negative factors that were festering for years and the extent of how dire things were becoming.
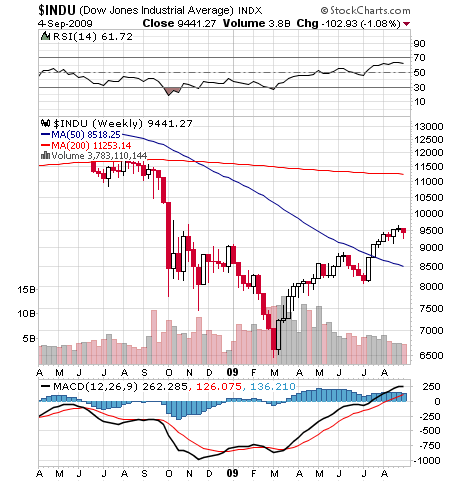
U.S. Stock Market – The bullish argument may have taken a hit of late but it would be unwise to conclude the highs of this bear market rally are in just yet. Make no mistake about it, my stint in the bullish camp is over. However, it’s going to be tough to take the market down substantially from here while economic recovery remains evident in key parts of the world. The “Don’t Worry, Be Happy” crowd may be able to keep those “green shoots” tangling in front of their troops long enough to allow for a 10,000+ number on the DJIA. Again, I want no part of such a “final run” and am extremely comfortable sitting on spectacular returns afforded us these last 24 months. The fact that we continue to profit handsomely from the metals side of things only makes my sideline view easier. If we do get to 10,000 – 10,500, fantastic as it appears it would afford us the best selling opportunity since October 2007. It’s okay too if we just work lower from here because one would have a pile of cash to shop with again at the lower range of what I think is going to be a U.S. stock market range bound for years to come.
U.S. Dollar – A deeply oversold condition was noted several weeks ago and a window of opportunity for the dollar to rally was presented. So far poor Uncle Sam has merely managed not to go much lower. We’re at one of those points in time where both the cup half-full and the cup half-empty viewers can each make a decent argument. Such a time frame warrants careful attention as a significant move is near, only the direction is not identifiable as of yet. Therefore, I believe we would be best served to await one of two points to be taken out on a closing basis.
A close above 82 on the U.S. Dollar index would suggest a significant bear market rally was beginning while a close below 77 would suggest a test of the lows around 70 were now in the cards. Stay tuned.

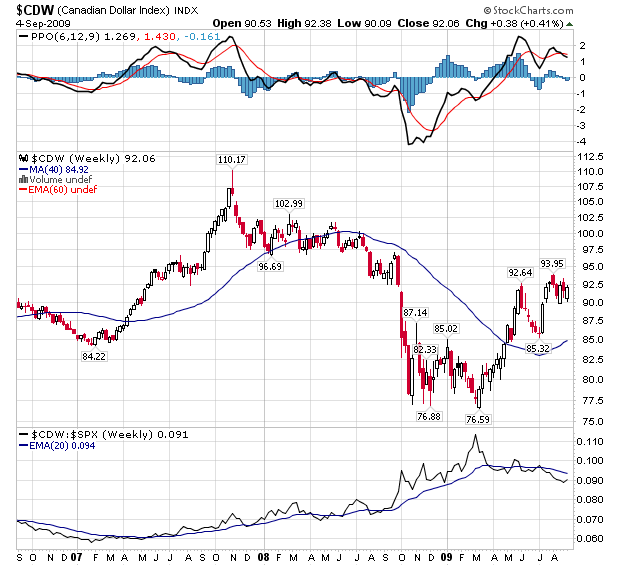
Canadian Dollar: I would like to note that I said the Canadian Dollar was my favorite currency back when it was trading well under 80 versus the U.S. Dollar. I went so far as to strongly suggest one should take savings in U.S. banks and convert them into Canadian dollars and place them in a Canadian savings institution. I did so on the belief Canada was in far better economic shape than the U.S. and the currencies would reach parity. I think both outlooks are proving to be correct.
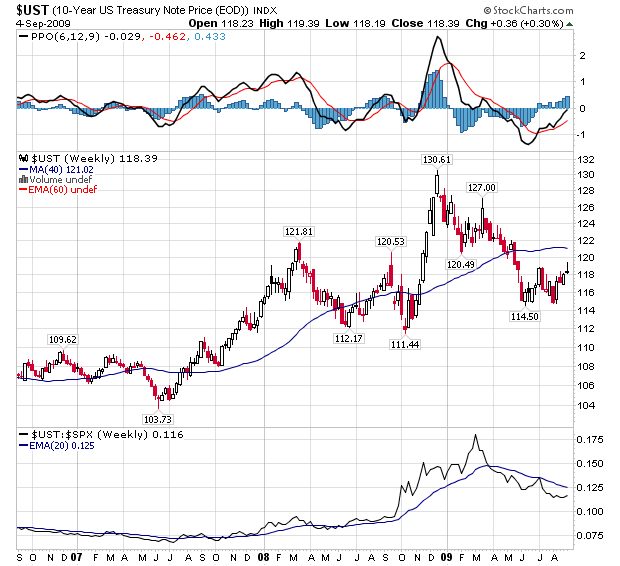
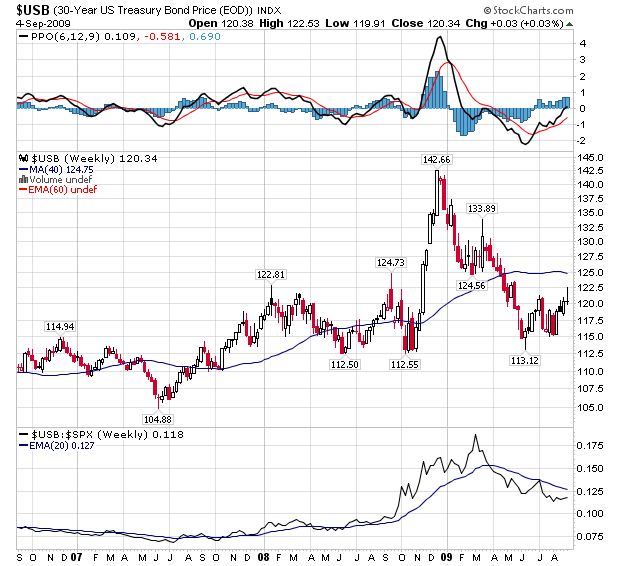
U.S. 10 to 30 Year Treasuries – Those of you scratching your head wondering how economic recovery can be underway yet interest rates are not rising, need to know you’re not alone. Well actually I do know and while its a bit frustrating at the moment, it’s only making the price to pay down the road that much bigger.
This was a very interesting piece of news that I believe you better put in the memory bank. I believe it’s yet another indicator of the days of China being a big buyer of Treasuries are behind us.
Oil – I continue to look for a $5-something price ($50-$59.99) before any new consideration of going long again.

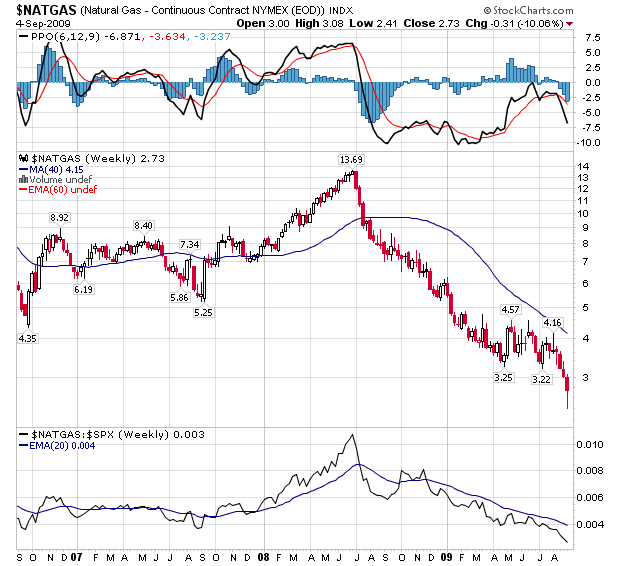
Natural Gas – While I’m no longer a growling bear on natural gas, I’m not quite yet to join whats ever left of the bullish camp (there has been widespread bullishness from several dollars higher, especially within the Canadian financial community and they have to be badly beaten up by now). I don’t think you’ve to be an “Einstein-type” to believe we’re going to see a cycle low between now and years-end. The question is do we try and time it to the day and hour or take a stab somewhere here knowing it could print down to zero before coming back to and above where we enter?
The addition question mark regarding natural gas is exactly how to play the long side? Because the oil and general equity market was strong, natural gas stocks were swept up in price. This has caused many to be overpriced. Do you step in when you think the gas price has hit bottom on the belief the shares will rise with a rebounding price and/or a continuing rising equity markets? Or do you wait because even if the gas price bottoms, the shares could come off because the fundamentals start to become reality in the share price and/or general equities go lower?
Stay tuned.
Precious Metals – Pardon me but I must point out how silly it is to me how certain commentators who continue to be far more wrong than right continue to be sought out for their opinions on gold. In the case of gold there are two who come to mind. Both have been horribly wrong on gold for years. I called them the “Andy Smith’s” of the 21st century (hard-core gold bugs understand this). While simply betting against them is not encouraged, it does personally comfort me when I’m on opposite sides of them.
I would welcome some consolidation and correction in the gold price in the coming days solely so it can go back to its normal place among the media – the back burner. Please know that this latest gold rally has not only been missed by many, it’s also being heavily shorted into. Both groups have been trying to talk gold back down. While they may have some very short-term success, the barn door is already open and a regular four-digit gold price to come is not a question of if, but when.
This is an extremely important bullish piece of information. And this doesn’t hurt either.
Model Portfolio Comment – The 5 stocks recommended just last Monday are up and average 20% in one week. I would look to buy any of them if we’re fortunate enough to get a pullback this week. If they just keep going straight up from here, we’ll have to just cry all the way to the bank. The portfolio has been updated.
Grandich Client Companies – With the summer doldrums behind us, I’ve begun speaking in-depth with company clients in hopes of bringing to you up to date information in the coming days and weeks.
On Major Moves, Grandich has been very right and not only saved many investors fortunes, but expanded them dramatically. On November 3, 2007 at the MoneyTalks Survival Conference, Peter Grandich of the Grandich Letter warned that “an unprecedented economic tsunami will hit American beginning in 2008”. Peter advised publicly to short the US market two days from the top in October, 2007 and stayed short until the last week of October, 2008. He began to buy stocks in March 7th, 2009. He also bought oil and oil related investments near the lows after the dive from $147.
….go to visit Peter’s Website.
Quotable
“All men can see these tactics whereby I conquer, but what none can see is the strategy
out of which victory is evolved.” – Sun Tzu
FX Trading – China – Inscrutable, or Screwed?
Editor’s Note: Today we are running a guest editorial from our good friend Tom Jefferies at HoweStreet.com. Tom is seasoned veteran of the financial markets with tours of duty at various top-flight media organizations. He has a unique focus on the global macro environment garnered over years of study, real world experience across many borders, and access to top-flight investment talent across the globe. Enjoy!
——————————–
I am constantly stunned and surprised at the pronouncements that the worst is over and the World Recession is at an end.
A few months ago, in my neck of the woods, the Canadian Federal Government was saying we would skirt a recession – then it was a ‘technical’ recession…NOW?
The fundamentals stink and yet, in parts of “The Great White North”, the casual display of Real Estate Investing on a wing and a prayer, and credit card binging continues apace.
Take a look at the Global picture. Take a look at the Export numbers and you can see a trend. It’s down.
I am going to bet that we see the Indian and the Shanghai Composite roll over like a dead egg roll, before the end of the Fourth quarter. Looking at a chart of the SCI, even my 13 year old cat can figure out that it’s Bear City.
The SCI has been around a whole TWENTY years and in that smidgen of space and time – the SCI absorbed four huge Bear Markets and four equally loony manic highs.
Looking at the growing unrest in China over jobs, Religion and mixing in the history of banking misadventures in the Middle Kingdom, they all seem to portend a fiscal train wreck of Brobdingnagian proportions.
Even Jim Rogers has moved on to Sri Lanka looking for bargains.
From TheStarOnline.com:
• CHINA’S new yuan-denominated loans in July amounted to 356 billion yuan. The monthly increase was the lowest this year.
• Urban fixed asset investment grew 32.9%, lower than expected.
• Industrial production rose 10.8%, also lower than expected. Exports in July were
down 23% year-on-year, compared with a 21.4% decline in June.
Internal demand?
I wonder.
If thousands, nay, millions have lost their job, because they aren’t selling anywhere near as many crappy jeans to the cash deprived Western Consumer – where is the demand going to come from?
India?
Yes – it is ‘booming’ – but there are many questions about the rate of absorption of high velocity monies into visible infrastructure projects that actually get built, without being withered by huge endemic corruption.
India will also have to make huge and painful changes in housing, roads, sanitary facilities, Rail and Air transit routes, Hospitals and Schools.
India works on it’s own timetable and will try to maintain the profile of the last five years, but I have a feeling it will be an erratic voyage.
Economists seem to discount the deep Hindu belief structure as well as the terrifying and very real Geo Political games being played out in Kashmir.
India and Pakistan are armed with Nuclear weapons and both are upgrading their Air Defense and first strike capabilities.
Not all the hot money pouring into India is going into building roads. *(India tried a Moon Shot last month – it was not a success).
Meanwhile back in China – I am getting more and more skeptical as to the real strength of any of the so called ‘green shoots’.
I am even more skeptical of the ability of the Central Planning Committee in Beijing to keep them alive, no matter how much manure and Yuan they throw on the problems.
Look for more bumpy flight time ahead.
Tom Jefferies
—————-
Thanks Tom!
Jack Crooks
Black Swan Capital LLC
www.blackswantrading.com
Register HERE for the FREE Daily Currency Currents Newsletter.
Black Swan Capital is an independent minded currency advisory firm established to provide subscription-based services to help retail and institutional clients consistently attain above average profits trading and investing in both forex and currency futures markets. We tell our Members when to enter and exit and why. HERE for more information.
Our commitment is to deliver well researched trading recommendations that our clients understand and can efficiently execute through their brokers. We outline the reasons to enter a trade and define the risk. But our Members must understand there is a substantial risk of loss trading in forex (off-exchange retail foreign currency) and currency futures markets.
Register HERE for the FREE Daily Currency Currents Newsletter.As a subscriber to Currency Currents you stay tuned-in to our current global-macro view and our analysis of key investment themes driving currency prices. Nothing is off limits to us in this free-wheeling look at the markets. Some days you’ll receive ramblings on trading psychology, while other days we may take an academic approach in explaining esoteric economic issues. Ultimately we have one goal in mind: to help you get a handle on the key investment themes driving global capital flow. Because if you know where the money is going, it increases the probability that yourposition in the market will be a profitable one.
-
I know Mike is a very solid investor and respect his opinions very much. So if he says pay attention to this or that - I will.
~ Dale G.
-
I've started managing my own investments so view Michael's site as a one-stop shop from which to get information and perspectives.
~ Dave E.
-
Michael offers easy reading, honest, common sense information that anyone can use in a practical manner.
~ der_al.
-
A sane voice in a scrambled investment world.
~ Ed R.
Inside Edge Pro Contributors

Greg Weldon

Josef Schachter

Tyler Bollhorn

Ryan Irvine

Paul Beattie

Martin Straith

Patrick Ceresna

Mark Leibovit

James Thorne

Victor Adair