
Daily Updates
The Russian central bank will spend $1bn next week, buying 30 metric tons of gold from Gokhran, the state repository. Gokhran had planned to sell 20-50 MT on the open market, but cancelled after news of the sale leaked. The sale would have helped plug Russia’s budget deficit, and, apparently, purchase some diamonds from state-run miner Alrosa….
Does this not strike you as being odd?
In case you missed it, Russia announced that they are selling gold to THEMSELVES!?!?
The source of the gold data table appended below is the World Gold Council. It states that Russia possesses 607 [actually, now officially 640 tonnes with the addition of the recent 30-ish tonne purchase from itself] metric tonnes of gold bullion.
The revelation that Russia is “selling gold to itself” and lack of acknowledgment that Gokhran exists – is a MAJOR omission by the World Gold Council in their aggregate gold bullion data.
(Ed Note: go HERE and scroll down for a larger image of the World Official Gold Holding December 2009)
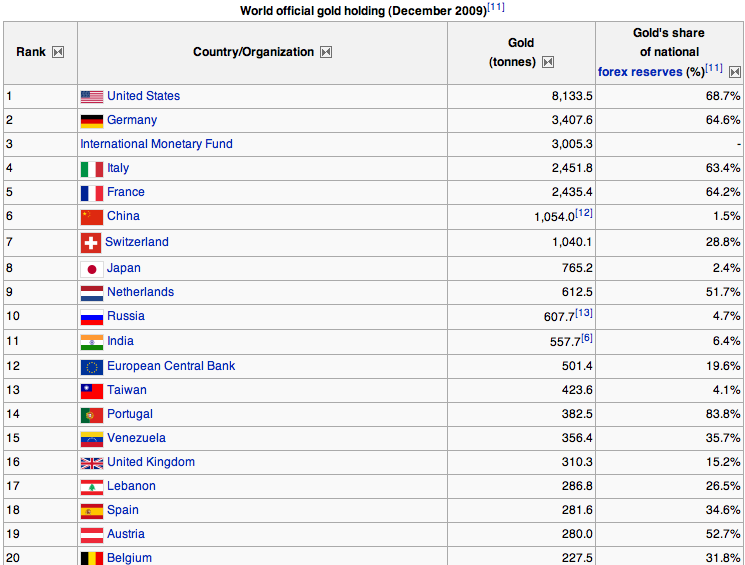
++Additionally, the World Gold Council also reports that as of October 2009, gold exchange-traded funds held 1,750 tonnes of gold for private and institutional investors.
The World Gold Council’s data keeper is GFMS Ltd. The GFMS web site makes the following claim:
GFMS is the world’s foremost precious metals consultancy, specializing in research into the global gold, silver, platinum and palladium markets.
GFMS is based in London, UK, but has representation in Australia, India, China, Germany, France, Spain and Russia, and a vast range of contacts and associates across the world.
Our research team of fifteen full-time analysts comprises qualified and experienced economists and geologists; while two consultants contribute insights on important regional markets.
Executive Chairman Philip Klapwijk and CEO Paul Walker appear regularly at international conferences and seminars, and their articles have been widely published. All analysts travel regularly and extensively to stay in touch with GFMS’ unrivalled network of contacts and sources of information around the world.
With 15 full-time analysts, two consultants and “representation” in Russia – how is that GFMS [and by extension the World Gold Council] can omit such a large hoard as stored at Gokhran and materially misreport the nature of Russian gold reserves? They didn’t even mention the existence of Gokhran in a footnote.
Gold professionals who have been inside Gokhran [Russian] State bullion depositories have provided me with personal accounts of this bullion depository. They report scenes reminiscent of the movie Gold Finger – on steroids – literally countless metric tonnes of neatly stacked gold bullion.
So, a better question might be, what else – regarding GOLD – has GFMS and the World Gold Council not reported or omitted?
Getting A Beat On Where the World’s Physical Gold Is Stored
It is generally accepted that for the entirety of mankind’s existence on this planet – the earth’s crust has yielded roughly 160 thousand metric tonnes of gold. The World Gold Council / GFMS identifies where roughly 32 thousand tonnes of that total are located.
We might add to what’s listed above, the following:
“No one knows exactly how much gold has been passed from generation to generation and is now stashed in safe deposit boxes across India. But bullion analysts estimate Indian families are sitting on about 15,000 tonnes of gold worth more than $US550 billion ($A600 billion).”
Then, if we conservatively assume that the rest of the world has as much as India stored away in safe deposit boxes – that’s another 15,000 metric tonnes.
Therefore by using reported World Gold Council / GFMS data plus some very conservative assumptions, we can approximately account for 62,000 metric tonnes of the world’s roughly 160,000 metric tonnes ever mined.
By the process of elimination and adjusting for the 62 thousand metric tonnes referenced above, there is a residual 98 thousand metric tonnes of physical gold bullion; the location of which cannot be readily identified.
The very nature of World Gold Council / GFMS data may be characterized as being static and don’t tend to change much year-over-year. This demonstrates that the owners of gold bullion DO NOT GENERALLY TRADE THEIR PHYSICAL STASHES – they sit on them!
The Conundrum That “IS” the London Bullion Market Association [LBMA]
The LBMA is considered to be the world’s foremost physical gold market. Here is their data on the number of ounces of gold “transferred” DAILY – by month, year-over-year – from Nov. 08 – Nov. 09:
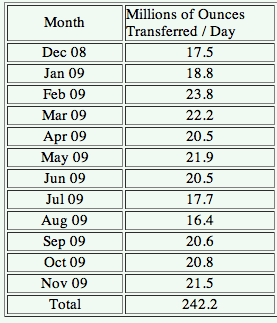
There are 22 business days per month, so the LBMA claims to have traded 151,046 metric tonnes of gold in the most recent 12 month period.
242.2 x 22 = 5,328 million physical ozs or 151,046 metric tonnes
The LBMA reports that they have “transferred” or traded 151,046 metric tonnes of gold – a commodity that when folks possess it, they are demonstrably inclined NOT TO trade it. Using another bench mark, annual global mine production is in the neighborhood of 2,500 metric tonnes. The LBMA claims to have sold last year’s global mine supply over 60 times in 12 months.
The LBMA claims to do this year-in, year-out.
This implies that ANY LBMA physical gold stocks are HIGHLY LEVERAGED through trade in paper gold
London is but one exchange where gold trades. Others include N.Y., Tokyo, Dubai, Bombay and different points in China. Don’t forget, physical ounces traded on ANY of these exchanges are additional ounces that London cannot be trading.
The reality is that every physical ounce of gold reported to be in the vaults of the LBMA and exchanges in general, is sold tens and perhaps more than a hundred times over in paper form. This paper selling suppresses what would otherwise be the freemarket gold price.
The Russians are known to be very shrewd and calculating. It makes one wonder whether the Russian announcement of a sale of gold bullion – TO THEMSELVES – might not have been a “tell” signaling their intention to not only withhold physical metal from the market and ensure that paper promises of delivery of real metal are honored.
Could it be that the Russians are really signaling that the assignment of false, arbitrary values [using futures / derivatives] to finite resources will no longer be tolerated?
If so, the real leverage is in owning physical gold bullion – not the paper promises.
For those who want to read more inciteful macro-economic analysis like that outlined above. Subscribe HERE
A year ago we said we believed a full court press by G10 central bankers, finance ministers and governments would succeed in at least halting the slide. It did, and markets responded more strongly than even we had hoped for, and we were among the more optimistic observers 12 months ago.
We also said a year ago that you were unlikely to see a repeat of 2008. It’s safe to say the same comment applies again. 2010 will not look like 2009.
Most markets experienced massive revision to the mean last year. That may be repeated again on a smaller scale, though this year that implies weaker gains for markets, not higher ones.
2010 will, hopefully, mark a transition to more normal economic conditions. That is positive, but it should also mean some upward movement on the interest rates and perhaps the US Dollar may have to be navigated.
EQUITY MARKETS
At the start of 2009 we looked for gains for most markets, and emphasized the likelihood of the developing, creditor economies, and resources they need, to outperform. At the time, commodity prices were nearing their bottoms, though few could say how quickly they would recover. Seized-up credit markets had halted trade and many were seeing the onset of Depression in the numbers.
Markets had one more nasty down leg in them, and didn’t turn until the US Fed finalized it’s “too big too fail” list and started quantitative easing in a big way. Other central banks joined in the rate cuts, though the Bank of England was the only other to undertake QE officially.
The scale of the move off the bottom has many expecting the worst yet again. That’s an understandable viewpoint. The percentage moves off the ultimate bottoms have been very large by any standard.
The table below lists opening and closing levels and percentage changes for 2009 for several exchanges. Most exchanges suffered panic selling through February followed by an equivalent bounce in March. Using calendar year stats in effect cancels this out. That yields year/year gains that look a bit less hair-raising than the percentage moves off the absolute bailout bottom. This is arguably a more useful comparison; panic selling (and buying) can generate price changes that say as much about a given market’s liquidity as it does about underlying conditions.
The table lists results for major G7 and “BIC” countries plus the TSX Venture which is our proxy for the exploration sector. We italicized the results for the BIC indices and the TSXV though the highlighting isn’t necessary. The difference between the returns for these markets in 2009 and the “debtor country” indices is dramatic, to say the least.
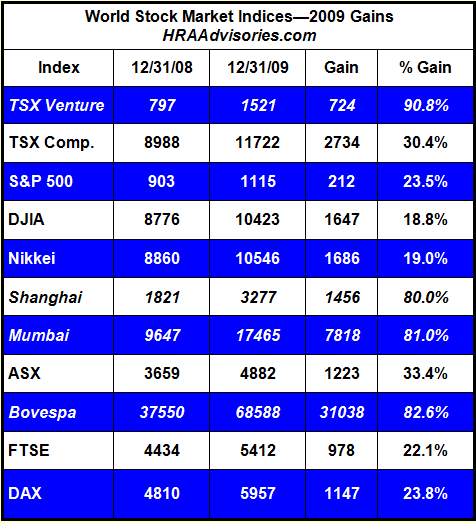
Debtor country indices averaged a 21.4% return in 2009 while the BIC indices averaged 81.6%, fully 60% higher. We didn’t include Russia’s RTS index to create the more familiar “BRIC”, though that would have generated an even higher average.
Though less mature bourses are inherently more volatile, more it going on here. Part of the reason for the difference is that none of the BIC countries saw the level of panic selling the G7 markets did in Q1. India and Brazil had far milder declines and the bottom in Shanghai actually came in 2008. But the main reason for the difference is that these economies had either very mild recessions or none at all.
Also of note is the roughly 10% out performance by the indices in Toronto and Sidney. Canada and Australia (particularly the latter) have heavier commodity weighting and were sustained to a much greater degree by exports to China. Having banking sectors that were not totally dysfunctional didn’t hurt either.
As we expected, the highest percentage gain was enjoyed by the TSX-V. We thought a bounce from a 75% drop combined with good commodity prices should generate a large percentage lift. That gain only brings the Venture index to half of its 2007 level. There is plenty of repair work left. Gains have been and will remain selective for some time yet, and no one should be expecting a repeat of that move.
EQUITY MARKETS 2010
We had been concerned about a revisit to the 2009 lows but those fears have dissipated, somewhat. The zero interest rate regimes brought a partial return of risk capital and the steepest yield curve in history is allowing banks to work on repairing their balance sheets.
No one should be complacent after a rally like the ones the markets experienced in the second half of 2009, but it doesn’t pay to underestimate the impact of zero rates and cost cutting either. The 2009 rally was not just about earnings expectations but about the interest rate used to discount them. Zero rates allowed for P/E expansion even though the “E” was actually pretty lame.
We expect earnings growth will be good for at least a couple of quarters going forward. Cost cutting, that reached panic levels across many sectors, and inventory replacement should generate impressive looking Y/Y earnings growth in Q4/2009 and Q1, and perhaps Q2. The bad news is that these gains will have come at the expense of unemployment. The happy Y/Y comparisons will dissipate as we get into H2 2010. Earnings and economic growth can continue later in 2010 only if economies begin to create jobs.
Employment growth may turn positive soon, but it will still be weak in most industrialized economies. Debt de-leveraging is far from complete and income growth will be needed to pay down debts for some time yet. We don’t see anything other than a large drop in the unemployment rate putting an end to residential and commercial foreclosures in the US.
All in all, we think its possible Debtor country indices can notch gains in the first bit of this year, but whether those gains hold or melt away later in the year will depend on the recovery broadening enough to attract re-investment.
Critical to this will be how the “sideline money” reacts through the first few months of 2010. While there is much concern about overly bullish sentiment in the markets, the money flows don’t seem to bear this out. Volumes on most major exchanges are extremely light. Even with a couple of large money market funds imploding in 2009 money parked in such funds is still near all time highs.
Investor surveys display bullish sentiment towards equities, but retail investors put fifty times as much new money into bond funds as they did into equity funds in 2009.
Clearly, many investors are still afraid of equities. It’s hard to say what, if anything will change this. A rally of close to 70% (from bottoms) hasn’t been convincing. A large pull-back may bring in bargain hunters but others may take it as proof they have been right to steer clear of equities.
Ironically, an increase in bond yields may drive some money back into equities. With rates at all time lows, odds are bond funds will perform poorly this year. Whether this generates new money flow into stocks at some point or investors simply abandon mutual funds of all types won’t be known until the worm turns.
If volumes do increase in the short term it will be partially due to some expected selling by those who did ride this rally. Funds that were smart or lucky enough to catch the bottom now have large gains to protect. That may cap near term gains. In short, while there may be more legs to the rally, it’s simply prudent to harvest profits occasionally and keep on your toes.
Even if the Y/Y change in the major indices is not large there will be plenty of volatility along the way, and continued light volumes will only enhance it. Note again that the comments about volume do not apply to the TSXV where trading volumes remained strong through 2009.

These are all inter-related to some extent as can be seen from the charts below. One important take away from these charts is that the relationships between the US$, gold and Treasury yields have not been static. They have changed and even reversed a couple of times in the past two years, and are often different from how are sometimes perceived.
In particular, it’s worth remembering that gold in fact rose when the market was at its most panicked. The dollar held a strong inverse relationship to yields as money poured in to the Treasuries market during the panic. Those relationships appear to be starting to weaken and may potentially reverse. The USD and US bond yields have both strengthened in the past few weeks. This may be the bond vigilantes at work selling bonds on stronger US economic stats, which is a potential concern for 2010.
The US has to sell $2.4 Trillion in T-bills and notes in 2010 and has stated its intention to try and move farther out the yield curve. The US Government has been “borrowing short and spending long” for the past couple of years. This is exactly the pattern that got bankers in trouble so many times in the past. The question is whether bond buyers will agree to purchase enough longer dated treasuries this year at low yields.
We emphasize that we still see little or no chance of the Fed wanting to raise rates any time soon. The steep yield curve and near record low refinance rate are just too important to a fragile economy. The real question is whether bond traders do this in spite of efforts by the Fed to avoid it.
One question that will be answered in the first few months of 2010 is how much of the low rate environment is due to brute force buying by the Fed itself as part of its quantitative easing program. It’s certainly been a force in the market, but general caution and heavy inflows by private investors and other central banks are at least as big a factor.
We think yields are going up, especially if equities continue to do well, but probably not by more than a percent or so on the 10 year note. More than that, or any news that the bid to cover ratio on treasury auctions is weakening significantly (a ratio of 2 or higher, signaling a strong market, has twice as many bids than is needed to close the auction) should be taken as a danger sign and a signal for profit taking. If things get ugly, this could happen fast – better safe than sorry when it comes to the bond market this year.
As far as the $US itself goes, the much anticipated Dollar rally is upon us and not looking that impressive so far. The Euro and Yen have been gaining again as those regions released economic data less awful than feared. If US bond yields stay under control, the growing US Dollar float will continue to weigh on the greenback.
Many reasons have been given for a potentially large rally in the Dollar but they all boil down to the same thing: an assumption the Fed will be one of the first to raise rates. We see little reason for the Dollar to gain if the interest rate spread is not going to narrow in the near term. For all of the certainty about a big surge in the greenback we noted that large scale currency traders were pretty quick to close out their long positions as soon as the upward trajectory seemed to falter. There seems to be much less conviction about dollar gains in trading pits than on the financial pages.
If China slowed its bond purchases enough to send yields climbing in a big way, this might change. At this point Beijing still seems intent on holding the Dollar peg and is buying plenty of treasuries to recycle its current account surplus. Outside of the developing nations the problem with excessive debt is much the same across major currencies. It’s still a question of who will debase their currency faster, and the US still holds a clear lead on this.
GOLD
After reaching all time highs and overbought status, gold pulled back in December. The price fell to $1080, well below the 40 day moving average that had acted as a base since the current up leg began in September. While a breech of this trend leaves open the possibility of a move down to the $1000 level that is not a necessity. The price has recently moved back above $1120 and appears to be stabilizing.
Although the pullback is not large, it seems to have served its purpose in quelling an overly bullish market. Some of gold’s new fair-weather friends made quick exits and even gold timing publications have swung from highly bullish to bearish in outlook. For a contrarian these are all bullish signs.
Most of the large funds that became gold proponents in the past few months appear to still be on board. Some additional support also came from an announcement by the Indian gold importers group that corrected the total 2009 Indian gold imports to “300-350” tonnes from a previously reported 200.
The gold price will fluctuate against the Dollar, but it is increasing held as a hedge against all currency defamation. Even if we think some of the romanticism about gold is overdone, its supply can’t be conjured out of thin air like fiat currencies. This simple fact has attracted quite a few converts to holding some bullion as a portfolio anchor. We expect continued strength and perhaps new highs in 2010 because of this. Importantly, at current prices gold mining can finally function well.
OTHER PRECIOUS METALS
Silver, platinum and palladium had much harder falls in 2008, but all have been gaining ground again lately. Unlike gold, none of these precious metals are anywhere near their 2007 highs and probably won’t be soon.
Recent percentage gains are strongest in platinum and palladium as industry and particularly the auto sector shows signs of life globally. Neither of these metals has large supply surpluses or ready sources of new cheap production. They should see more strength as the world economy continues to normalize.
Silver is the closest of the three to recent highs and has held up fairly well during this correction. We continue to consider above ground stocks a mystery, but new base metal operations have been slow to come on stream since last year which should help tighten the silver market.
BASE METALS
The one-year price and LME warehouse inventory charts on this page tell you everything you need to know about base metals, we’re just not sure exactly what that is.
As 2009 began we found ourselves about the only ones with anything good to say about base metals. Most of them had seen their prices crushed in 2008. Because we didn’t view them as being in bubble territory before the debt crisis, we also didn’t expect it to take long for them to bottom.
Much like the growth economies that drive them, base metals put in bottoms early in 2009 or in late 2008 in the case of copper. Most of them never looked back and have climbed steadily since.
Although base metals had seen large percentage price gains last year, most are still well off their highs. The moves are pretty impressive nonetheless given demand for most metals were below 2008 levels by a couple of percent or more.
Most metals saw relatively small increases in supply in 2009 but recessionary conditions were enough to keep warehouse inventories buildings after they based in Q1. This was the reason we got cautious in Q3 though our caution hasn’t been matched by others.
Notwithstanding almost constant increases in warehouse inventories for most base metals, prices have continued to rise. While we have only included LME warehouse and price charts for copper and zinc the picture is much the same for all of them.
Most base metals are at or near year highs and inventory build appeared to be accelerating at year end. We’ve said it before but we feel compelled to say it again: Some caution is required given the current strength of most base metal prices.
It may be that prices simply don’t fall much. There may be enough buyers looking out a few years and willing to hang onto excess metal in the meantime. That’s distinctly possible but still doesn’t explain the climbing warehouse inventories.
Skepticism about prices has been reflected in the share prices of base metal producers which have been flat for several months. The good news on the base metal side is that higher prices do seem to finally be helping companies farther down the food chain.
In recent weeks base metal explorers have been raising money again. Most are not doing it at prices they are happy about, but it’s still a vast improvement over the situation they faced earlier in the year. There has also been a marked increase in copper deals in the past month. Some of those may make it onto these pages later. Promoters have decided they can get attention for base metal deals again after avoiding them like the plague for 18 months.
Though we don’t expect dramatic drops in base metal prices we still think a period of price consolidation is needed. “Non traded” materials like coal and iron ore continue to fetch good prices and overall demand is solid.
This will not be a year like last year, but we think it will be another with gains for the taking. After a year of bubble talk by those who do not understand the mining sector there seems to be renewed acceptance that prices did not recover just because a couple of hedge funds stayed interested.
While we don’t expect large gains for the major markets, they are not required for the sector we deal with to do well. As long as major markets don’t hit the panic button again, metals explorers and developers will continue to be rewarded for discoveries.
As we expected, M&A activity continues to build across the sector. Not only that, but deals are getting done at very good prices. That generates free cash for new deals and sends traders off looking for the next likely candidate. Much of the recent market gains can be attributed to that sort of buying and we think it will continue. As long as the bankers don’t drop the ball again, the game is still on.
![]()
LATEST HRA OFFER: To access Eric Coffin’s latest interview and to sign up for our Latest FREE REPORT, including HRA’s most recent new company extended review and subscription savings, click here: www.hraadvisory.com/qa01.html
Gain access to potential gains of hundreds or even thousands of percent! From March to June, HRA introduced four new gold explorers to subscribers. Those four companies have generated an average gain of +205%, to date!
Gain access to potential gains of hundreds or even thousands of percent! From March to June, HRA introduced four new gold explorers to subscribers. Those four companies have generated an average gain of 205%, to date! SPECIAL HRA OFFER: For a limited time only, HRA is offering free reports and subscription savings. Click on the link for more information: www.hraadvisory.com/sh2009.html
The HRA – Journal, HRA-Dispatch and HRA- Special Delivery are independent publications produced and distributed by Stockwork Consulting Ltd, which is committed to providing timely and factual analysis of junior mining, resource, and other venture capital companies. Companies are chosen on the basis of a speculative potential for significant upside gains resulting from asset-base expansion. These are generally high-risk securities, and opinions contained herein are time and market sensitive. No statement or expression of opinion, or any other matter herein, directly or indirectly, is an offer, solicitation or recommendation to buy or sell any securities mentioned. While we believe all sources of information to be factual and reliable we in no way represent or guarantee the accuracy thereof, nor of the statements made herein. We do not receive or request compensation in any form in order to feature companies in these publications. We may, or may not, own securities and/or options to acquire securities of the companies mentioned herein. This document is protected by the copyright laws of Canada and the U.S. and may not be reproduced in any form for other than for personal use without the prior written consent of the publisher. This document may be quoted, in context, provided proper credit is given.
©2009 Stockwork Consulting Ltd. All Rights Reserved.
The commodity futures charts and gold precious metal stocks have be trading with increased volatility as they bounce between support and resistance levels on the daily and hourly charts.
This report is focused more on technical analysis and charts so that I can show you what I feel these commodities are lining up to do.
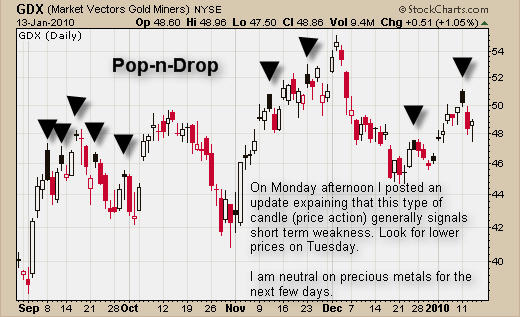
GDX ETF – Daily Trading Chart
I posted this chart Monday afternoon to members as a short educational piece and to give warning to those where were currently in short term long positions. This chart clearly shows that when the short term trend is up and we get a black candle (Pop & Drop) the odds tell us that we should see lower prices over the next 24 – 48 hours for silver and gold.
This type of price action may look easy to trade, which it is, but only day traders and even better yet futures traders, can make the most when these setups occur. It doesn’t get anymore exciting than Trading after hours with commodity futures.
The nice thing about trading futures is that charts run around the clock 24 hours a day so you do not get price gaps that miss most of the short term low risk plays. Investment vehicles on the NYSE are limited to trading from 9:30am – 4pm and that really does cut down in the amount of low risk trade setups we get on a monthly basis.
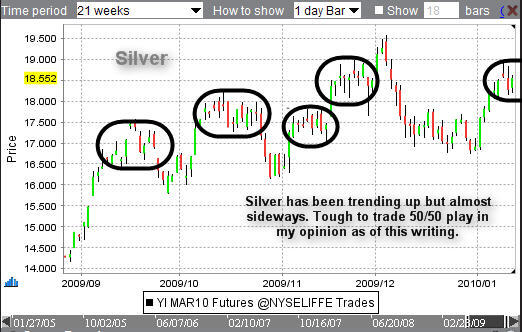
Silver Commodity Trading Contract YI – Daily Chart
Silver has been tougher to trade than gold recently. Percentage moves are much larger with silver adding more potential risk to buyers and sellers. In addition, silver is not trending strongly like its big sister gold and this adds another level of difficulty. Profits should be taken quickly during this type of price action.
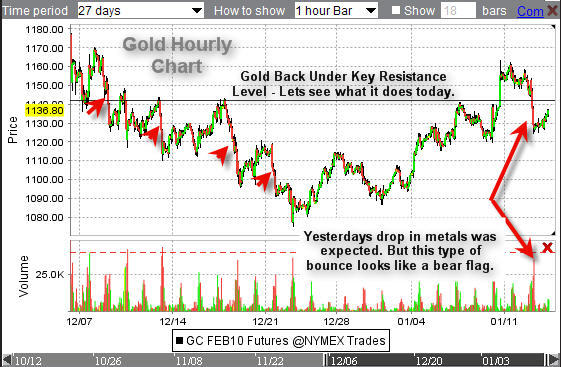
Gold Futures Trading YG Contract – Hourly Chart
Gold is my favorite and most profitable investment vehicle. I trade gold using the GLD etf and futures. Last week I wrote about this key resistance level and how I was waiting to trade until the Friday unemployment numbers were out and to see how the market reacted before putting our money to work. Over the weekend the bullish sentiment caused gold to gap above that key resistance level but has sold back down after beginning the new week.
The chart below shows that I am neutral/bearish for the next few days. Heavy selling and the small bear flag is warning me of lower prices. The natural tendency for gold is to drift higher through the night from 6pm EST – 4am EST, so we could see higher prices in the short term but what happens in the following 1-3 days will set the tone for gold.
Crude Oil Futures Trading CL – Daily Chart
Oil has pulled back the past few days and is now trading near a support level. I feel it is over sold and could bounce the second half of this week and I will keep my eye on it for members.

Natural Gas Futures Trading NG – Daily Chart
Nat gas is the most deadly commodity I know for the uneducated trader. The price swings are wild and WILL trigger you stops no matter where you put them almost. The whipsaw action always seems to form a Mega Phone pattern which means there are higher highs and lower lows during key pivot points forcing shorts to keep coving their positions and longs to keep getting stopped out as they try to protect their down side risk.
I rarely trade Natural Gas because of this. The stats I’ve heard are that almost everyone who actively trades natural gas will lose their money within 3 months. Yikes! So this is why I am so picky trading it.
The current price of NG is trading in the middle of is range. Entering a trade here is 50/50 and just not worth the risk.

Commodity Futures Trading Conclusion:
There are not too many exciting things in the market right now. We continue to watch stocks and commodities work through their patterns and cycles as we just jump in and out of the market when the timing is right. It’s like a large game of double Dutch skipping, just have to time the monitor the patterns, speed and cycles so you lower the odds of getting hit.
If you would like to receive my Free Weekly Trading Reports, please visit my website.
Chris Vermeulen
www.TheTechnicalTraders.com
Silver jumped out of the gate to begin 2010 with a flying start. It climbed a remarkable 9.7% in this year’s first week of trading to end the week at $18.45. From its $8.79 low barely fourteen months ago after the de-leveraging and mass liquidation of assets resulting from the Lehman Brothers collapse, silver has climbed an astounding 110%. But the upside fireworks have hardly begun.
….read more and view some interesting charts HERE.
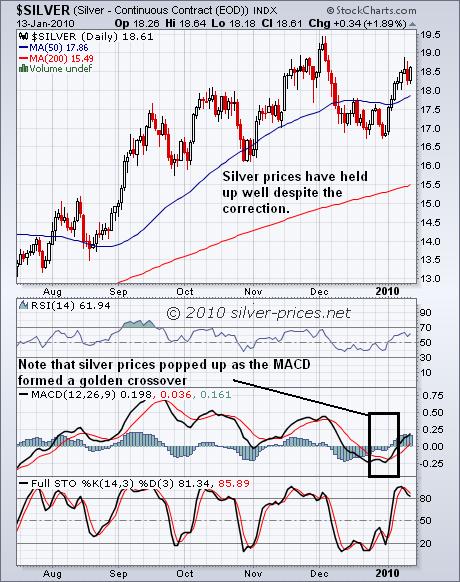
Since the last update in September 2009 silver prices have performed in a yo-yo fashion and are only slightly higher now than they were then. However, as we can see from the above chart the moving averages have moved consistently higher adding support to the silver price which bodes well for the future. Note that silver prices popped up recently as the MACD formed a golden crossover, which is usually a positive indicator. Also note that silver prices have held up well despite the correction, which we believe was a good thing for silver as we look forward to silver making a steady upward climb.
Over the last few months a number of bears have been calling for precious metals to fall, the bull market is over, the dollar is going to the moon, etc. We have not changed our position and remain very firm supporters of both gold and silver and their associated stocks. We don’t have a penny in the mainstream or broader markets and have no intention of investing there in the foreseeable future.
In our opinion both silver and gold are still a dollar play and therefore we must keep an eye on the dollars behaviour. It has had a rally recently which now looks like it has run out of steam and could fall quickly. Should this happen then new highs for both silver and gold will be more than just a possibility.
Here is a summary of the silver stocks we are currently invested in or following:
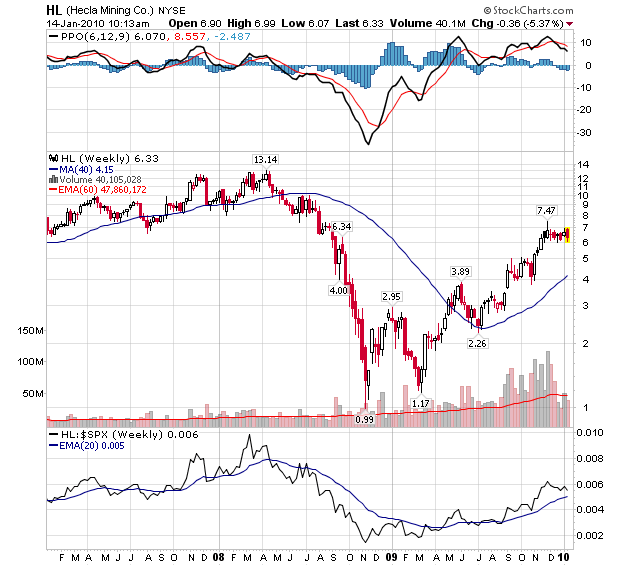
Hecla Mining Company (HL) – Initially we bought this stock for $5.27 – a quality silver stock which was going along nicely and then we thought Hecla was overbought, as it hadn’t corrected with other silver stocks, we took profits on Hecla at $11.89, the stock price then dropped so we bought it back at $9.72, getting a 18% discount on our shares. On the 14th April we sold 50% of this stock for $11.79 in order to lock in some profits as we anticipated a fall. On the 18th June 2008 we re-purchased Hecla’s shares for $9.61. Hecla has traded as low as $0.99 and closed yesterday at $6.29. Hopefully Hecla can continue to improve and eventually surpass its previous highs.
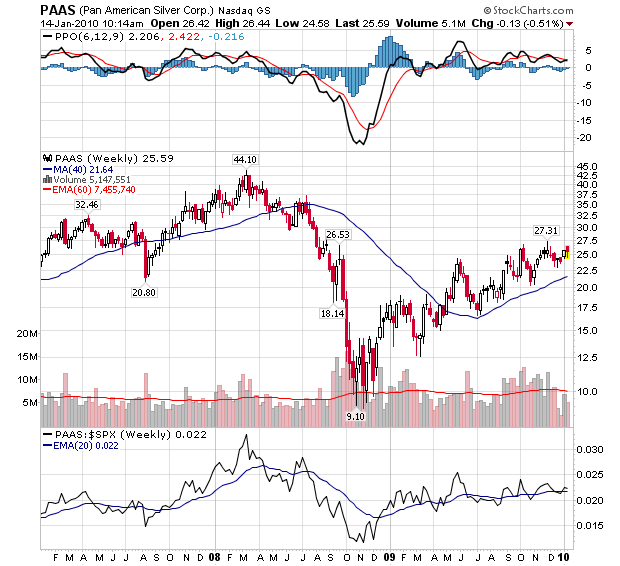
Pan American Silver Corporation (PAAS) – Initially we bought this stock for $18.00 and on the 23rd August we gave another BUY signal on PAAS when we said “We made a further purchase today at $24.10” giving us an average purchase price of $21.50. On January 31st, 2008 we sold about 50% of our shares for an average price of $36.65, locking in a profit of around 70.32%. On the 18th June 2008 we re-purchased PAAS shares for $31.06 and on 16 July 2008 we made another purchase at $36.53. PAAS has traded as low as $8.93 over the last year and was standing at $18.55 at our last update so some improvement has taken place as PAAS closed at $25.70 yesterday.
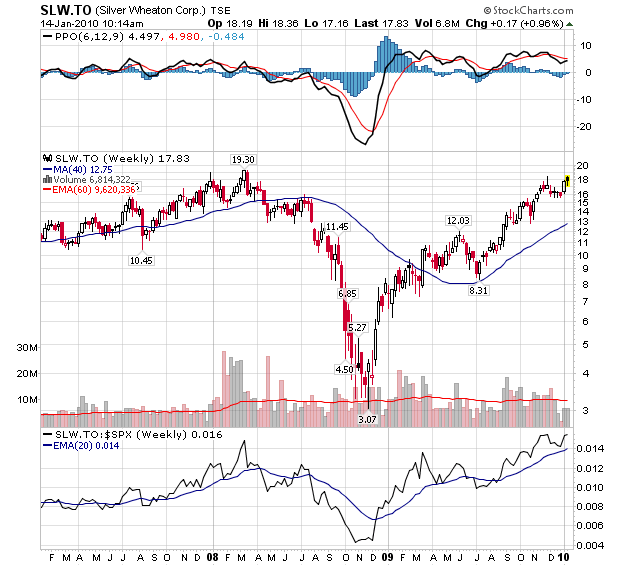
Silver Wheaton Corporation (SLW) – Originally bought for $9.41 and made another purchase on 15 July 2008 at $15.61 and a further purchase on 6 August 2008 at $11.43. SLW was trading at $8.52 back in September but thankfully closed at $17.40 yesterday.
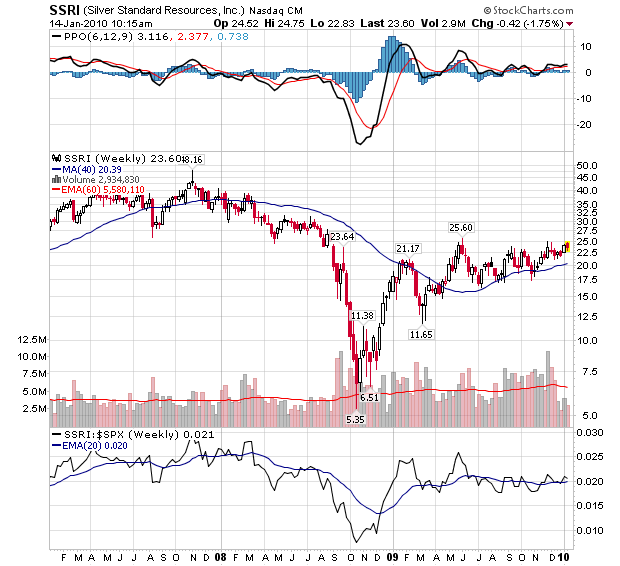
Silver Standard Resources Incorporated (SSRI) Initially we bought this stock for $19.98 and on the 20th August we gave another BUY signal when we wrote “we think Silver Standard is at a good level to buy at the moment and we bought today at $28.99” giving us an average purchase price of $24.48. On January 31st, 2008 we reduced our exposure by selling around 50% of SSRI for an average price of $34.82 locking in a profit of 42.22%. SSRI dropped to $7.99 during in the sell off but recovered well to trade at $19.16 last month and yesterday it closed at $23.72, a step in the right direction.
Eagle Plains Resources Limited (EPL) – We bought this stock for around $0.53, it has been down to $0.08 but closed at $0.24, at the last update, yesterday EPL closed at $0.19. Not good enough, we will now look for a suitable exit point.
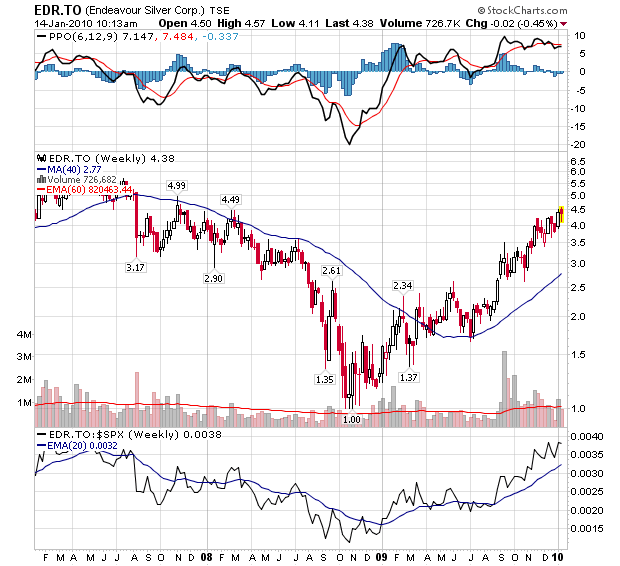
Endeavour Silver Corporation (EXK) – We initially bought Endeavour for $3.97 and on 7th December 2007 we bought more shares saying; “EXK is down from over $5.50 and as it has been beaten down so much we are signaling a BUY again on this stock and we made a further purchase bringing our average price to $4.10 per share as we doubled our position.” we secured EXK for $3.26 on the 2nd April 2008. Great results and the ability to do what they say they are going to do have propelled this stock northwards from $1.75 in September to close at $4.38 yesterday.
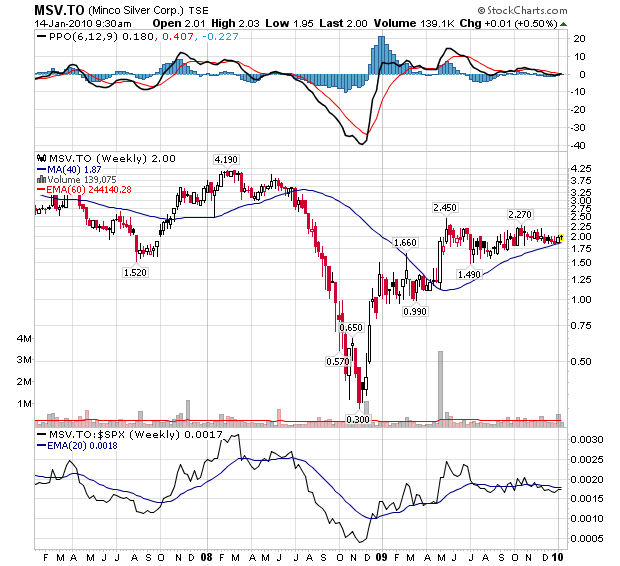
Minco Silver Corp (MSV) – Bought for $2.80 as a speculative move, it later dropped to trade at $0.40, which hit us hard, however it has been showing signs of recovery during and during the last update it traded at $2.00 closing yesterday at the same price of $2.00. However, it has made no progress and may go if performance does not improve.
The world remains full of financial turmoil, the outcome of which we expect to be the continuing demise of the dollar and an ever-increasing recognition of both silver and gold as the only place to be. Apart from precious metals we do not hold any other stocks as we are believe that this sector is about to boom.
Have a sparkling week.
All the best.
To stay updated on our market commentary, which gold stocks we are buying and why, please subscribe to The Gold Prices Newsletter, completely FREE of charge. Simply click here and enter your email address.
For those readers who are also interested in the silver bull market that is currently unfolding, you may want to subscribe to our Free Silver Prices Newsletter.
For those readers who are also interested in the nuclear power sector that is currently coming back to life, you may want to subscribe to our Free Uranium Stocks Newsletter.
-
I know Mike is a very solid investor and respect his opinions very much. So if he says pay attention to this or that - I will.
~ Dale G.
-
I've started managing my own investments so view Michael's site as a one-stop shop from which to get information and perspectives.
~ Dave E.
-
Michael offers easy reading, honest, common sense information that anyone can use in a practical manner.
~ der_al.
-
A sane voice in a scrambled investment world.
~ Ed R.
Inside Edge Pro Contributors

Greg Weldon

Josef Schachter

Tyler Bollhorn

Ryan Irvine

Paul Beattie

Martin Straith

Patrick Ceresna

Mark Leibovit

James Thorne

Victor Adair