
Daily Updates
Click HERE if you want to learn from some of the timeless advice from some of worlds best traders including the very successful Mark Leibovit.


![]()
Click HERE to hear Mark Leibovit and other masters forecast market risk and opportunity on January 22 – 23rd 2010 at the World Outlook Conference Vancouver.
Special offer from Mark Leibovit for Money Talks only: The intense analysis of Gold in the 10-12 page The VR Gold Letter is right now 75% off for the first month or $29.95 (regularly $125.00 a month). The weekly VR Gold Letter focuses on Gold and Gold shares.Go HERE and use the Money Talks promo code CBC12210
The Plunge Protection Is Doing Its Job!
My ‘Annual Forecast Model’ (VR Forecaster Report) is now posted on the VRtrader.com website and covers cyclical projections for the Dow Industrials, the TSX, Gold, Crude Oil, Ten Year Interest Rate Yields and the US Dollar Index. Subscribe today and insure getting your copy. The Model has been published since 1987 and has garnered a respectable following among traders and investors seeking an overall ‘timing’ tool for the major markets. Remember, there is no price too high for good information!
Stock Action Alert
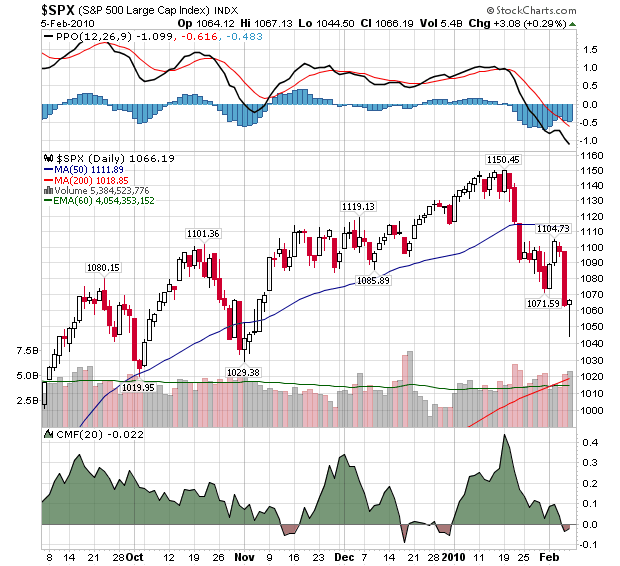
Remain in cash. Traders may wish to cover shorts for a likely bounce with a view to re-enter their short positions. I am anxious to get long if we begin to see broad-based Positive Volume Reversals (r). If we don’t see them, that doesn’t preclude a market rally, but I have less confidence in participating. I’ve been awaiting a mid-March buying opportunity.
Bond Action Alert
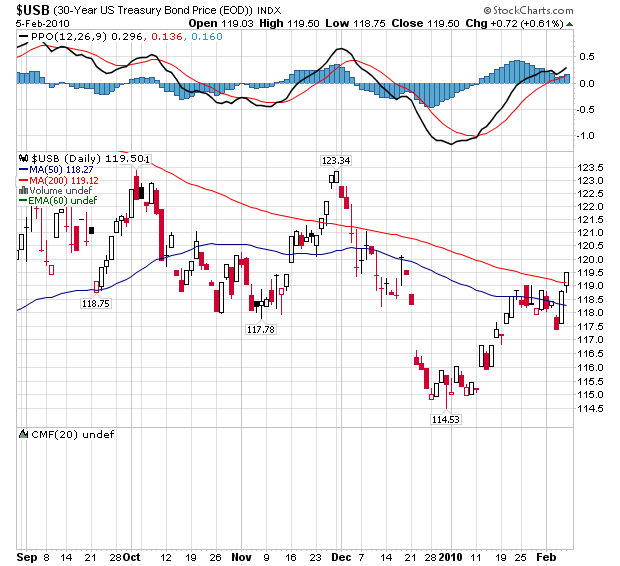
Treasuries rallied Friday as stocks fell and traders look for safety in the US government. The late day stock market rally was too late to push down Treasuries, though we might see Treasuries open down on Monday to compensate for the stock market’s late day move. The long bond future gained 23/32 to 119 16/32 and hit a two-month high of 119 18/32.
Recall, I wrote this past week that “once stocks nosedive we should see a flight into saftey into the bonds and a decline in interest rates.” Bonds should pull back here if stocks extend last week’s rally.
The weekly VR Gold Letter focuses on Gold and Gold shares. The letter is available to Platinum subscribers for only an additional $50 per month and to Silver subscribers for only $70 per month. Email me at mark.vrtrader@gmail.com.
Special offer from Mark Leibovit for Money Talks only: The intense analysis of Gold in the 10-12 page The VR Gold Letter is right now 75% off for the first month or $29.95 (regularly $125.00 a month). Go HERE and use the Money Talks promo code CBC12210
Mark Leibovit’s forecast at the World Outlook Conference Jan 22, 23rd available HERE.
![]()
Click HERE if you want to learn from some of the timeless advice from some of worlds best traders including the very successful Tyler Bollhorn.
Marks VRTrader Silver Newletter covers Stock, TSE Stocks, Bonds, Gold, Base Metals, Uranium, Oil and the US Dollar.
More kudos – Mark Leibovit was named the #1 Intermediate Market Timer for the 10 year period ending in 2007; the #1 Intermediate Market Timer for the 3 year period ending in 2007; the #1 Intermediate Market Timer for the 8 year period ending in 2007; and the #8 Intermediate Market Timer for the 5 year period ending in 2007. NO OTHER ANALYST SURVEYED APPEARED IN ALL FOUR CATEGORIES FOR INTERMEDIATE MARKET TIMING AS PUBLISHED IN TIMER DIGEST JANUARY 28, 2008!
For a trial Subscription of The VR Silver Newsletter covering Stocks, Bonds, Gold, US Dollar, Oil CLICK HERE
The VR Gold Letter is available to Platinum subscribers for only an additional $20 per month, while for Silver subscribers the price is only an additional $70.00 per month. Prices are going up very shortl, so act now! Separately, the VR Gold Letter retails for $1500 a year! The VR Gold Letter is published WEEKLY. It is 10 to 16 pages jam-packed with commentary and charts. Please call or email us right away. Tel: 928-282-1275. Email: mark.vrtrader@gmail.com .
The Money Talks Trading Challenge
Stockscores.com Perspectives for the week ending February 21, 2010
In this week’s issue:
- Weekly Commentary
- Strategy of the Week
- Stocks That Meet The Featured Strategy
![]()
I want to give you a little bit of incentive to read this week’s commentary.
You could win attendance to one of my upcoming Stockscores three day live trading classes. Or how about five ounces of gold, a 1.22 carat emerald, 75 ounces of silver or a $28,000 fishing trip provided by West Coast Fishing Lodge and VIH Helicopters?
Stockscores has partnered with the Money Talks radio show and Disnat to present the Money Talks Trading Challenge. Using the new Stockscores Trading Desk, this trading game is a way for you to improve your trading skills while competing for valuable prizes. And all proceeds from the game go to benefit the Special Olympics!
Just be entering, you will be eligible for a random draw that gives away a seat at one of my three-day trading classes in Toronto, Calgary or Vancouver. We do this draw on Mar 13th so make sure you sign up for the game soon.
For the other prizes, you will have to prove your trading prowess, here is how the game works.
Very simply, you earn points in this game based on the performance of the trades that you make. This is not a portfolio challenge so there is no set amount of cash to work with. You buy and short sell stocks and earn a TradeScore for each trade you make.
You are ranked in the game based on your average TradeScore. The ranking is based on a minimum of 10 trades so if you have done less than 10 trades, your ranking will suffer.


How are the TradeScores calculated? The calculation is based on three factors important to determining your trading success:
- Percentage Gain/Loss – how much the stock goes up or down from the time you enter till you exit. A higher, positive gain is better.
- Hold Period – how many days you hold the position. Since time is money, it is better to get a good return in a short time period.
- Reward for Risk – how much capital you risked to earn the return you achieved.
- Risk Multiple – you can choose to put more risk on some trades than others up to a maximum of give times your risk tolerance.
The Reward for Risk component requires that we know the downside risk you are willing to take on any trade. This is based on where you place a stop loss point when you make your trade. If you buy a stock at $10 with a stop loss point at $9, your risk is $1. If you end up exiting that trade at $12, you have earned $2 of reward for $1 of risk, or a 2 for 1 reward for risk ratio. If you get stopped out at $9, you have earned a reward for risk ratio of minus 1.
Every trade requires you enter a stop loss order so that we can calculate this Reward for Risk ratio. With a buy order, you can choose to set your stop as low as $0 but that will hurt your TradeScore since you will end up getting a low Reward for Risk ratio. The trader that buys a stock at $10 with a stop loss at $0 and exits at $12 has $10 of risk for $2 of gain for a 0.2 Reward for Risk Ratio.
A higher Reward for Risk ratio will improve your TradeScore. We calculate the TradeScore based on the following formula:
Absolute Value of the Percentage Gain or Loss times 252/Hold Period in Day (with a minimum of 5 days) times Reward Score times 100 times the Risk Multiple.
The Reward Score ranges from – 8 to + 8 and is awarded based on the Reward for Risk ratio. It is explained in the Measuring Performance area of the How to Play document which you should read here.
Let’s show how the TradeScore is calculated with an example.
If you enter a stock at $5 with a stop loss at $4.50 with a Risk Multiple of 2 and 8 days later you exit that stock at $7.20, what TradeScore would you earn?
Your risk is $0.50 and your reward is $2.20 making your Reward for Risk ratio 4.40. This gives you a Reward Score of 3.
The percentage gain on the trade is 44% ($2.20 gain on a $5 stock)
The hold period is 8 days.
The Risk Multiple is 2.
So, the TradeScore is .44 times 252/8 times 3 times 100 times 2 = 8316
This is an excellent TradeScore because the trade earned a very high percentage return in a very short time and also had a good reward for risk ratio.
What if the trade had been exited at $6 instead of $7.20? Then the percentage gain would only be 20% and the reward for risk 2, giving a TradeScore of 2520.
Of course, losing money on a trade will give a negative TradeScore and that will hurt the overall ranking. When we calculate your average TradeScore, we add up all Tradescores from your individual trades and divide by the number of trades you have made, using a minimum of 10 for the average.
At the end of the game, the people with the highest average TradeScores will win the prizes.
Why play a game like this? There are many reasons, here are some that I can think of:
- it is better to learn good trading techniques in a game than using real money. If you can do well in the game then you may be ready to trade the real market.
- playing in the game allows you to see what other players are doing and you may learn something from those leading in the game.
- be part of a community of traders. As the number of players grows there will be a community of traders to share trading ideas with. Any time you make a trade, you can post a comment on why you are doing the trade and others who are trading the same stock can do the same. You can only make a comment on a stock if you have a position in it, allowing for accountability on the trades you make.
- it is fun!
- it is for a good cause! The proceeds from your $19 entry fee goes to the Special Olympics.
Registering to Play
Signing up to play the Money Talks Trading Challenge is easy. Simply click on this link to get started. Then click on the Register Here button near the top of the page.
You will be prompted to set up an account for the Challenge. If you already have a Stockscores.com account, you will go through a process to convert your Stockscores Username to your email address. You must go through this process before you can log in to the Challenge using your email address. From that point on, you will log in to the Challenge and Stockscores.com using your email address as your Username.
I recommend you go through the How To Play document that can be found on the Trading Challenge tab once your account is set up. There are a few videos in that document to help get you started.
While it would be great to win a few thousand dollars worth of Gold for winning the game, the benefit of improving your trading skills could have a far greater impact on your long term success in the market. We want to help make you a better trader so you can pull more profits out of the market, the Money Talks Trading Challenge is a good way to get started!
![]()
Let’s look at how the TradeScores would be calculated on two trades from the Stockscores Daily Newsletter. We’ll compare a winner and a loser. What you should notice is that the TradeScore for the winner is very large but the loser relatively small. This is because the use of stop loss points limits the downside risk while patience with a winner allows the profits to grow.
![]()
1. MSPD
MSPD was selected on July 29th at $2.69. The stop loss was at $2.07 so the risk on the trade was $0.62. On Friday, about 155 trading days later, the stock closed at $8.47. That is a 215% gain. Still no reason to exit, but because the trend has gone parabolic, it should be watched closely for an exit signal. The resulting TradeScores, assuming a risk multiple of 1, is 2800.
2. CAT
CAT was featured on January 11th at $64.13. Seven days later it was stopped out at $56.99 for an 11% loss. Since it was stopped out at the original stop loss point, it earned a minus 1 reward for risk. The resulting TradeScore is about 400.
Click HERE if you want to learn from some of the timeless advice from some of worlds best traders including the very successful Tyler Bollhorn.
Tyler Bollhorn started trading the stock market with $3,000 in capital, some borrowed from his credit card, when he was just 19 years old. As he worked through the Business program at the University of Calgary, he constantly followed the market and traded stocks. Upon graduation, he could not shake his addiction to the market, and so he continued to trade and study the market by day, while working as a DJ at night. From his 600 square foot basement suite that he shared with his brother, Mr. Bollhorn pursued his dream of making his living buying and selling stocks.
Slowly, he began to learn how the market works, and more importantly, how to consistently make money from it. He realized that the stock market is not fair, and that a small group of people make most of the money while the general public suffers. Eventually, he found some of the key ingredients to success, and turned $30,000 in to half a million dollars in only 3 months. His career as a stock trader had finally flourished.
Much of Mr Bollhorn’s work was pioneering, so he had to create his own tools to identify opportunities. With a vision of making the research process simpler and more effective, he created the Stockscores Approach to trading, and partnered with Stockgroup in the creation of the Stockscores.com web site. He found that he enjoyed teaching others how the market works almost as much as trading it, and he has since taught hundreds of traders how to apply the Stockscores Approach to the market.
References
Get the Stockscore on any of over 20,000 North American stocks.
Background on the theories used by Stockscores.
Strategies that can help you find new opportunities.
Scan the market using extensive filter criteria.
Build a portfolio of stocks and view a slide show of their charts.
See which sectors are leading the market, and their components.
Disclaimer
This is not an investment advisory, and should not be used to make investment decisions. Information in Stockscores Perspectives is often opinionated and should be considered for information purposes only. No stock exchange anywhere has approved or disapproved of the information contained herein. There is no express or implied solicitation to buy or sell securities. The writers and editors of Perspectives may have positions in the stocks discussed above and may trade in the stocks mentioned. Don’t consider buying or selling any stock without conducting your own due diligence.
It’s suddenly turned into a bit of a horror show, hasn’t it? It seems as if the combined weight of Greek contagion, Chinese tightening, political risk, and so/so economic data has finally managed to break the camel’s back, and Macro Man’s Bloomberg screens are a sea of red this morning. Still, the market environment is quite tame by the standards of the past couple of years, so it’s hard to envisage anyone outside of last summer’s graduate trainee intake (if there was one) panicking too badly.
Indeed, there is still quite a bit of differentiation out there amongst popular trades and 2009’s stellar performers. The “horror show” analogy can be extended, as it struck Macro Man this morning that we can probably classify trades along the lines of the US film rating rubric. Consider:
…..read more HERE
Market Buzz – Debt Back in Focus in Volatile Week
For Toronto’s main index, this past week was anything if not uninteresting. The TSX began on a solid note, posting two strong days of gains only to fall off a cliff on Thursday, losing 2.3 per cent and finally touching a three month low on Friday before rallying late on what appeared to be a short-squeeze and ending up on the day and virtually flat for the week.
Thursday was the day to remember as the TSX notched its steepest percentage drop since early October as investor confidence was shaken by intensifying concerns about sovereign debt in some euro zone countries. Investors rallied to the relative “safety” of U.S. Treasury bonds and the greenback, which also took flight on lackluster U.S. jobs data.
For investors, the debt issue appears to be back in focus. As we have stated for two year now, the “Great De-leveraging” that must occur is not something that can happen overnight and will take years, if not decades, to get truly under control. As the markets rebounded from thoughts of financial Armageddon last March, this issue was largely pushed aside, but as valuations creep higher, it remains the elephant in the room and a long-term challenge within the U.S. and many European countries.
This is not to say there will not be growth opportunities, but investors have to set their expectations for growth more realistically in 2010 and moving forward, as countries, corporations, and citizens tackle debt levels that got out of control in the excess of the past couple decades.
Growth opportunities will present themselves, but we must be mindful of the risks and use a patient, disciplined approach.
This coming week, KeyStone Financial (www.keystocks.com) will release our annual Micro-Cap Survey for 2010. The survey is a bonus report for our valued Level II & Level III clients and is also available for purchase ($109) for non-subscribers. The Survey begins with 500 Canadian companies with market caps of under 75 million and, based on several criteria including profitability and growth prospects, is narrowed down to 50 select micro-caps which are compiled in a statistical fundamental analysis. From here, we select 5-7 individual stocks for which individual reports are released on with specific recommendations. The companies are also added to our model Micro-Cap Portfolio.
Additionally, we will be updating Migao Corporation following the release of the company’s fiscal 2010 third quarter financial results for the period ending Dec. 31, 2009. The results are due out Thursday after market close and will be followed by a Friday conference call.
Finally, early last week, MOSAID Technologies Incorporated (MSD:TSX), from our Small-Cap Universe, announced that it had signed a worldwide, non-exclusive wireless patent license agreement with Sony Corporation of Japan.
The deal is a non-exclusive wireless patent license agreement granting Sony a fixed-payment term license under its wireless technology patents, covering all Sony Wi-Fi enabled products. This is the first time the company signed any company of size in the gaming console space. There are a couple of heavyweights in the gaming space and there is more room for additional players to be signed here. Having a name like Sony licensing the company’s patents is always a positive, but the impact in terms of revenues at this point is difficult to assess until management provides some sort of further clarification.
Looniversity – Don’t Get Burned by the Burn Rate
Burn rate refers to the amount of money a company spends from month to month (money burnt) in order to survive. Thus, a burn rate of $100,000 would mean the company spends $100,000 a month above any incoming cash flow to sustain its business.
Keeping a sharp eye on cash flow, which is a company’s life-line, can guard against holding a worthless share certificate. When a company’s cash payments exceed its cash receipts, the company’s cash flow is negative. During a bull market, unprofitable companies can finance cash burn by issuing new shares and investors are more than happy to cover cash burn – look no further than the junior mining boom we recently saw end. But when a bear hits, companies can get stuck living on their bank balances or scrounging for unfavorable finance terms and if the cash dries up, go bust. For investors, it’s important to follow a company’s available cash, evaluating how long it will last and what will happen when it runs out.
Particularly in times of turmoil, pay close attention to cash on hand (limited debt as well) and examine the company’s cash burn rate. If a company burns cash too fast, it runs the risk of going out of business.
Put it to Us?
Q. On BNN and CNBC, I keep hearing market gurus use the term “accumulation” or “accumulate” in what seems (to me at least) like different meanings. What’s up with that?
– Phil Walters; Edmonton, Alberta
A. Well Phil, like a massive snowball gaining momentum down a slope, the term accumulation seems to be “accumulating” more and more connotations within the financial arena – leaving the average investor “a snowball’s chance in hell” at understanding its true meaning. Okay, this may be stretching it a little, but its varied usage can be confusing.
There are three basic references to accumulation in the investment world.
In the context of corporate finance, it refers to profits that are added to the capital base of the company rather than paid out as dividends.
In the context of investments, it refers to the purchase by an institutional broker (or big investor) of a large number of shares in a company over a period of time in order to avoid pushing the price up.
In the context of mutual funds, it refers to the regular investing of a fixed amount while reinvesting dividends and capital gains.
KeyStone’s Latest Reports Section
* Back to the “safe haven” trades…
* The dollar hammers the euro!
* It’s a Jobs Jamboree Friday!
* The SNB sells francs…
And Now… Today’s Pfennig!
Weekly Job Losses Continue To Pile Up!
Good day… And a Happy Friday to one and all! It’s a draggin’ the line Friday for me, but I’ll make every attempt to turn it into a Fantastico Friday for sure! The Big Stock Sell off that I’ve warned about since probably June of last year, looks like it has finally arrived… Bringing with it, my biggest fears, that the link between all the risk assets, had not been broken completely, and this link has turned into a bloodletting on currencies and commodities…
OK… So I got that out of the way, front and center this morning! You know… Ever since I began writing about a Big stock sell off, I told you that, should the link remain in place, and the currencies and commodities have adverse reactions, then we would come to the fork in the road… The people that bought currencies and commodities to keep up with their neighbors, in hopes of being able to brag about their returns at the next bar-b-que, will panic and sell, making the sell off even worse… The people that bought these risk assets for the “right reason”, which was to diversify their investment portfolios, so that not all their investments were denominated in dollars, and to provide a hedge against further potential losses by the dollar, and to reduce their overall risk for their investment portfolio, will just batten down the hatches, hunker down, and ride this out… And… If any thing, look to pick up more of these risk assets at cheaper levels as we go along…
So… I was at the booth here at the Orlando Money Show, and a fellow walked up to me and said, “Gold is down $45, what do you have to say about that?” I said, “WOW!” sounds like a bad day a Red Rock for Gold, did you buy some at $45 cheaper than yesterday’s price?” He was stunned that I came back like that… For he was simply trying to rub it in my face!
Well… What happened yesterday to cause this bloodletting in stocks, currencies and commodities? Well, it just so happens to be the Weekly Initial Jobless Claims that first scared the bejeebers out of the risk takers… The Weekly Initial Jobless Claims showed that layoffs, which every analyst (except me!) was thinking were getting better, were picking up in January, with last week’s total at 480,000! This total got people/ investors thinking that the rose colored glasses they had been wearing toward the U.S. economy had to be stripped off of them!
Now… Fundamentally speaking… Had the currencies and commodities gotten back to fundamentals, and broken that chain that existed in the risk assets with stocks since collapse of Lehman Brothers, then yesterday’s data would have deep sixed the dollar, and sent the currencies and commodities soaring higher… Instead we had this to deal with! Speaking of breaking that chain… Ever since I typed that this morning, I can’t get that old Fleetwood Mac song out of my head… And if you don’t love me know, you will never love me again, I can still hear you saying you will never break the chain… OK, there, I got that out of my system, and I can go onto the task at hand now!
Did you see where the Bureau of Labor Statistics (BLS) announced yesterday that they would have to make a one-time adjustment to the labor statistics subtracting 824,000 jobs from the totals that they had added last year in error? You know, the ghost jobs that I had labeled them years ago… 824,000 jobs… I’m sure that announcement had a lot to do with the bloodletting yesterday also!
All this, and today, we’ll see the color of the January Jobs Jamboree! (WOW! My English/ poetry teacher would be proud of me there!) Seriously though… The Jobs Jamboree will print this morning, and is expected to show more job losses to follow up last month’s 85,000 job losses… Of course I showed you last month that the “somewhat real figure” was 144,000 job losses, but we won’t let that get in the way of the BLS cooking the books!
I was talking to some wonderful, intelligent people last night about the Jobs Jamboree, and explained that the markets were always too dippy about the “number of jobs created”, for those figures never told you if the jobs created were high paying jobs, or low paying jobs… How could you make a call for the economy without know that?
So… I always said that it mattered not the jobs created, but more the Average Hourly Earnings, and the Average Hours Worked… This is the data that the market participants should be really taking their direction from!
Enough on these job figures for crying out loud, Chuck! Can’t you think of something else to write about? Why, yes, I do believe I can!
Well… It looks like the Swiss National Bank (SNB) took the weaker currency price for the Swiss franc, and decided to take a double barrel shot at the franc, buy selling it (intervening) overnight…
Shame, Shame on the SNB! Selling your own currency! I had just highlighted the franc as one of my fave currencies yesterday, only to read about this intervention by the SNB overnight! UGH! Well, I’m reminded of a saying that can be used here… I used to work with a guy in the brokerage house that I began my investment career, (Stifel Nicolaus) that would tell me all the time about a stock… “Hey, if you liked the stock at $50, you’re going to love it at $45!”…
The debt problems of the PIGS (Portugal, Italy, Greece and Spain) took another chunk out of the euro overnight… Quite frankly, this is beginning to sound like a broken record… Look, Greece is but 2% of the European Union… What percent is California to the U.S.? Well, I don’t really know, but what I do know is that California is the 8th largest economy in the world, so, it’s percentage piece to the U.S. would be much higher than 2%!
European Central Bank President, Trichet, tried his best yesterday, to convince the markets that euro region should not be punished for Greece’s debt problems… And in my opinion, he’s right! But… The markets will do what the markets will do, no matter what central bankers say…
I’m really beginning to grow tired of this debt talk and the euro taking hits over and over again because of it…
Of course, as I told the crowd yesterday in my presentation… “yes, the dollar can rally, and will rally from time to time, think of it as circuit breakers, to keep the dollar from going into a tailspin on the slippery slope down.”
OK… Enough on that too!
In Australia overnight… The Reserve Bank of Australia (RBA), who just the other day, surprised the markets and left their interest rates unchanged, made upward revisions to both GDP and CPI, and maintained that their internal interest rate, which will continue higher in 2010 to 5%…
Even this rosy picture, couldn’t stop the selling… So… I have to think that this is all panic driven, and profit taking, and then more panic driven…
Then there was this… Yesterday, I saw that former Bank of America Chief, Ken Lewis was being sued by New York Attorney General Andrew Cuomo for defrauding investors and the government when buying Merrill Lynch… I think the gloves come off here folks… Under oath, I think Lewis will point to Paulson and Bernanke and say they made him do it, and then those two will have to answer questions under oath… Ahhh… We finally get to the cheese that binds here, eh?
To recap… The currencies and commodities have not broken the chain to stocks and are getting hammered as the BIG stock sell off that I’ve feared since June of last year, appears to be taking place, finally.. Increased jobs layoffs was the keymaster here, and we will get further info on the labor picture when the January Jobs Jamboree numbers get printed today…
Currencies today 2/5/10: American Style: A$ .8640, kiwi .69, C$ .9285, euro 1.3690, sterling 1.57, Swiss .9320, European Style: rand 7.7075, krone 6, SEK 7.4635, forint 200.40, zloty 2.9920, koruna 19.16, RUB 30.49, yen 89.40, sing 1.4225, HKD 7.7715, INR 46.56, China 6.8265, pesos 13.15, BRL 1.8845, dollar index 80.28, Oil $71.65, 10-year 3.58%, Silver $15.13, and Gold… $1,055.50
That’s it for today… A very long day yesterday will be followed up by yet another long day today, but hey! That’s what I came here to do! I think my presentation went well yesterday… The Big Boss, Frank Trotter, is speaking today, and then I finish up with a presentation tomorrow, that I’ve got to get working on today! I met two new faces to EverBank yesterday… First, Meg, in our marketing dept, and then Colleen that’s with our new advertising agency… Colleen was full of energy toward the Pfennig, so, I’ve got that going for me, eh? Well… Sunday is Super Bowl Sunday! I think that the two best teams are in the game, which should provide us a good game… While I would like to see New Orleans win, I wouldn’t ever bet against Peyton Manning, and it won’t be a big deal to me should the Colts win… So… I don’t have a dog in this hunt this year, which should make the viewing more enjoyable! Of course most people get all lathered up about the Super Bowl commercials.. I feel as though they’ve been a real let-down the past couple of years, so hopefully, that will change this year. So… Have fun on Sunday, and the best of luck to each team! Now, I’m still draggin’ the line a bit, but I’m warming up to a Fantastico Friday, and hope you do too!
Chuck Butler
President
EverBank World Markets
1-800-926-4922
1-314-647-3837
-
I know Mike is a very solid investor and respect his opinions very much. So if he says pay attention to this or that - I will.
~ Dale G.
-
I've started managing my own investments so view Michael's site as a one-stop shop from which to get information and perspectives.
~ Dave E.
-
Michael offers easy reading, honest, common sense information that anyone can use in a practical manner.
~ der_al.
-
A sane voice in a scrambled investment world.
~ Ed R.
Inside Edge Pro Contributors

Greg Weldon

Josef Schachter

Tyler Bollhorn

Ryan Irvine

Paul Beattie

Martin Straith

Patrick Ceresna

Mark Leibovit

James Thorne

Victor Adair