
Daily Updates
Richard Russell has made his subscribers fortunes. One of the best values anywhere in the financial world at only a $300 subscription to get his DAILY report for a year. HERE to subscribe. Amongst his achievements Richard was in cash before the 2008/2009 Crash and he has been Bullish Gold since below $300
Ed Note: Richard Russell is bullish Silver and holds one of the largest single positions he has held since the 1950’s in the precious metals.
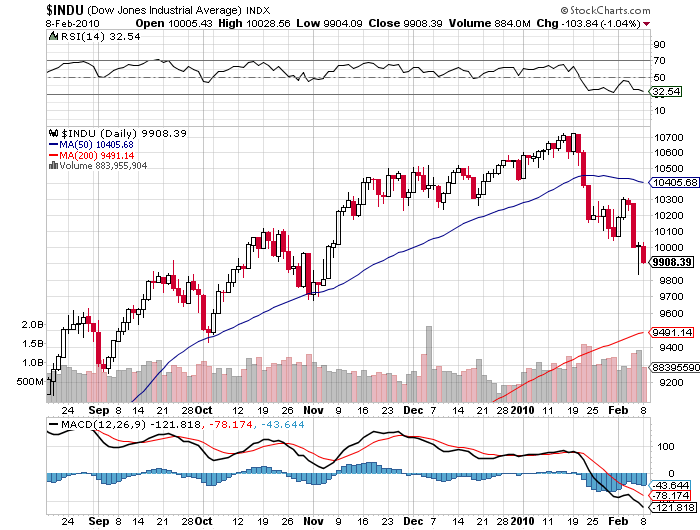
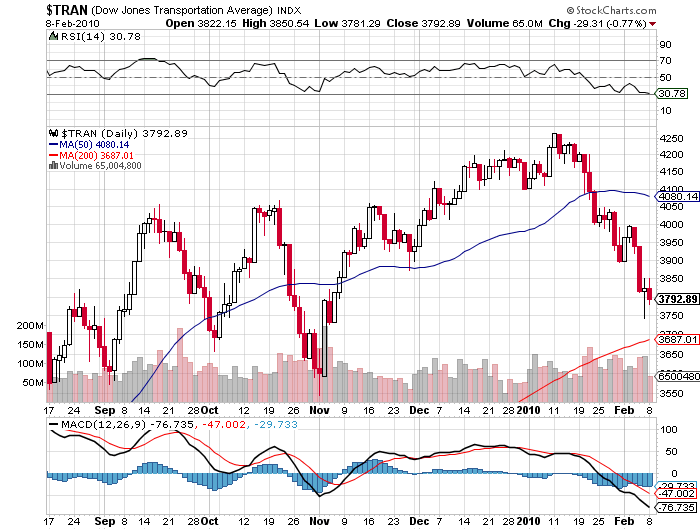
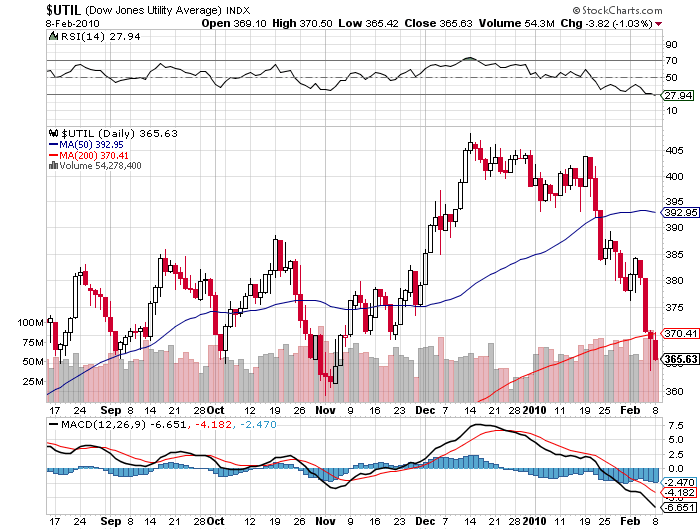
(Yesterday’s action) – Tack on another nasty day to the record. The Dow closed on its ass, down over 100 points and at the low of the day. Transports and Utilities were down in step with the Dow. My PTI was down a full 8 to 6009, MA was 5997, which means that my PTI remains bullish by a thin margin of only 12 points. If my PTI turns bearish, I fear the market will turn really ugly. If that happens, expect US consumers to pull in their horns even further. Bear markets and bad news feed on each other. Ironically and perhaps tragically, the sinking stock market is occurring in the face of optimistic news, mostly emanating from the administration which is either lying or clueless.
Down volume on the NYSE was 78% of up + down volume. Last Thursday was a 90% down-day, and the fact that the market failed to bounce after that I take as bearish.
Data to Monday

As for my Big Three, the Dollar Index was down, bonds were lower and Apr. gold was up. ABX was up 1.28 to 34.57. NEM was up 1.82 to 44.41.
Another warning, please be out of common stocks and this does not include gold shares. I like NEM, ABX, AEM. Remember my rule — our job now is to lose as little money as possible. And keep your day job if you have one.
(Ed Note: Russell’s PTI – “The PTI is my proprietary composite of 8 items, each one dealing strictly with market action. So no subjective considerations, no guessing, no adjusting — these 8 items are based on actual daily market action. I’ve been running the PTI daily since 1971. The PTI monitors the sub-structure of the NYSE. I liken it to the water in a bathtub. The Nasdaq (the soap) can bounce up and down all it wants, but it’s the level in the bathtub that tells us what the great primary trend is doing. The PTI is the level of the water in the tub.”
The 85 yr. old writes a market comment daily since the internet age began. In recent years, he began strongly advocated buying gold coins in the late 1990’s below $300. His position before the recent crash was cash and gold. There is little in markets he has not seen. Mr. Russell gained wide recognition via a series of over 30 Dow Theory and technical articles that he wrote for Barron’s during the late-’50s through the ’90s. Russell was the first (in 1960) to recommend gold stocks. He called the top of the 1949-’66 bull market. And almost to the day he called the bottom of the great 1972-’74 bear market, and the beginning of the great bull market which started in December 1974.
“There is no immunity now from the size of funds seeking to speculate or manipulate markets. This type of money is attacking the debt of the weaker euro states by intention or coincidence. Their success in the Iceland situation was only the first chapter of a multi chapter play.” – Jim Sinclair
The Bi-Polar Moving Bretton Woods Meetings
1. Bretton Woods was folded.
2. The floating exchange rate system is about to be folded.
3. By default or design we are going to a one-world currency and a one-world central bank of central banks.
4. For Portugal, Ireland, Italy, Greece or Spain to break off from the euro would be an expansion of the floating exchange rate system under present conditions.
5. There are presently 3 major currencies. That is the US dollar, the euro and gold.
6. The SDR was an attempt to form a single reserve currency that never took flight.
7. The SDR is an accounting unit made up of an index of currencies much like the USDX.
There is no immunity now from the size of funds seeking to speculate or manipulate markets. This type of money is attacking the debt of the weaker euro states by intention or coincidence. Their success in the Iceland situation was only the first chapter of a multi chapter play.
Central bankers fear that this type of action, most certainly if it is as successful as it was on Iceland, succeeding against the weaker euro states could easily attack the present functional reserve currencies, the US dollar and the euro.
There is an implicit fear that if the ECB refuses to or cannot sustain the debt of Portugal, Ireland, Italy, Greece and Spain the next to fall will be both the US dollar and the euro.
The states of the US are no different, in form or short opportunity, than weak members of the euro. Already major money is short California, New York and Pennsylvania debt. A pounding of state debt is as easy as the pounding of the weaker members of the euro.
Attack of a currency is primarily an attack of the debt representing that currency.
To read the article in full click HERE.
Quotable
“Markets are constantly in a state of uncertainty and flux and money is made by discounting the obvious and betting on the unexpected”. – George Soros
FX Trading: Where are we? Our best guess!
Long-time readers know we are big fans of the boom-bust theory of price action, as first I saw articulated by George Soros back in 1987 in his book, Alchemy of Finance. (It is by the way the same time I learned of Karl Popper and the black swan; and name our firm accordingly, back in 2003.)
We use the boom-bust construct to help us understand better, but never with anything approaching perfect knowledge (if one can ever approach such a thing), where we might be in the current cycle regarding the dollar.
A visual of the boom-bust looks like this:
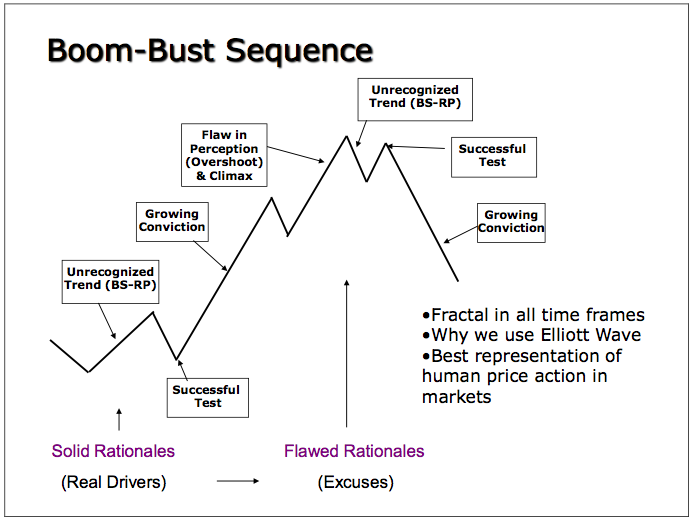
…..read more starting on page 2 HERE.
HOW TO INVEST AROUND A US DOLLAR RALLY
This massive reduction in risk appetite has triggered a flight to safety and liquidity, which in turn means the USD, has been a major beneficiary from all this uncertainty. On a trade-weighed basis, the greenback has firmed to seven month highs, and this also has implications for how to be positioned in other asset classes.
For example, this is the primary reason why gold has succumbed — selling by hedge funds closing out long positions and outflows in ETFs as well; though the yellow metal has hung in well relative to other commodities and is still range- trading in most other currencies.
Copper, meanwhile, sank 6.5% last week and on heavy trading volumes and crude oil broke below its 200-day moving average. We seem to recall warning that the U.S. dollar had moved to a huge oversold level late in 2009 and to extend a countertrend rally that could cause a short-term reversal in the basic materials complex — where we are still secular bulls. But nothing moves in a straight line and this is more than just a countertrend rally in the greenback — having broken all its major averages in recent weeks. Be positioned accordingly. Since the onset of the credit crisis in 2007, there have seen three occasions when a surge in risk aversion caused a period of U.S. dollar strength on flight-to- safety trades — July 15, 2008 to September 11 2008 (around the GSEs);
September 22, 2008 to November 21, 2008 (post-Lehman financial collapse) and then from December 17, 2008 to March 5, 2009 (the final leg down in the financials). Hereis what happened, on average, during these dollar-rally episodes — ultra-defensive strategies and heightened volatility:
• The DXY (U.S. dollar index) rallied an average of 12.3%.
• During these episodes, the Canadian dollar sank 11% against the U.S. dollar, but was only down 1.9% against a basket of non-U.S. currencies.
• The S&P 500 corrected an average of 18.5%. Underperforming S&P equity sectors included materials, energy, industrials and financials. Outperformers included utilities, staples, health care, tech and telecom.
• Despite the downdraft in commodities, the TSX performed in line with the S&P — losing 18%.
• In the TSX sectors, the winners and losers were different than in the U.S.A.:Financials and industrials actually outperformed. Only materials and energy seriously dragged down the Canadian market. As in the U.S., staples, health care, utilities, tech and telecom outperformed. Outside of resources, the TSX sectors actually outperformed their S&P comparable.
• Still, it pays to note that we are talking about “relative” performance. Every equity sector on both sides of the border was down during these periods.
• The oil price, on average, fell 26%, and gold was off an average of 11%. The CRB index corrected an average of 22%.
• The VIX index surge an average of 34% during these U.S. dollar-rally episodes.
• We saw a bull steepening in the bond market — 2-year T-note yields plunge an average of 36bps while 10-year T-note yields dipped 8bps.
• Baa corporate spreads widened an average of 54bps; and by 268bps for high- yield bonds.
…..read more HERE.
…..read more HERE.
Gold & SP500 Psychology: They Bail, We Buy
Understanding market psychology is crucial for a trader’s success. But so many people get caught up in the daily market volatility, media coverage and “noise” of the trading environment, it’s almost impossible to not think and trade in agreement with the majority of traders.
However, effective technical analysis allows us to use trends, patterns and other indicators to evaluate the market’s current psychological state. Fortunately, this analysis can both enable us to independently forecast whether the market is heading in an upward or downward trend and do so against the grain of the majority.
It takes a disciplined trader to be able to watch and listen to the market doing one thing, filter out the noise, then do the opposite – all in a controlled manor. To this day I still find myself fighting the herd mentality at times and that is when I step away from the computer and regroup.
I have a simple rule that has saved me thousands over the years. I would rather miss a trade and learn what caused me to get confused, then to take a loss.
Rule # 1 – When in Doubt, Stay Out!
There are two types of traders:
……read more HERE.
How to Trade IntraDay Gold and SP500
Last week was an incredible week for trading the intraday charts. With rising volume and volatility prices began to move up or down for extended periods of time allowing traders to profit from these powerful short term price swings.
During times like these traders using the daily charts for their guide found the market very difficult to time because of the whipsaw action each day. In this case, it is definitely best to stay clear of the market until the dust settles. But for a trader who watches the intraday charts, this is when serious money is made on a daily and consistent basis.
Most traders avoid using intraday charts because they either:
1. Think it’s day trading and do not want to sit in front of the computer all day
2. Do not understand how to trade in these “intraday” time frames.
Intraday trading is one of the most over looked yet most profitable trading strategies, in my opinion. One of the reasons I like/love it so much is the fact that it provides high probability setups on a weekly basis and trades generally last 2 -36 hours. Also, this strategy carries very low risk simply because you are in cash most of the time, putting your money to work only when high probability setups form.
If you are an active trader you should have been making money hand over fist last week. Below are close up shots of my charts:
My eSignal Trading Platform
…..read more HERE.
-
I know Mike is a very solid investor and respect his opinions very much. So if he says pay attention to this or that - I will.
~ Dale G.
-
I've started managing my own investments so view Michael's site as a one-stop shop from which to get information and perspectives.
~ Dave E.
-
Michael offers easy reading, honest, common sense information that anyone can use in a practical manner.
~ der_al.
-
A sane voice in a scrambled investment world.
~ Ed R.
Inside Edge Pro Contributors

Greg Weldon

Josef Schachter

Tyler Bollhorn

Ryan Irvine

Paul Beattie

Martin Straith

Patrick Ceresna

Mark Leibovit

James Thorne

Victor Adair