
Daily Updates
Quotable
“Man’s life is a continuous whole: for good or evil, every day, year and decade of his life holds the sum of all the days behind him. He can alter his choices, he is free to change the direction of his course, he is even free, in many cases, to atone for the consequences of his past – but he is not free to escape them, nor to live his life with impunity on the range of the moment, like an animal, a playboy or a thug. If he is to succeed at the task of survival, if his actions are not to be aimed at his own destruction, man has to choose his course, his goals, his values in the context and terms of his lifetime. No sensations percepts, urges or ‘instincts’ can do it; only a mind can.” – Ayn Rand
FX Trading – The surprise is on the downside … this time.
A heck of a week for the buck so far, right?
Granted we still got a lot of time left before it sticks, but the weekly bar on a chart of the US Dollar Index looks rather impressive:
…….read more HERE
• Market thoughts: it was quite the session yesterday — market volatility soared, and the equity markets suffered its worst performance in three months
• Bonds have more fun: U.S. bond market has caught fire; in Canada, the yield curve steepened as the front end rallied to levels prevailing before the “hawkish” BoC policy report
• No doubt Greece continues to grab the headlines but as Bob Farrell stipulates, the news does not make the market; it’s the market that makes the news
• Monetary union an oxymoron
• The ECB is no Bundesbank; Euro is no D-Mark
• Financial follies: a year ago, it was all about saving the banks; and now it’s all about regulating them
• U.S. pending home sales jump ahead of the tax credit expiry
…..read more HERE
Urgent: Don’t make this dangerous resource mistake
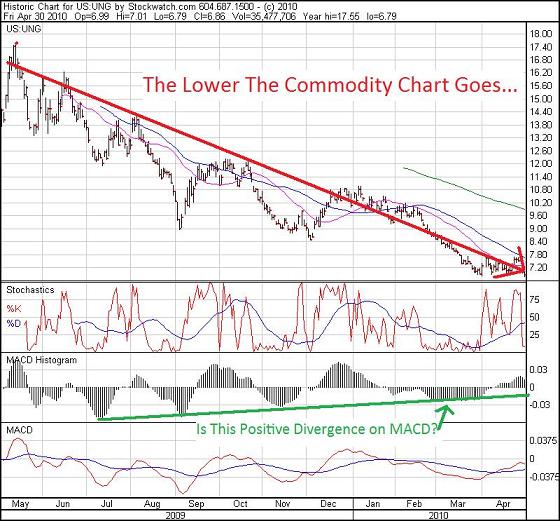
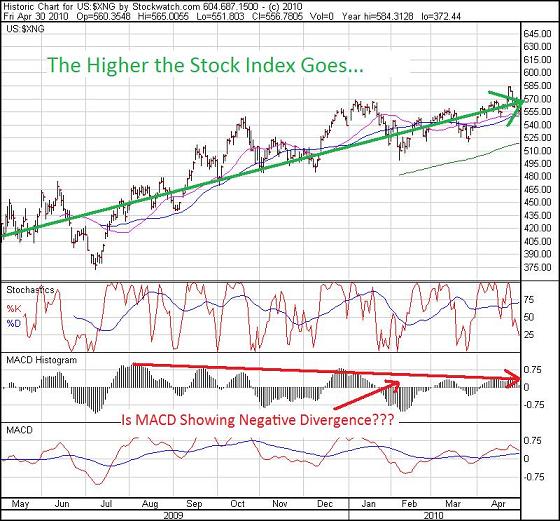
Investors who are looking to the XNG:NYSE Natural Gas Index to tell them the future of natural gas prices could be making a costly mistake.
XNG:NYSE – which tracks large cap companies in the US natural gas industry – has been heading up for 12 months – in the directly opposite direction as UNG:NYSE, the high profile ETF that tracks the price of natural gas. It has been going down for 12 months, and set a new 52 week low late last week.
How can two related natural gas charts go in opposite directions for so long? Which one should investors look to try and make money?
UNG is supposed to track the natural gas commodity price in the US, based on the near month contract on the Henry Hub in Louisiana.
(There are several natural gas “hubs” where natural gas prices are quoted around the US, but the Henry Hub is what most media quote – and while there used to be a big difference between the regional hubs, increased pipeline capacity around the US has lowered those differences a lot.)
XNG measures the stock performance of a basket of large cap companies in the natural gas industry – but they are not all producers. Some are pipeline, transportation and transmission companies.
Look at the two charts, which at first blush I would expect to mirror each other – the underlying commodity and the equities that should track that commodity:
So what gives with that? Does one of these charts have to “give”, somehow?
The short answer is “not really”, and it has to do with how the index is made up, and how some of the companies in the index do business (I’ve listed them alphabetically at the bottom of this article).
Two of them, Kinder Morgan (KMP-NYSE) and Williams (WMB-NYSE) are pipeline companies, not natural gas producers. Now, the main reason the natural gas price is so low is because US production is increasing again after years of decline. So it only makes sense that if you are pumping more gas out, the pipeline companies are making more money.
The stock price of Kinder Morgan was going up anyway, but as soon as their Rockies Express pipeline from Colorado to Ohio went live last fall, their stock took off even more. They’re up more than 50% in the last 12 months. Williams is almost a double.
Second, several of the producers in the index have been very high profile about transforming themselves into oil-weighted companies as fast as they can find deals and if need be, raise the money. Apache Corp. (APA-NYSE) spent $5 billion in just one week in April 2010 buying two sets of oil assets in the Gulf of Mexico (Too bad for them it was before the BP spill). Chesapeake (CHK-NYSE) has been very vocal since February that it wants to become a lot more oil weighted.
On February 25 2010, EOG Resources CEO Mark Papa said it “can no longer be considered primarily a natural gas company.” – and the stock jumped more than 25% in two months!
And of course XTO:NYSE is being bought out by Exxon (XOM:NYSE) for stock, so their stock will track Exxon – the largest independent oil company in the world – until that deal closes. XTO stock has nothing to do with the price of natural gas now.
And lastly, several of the companies are integrated producers, meaning they not only produce the gas out of the ground, (called the upstream business) but also have pipelines and other infrastructure that deliver the gas to customers (called the downstream business). As I mentioned with the pipeline companies – they’re doing a lot better.
So, for those reasons, the XNG stock index and the UNG commodity index – even though they’re both tracking different parts of the natural gas industry – don’t necessarily have to have a tight, direct relationship.
Investors could be tempted to look at XNG, and because stocks lead commodity prices – the market usually predicting where prices will be 9 weeks to 9 months out – as a barometer of where natural gas prices could be in the future. But the XNG has pipeline companies, and several producers who are moving away from natural gas as fast as they can. It’s not just natural gas producers.
So that investment hypothesis could be a costly mistake.
The XNG index is currently made up of:
APA – Apache Corp.
APC – Anadarko Petroleum Corp.
CHK – Chesapeake Energy Corp.
DVN – Devon Energy Corp.
EOG – EOG Resources
EP – El Paso Energy Corp.
GAS – Nicor Inc.
NBL – Noble Energy Inc.
NFG – National Fuel Gas Company
NI – NiSource Inc.
STR – Questar Corp.
SWN – Southwestern Energy Corp.
UPL – Ultra Petroleum
WMB-Williams Companies Inc.
XTO – XTO Energy
Hello, this is Keith Schaefer, editor and publisher of The Oil & Gas Investments Bulletin. I started my subscription service in mid-2009 because I could see there was no place where retail investors could go to easily find which oil and gas companies were creating huge shareholder wealth by using exciting new technologies, such as horizontal drilling, fracing and 3D seismic.
These companies are increasing cash flows – and stock prices – by finding ways to get more oil and gas out of the ground. And junior and intermediate producers – $2-$20 stocks – are leading the way.
I find the leaders in the new plays that are using these technologies. My research is finding higher and higher flow rates from new wells in old formations as management teams fine tune their use of these new technologies.
It’s amazing how technology is lowering operating costs – and increasing profits – for many publicly traded energy companies.
I find the ones who have the capital and the knowledge to be the fastest growing in their area – this usually means they have a large undeveloped land position in an area where either production costs are very low or production rates can be very high. They are covered by several research analysts, so there is research support and institutional money flow behind them.
And my subscribers and myself are making money from my research. I eat my own cooking and buy all the stocks I research for subscribers.
I read MANY research reports, and I do a lot of original research – call management teams, talking to my contacts in the oil patch, scour company financials – to find the companies with the best chance to provide investor profits.
But these reports also give me many great story ideas for the blog, that haven’t hit the mainstream media yet. That’s why you should sign up at the blog to get notified of new stories.
I write the blog and the subscription service so everyone can understand the story. I keep it simple.
Subscribers get a minimum 10 issues a year, and there is often more than one stock presented.
The Oil and Gas Investments Bulletin is a completely independent service, written to build subscriber loyalty. No company ever pays in any way to be profiled.
I am so confident you will find value in my service I offer a 60 day, money back guarantee, no questions asked, for annual subscription purchases. Please read the sample report I have posted on the website to get an idea of how I profile these fast growing stocks.
Email me with any questions at editor@oilandgas-investments.com
Keith Schaefer
Publisher
Ed Note: Two different market approaches arrive at the same conclusion.
From Dennis Gartman:
From Brooke Thackray:
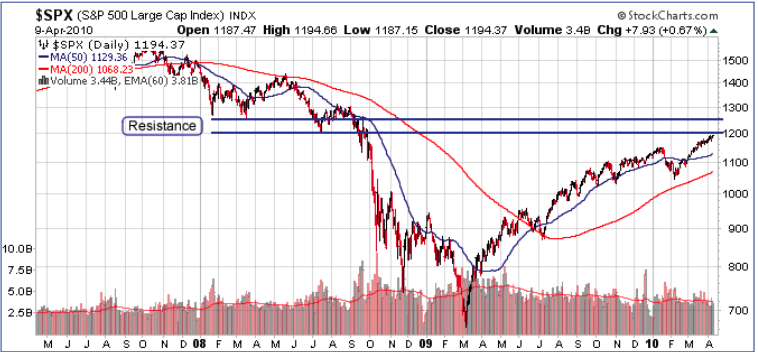
The S&P 500 has broken through its last resistance level as illustrated in the last Thackray Market Letter. It currently sits just below the next resistance level of 1200 with further resistance at 1250. With current strong seasonal trends in place the S&P 500 has a good chance of breaking through 1200. Caution should be exercised if there is a break- through and the market pulls back down below 1200 as the strong six month cycle finishes at the beginning of May.
This brief comment from the extensive analysis contained in Greg’s 13 page Weldon’s Money Monitor. Michael Campbell calls Greg Weldon – “The One Analyst other Analysts can’t Wait to Read.”
From rock-and-roll legend Neil Young …
I wish that I could be there right now, just passing time.
Everybody seems to wonder what it‟s like down here.
I got to get away from this day-to-day running around,
Everybody knows this is nowhere.”
While the Fed may have maintained their “extended period of time” comment, in private, they are likely thinking about “back home”, where it’s “cool and breezy”, and where policy is “normal”.
The Fed is thinking in terms of getting away from this day-to-day running around, whereby they are expending all of their energy trying to determine the best ‘exit strategy approach” — to drain reserves, or sell securities, or raise official short-term interest rates — in order to rebuild an interest rate structure that will make the Fed feel like they’re “back home”.
The Fed would like to “be there, right now”, because EVERYBODY KNOWS, that the current monetary situation is “nowhere”. The market is beginning to respond with a move to “price-in” action by the Fed.
….Ed Note: the snippet below is from further down in Greg’s 12 page Money Monitor
“Stepped up Central Bank purchases of US Treasuries, in line with the fall-out from the Goldman “hearings”, and the continuing EU debt-deficit-debacle appear to be pushing bond yields to the downside today, although, we might offer an alternative explanation. Perhaps the push higher in short-term “funding” rates and MBS-linked “credit spreads”, amid thoughts of an actual “tightening” in monetary conditions, could be seen as “beneficial” to bonds … since it may inhibit an additional rise in inflation expectations.
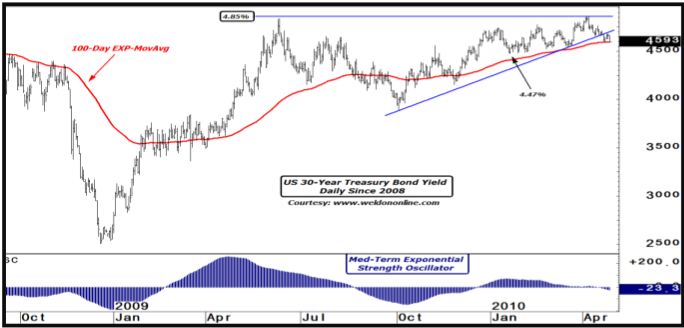
Indeed, the US bond market appears perched on a precipice, with a potential breakdown in yields in the making, as evidenced by the technical overview offered in the pair of charts seen below. We start with the “long- end”, by observing the 30-Year Treasury Bond yield, which is threatening to violate key underlying support defined by the uptrend line in place since last year’s “swing-low”, the med-term trend defining 100-Day EXP-MA (last at 4.58%, with the yield last at 4.59%). We also note the recent push into “negative” (lower yield) territory by the med-term Oscillator. A move below 4.47% would confirm a bigger picture technical breakdown in yields.
Weldon’s Money Monitor offers a FREE 30 Day Trial Subscription. For subscription information contact Eileen @Weldononline.com or Visit www.Weldononline.com for a FREE Trial.
A FREE 30 Day Trial Subscription is defined as a single Trial that is limited to a one-time Signup. Signing up for multiple trials under different names, Fraudulent contact information is illegal. Weldon’s Money Monitor takes this seriously..
-
I know Mike is a very solid investor and respect his opinions very much. So if he says pay attention to this or that - I will.
~ Dale G.
-
I've started managing my own investments so view Michael's site as a one-stop shop from which to get information and perspectives.
~ Dave E.
-
Michael offers easy reading, honest, common sense information that anyone can use in a practical manner.
~ der_al.
-
A sane voice in a scrambled investment world.
~ Ed R.
Inside Edge Pro Contributors

Greg Weldon

Josef Schachter

Tyler Bollhorn

Ryan Irvine

Paul Beattie

Martin Straith

Patrick Ceresna

Mark Leibovit

James Thorne

Victor Adair