
Daily Updates
Gold, Silver & SP500 Trading Charts & Video
May 16, 2010
Last week was amazing for both gold and index traders as gold surged higher and the SP500 tested a key resistance then fell 4% in our favor. The past couple weeks with the mini market crash and Euro issues making the market extra volatile both gold and the broad market (SP500) index has been wild.
The added volatility makes trading more difficult because price patterns become less predictable and price movements are much larger increasing risk for traders.
Below are the charts & videos of what to look for in the coming days…
GLD – Gold ETF Trading
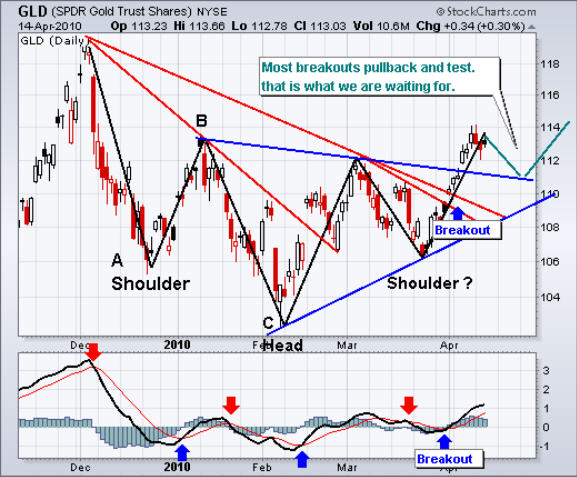
Gold continues to trend higher at an accelerated rate. Friday we saw gold pullback and test a key support level then bounced to close in the middle of the days trading range. As you can see the trend line support has become very steep and once the trend line support is broken I figure there will be a sharp drop to digest the recent rally.
…..read more and view Silver, S&P 500 charts and more HERE
“We experienced ‘Key Reversal’ in GLD on Friday…..
These small excerpts are from Mark Leibovit’s 12 page The VR Gold Letter
………i.e., a higher intra-day high followed by a lower intra-day low all on increasing volume.”
“Recall, I told in last week’s report I reiterated previously published trading objectives for GLD, namely, 117.00, 119.54 (the December 3, 2009 high) and then possibly 124.00! So, for now it appears 122.24 may have been the top of this move.”
“As you know, I’ve been a “gold bug” for years and we have profited together as a result. I still think we have a lot more room to rally, but one has to express some reservations when the mainstream media starts talking about gold. The NY Times presented “A Case for Gold at $5,000 an Ounce” this past Thursday. I too have projected figures like $3000 and $5000, but when everybody else starts talking about it as well, it may be time for a correction. Hold on to your bullion, but we’ll continue to trade both sides of this volatile gold market.”

The weekly VR Gold Letter focuses on Gold and Gold shares. The letter is available to Platinum subscribers for only an additional $50 per month and to Silver subscribers for only $70 per month. Email me at mark.vrtrader@gmail.com.
Marks VRTrader Silver Newletter covers Stock, TSE Stocks, Bonds, Gold, Base Metals, Uranium, Oil and the US Dollar.
More kudos – Mark Leibovit was named the #1 Intermediate Market Timer for the 10 year period ending in 2007; the #1 Intermediate Market Timer for the 3 year period ending in 2007; the #1 Intermediate Market Timer for the 8 year period ending in 2007; and the #8 Intermediate Market Timer for the 5 year period ending in 2007. NO OTHER ANALYST SURVEYED APPEARED IN ALL FOUR CATEGORIES FOR INTERMEDIATE MARKET TIMING AS PUBLISHED IN TIMER DIGEST JANUARY 28, 2008!
For a trial Subscription of The VR Silver Newsletter covering Stocks, Bonds, Gold, US Dollar, Oil CLICK HERE
The VR Gold Letter is available to Platinum subscribers for only an additional $20 per month, while for Silver subscribers the price is only an additional $70.00 per month. Prices are going up very shortl, so act now! Separately, the VR Gold Letter retails for $1500 a year! The VR Gold Letter is published WEEKLY. It is 10 to 16 pages jam-packed with commentary and charts. Please call or email us right away. Tel: 928-282-1275. Email: mark.vrtrader@gmail.com .
• The ability of Greece to meet its rescue terms
• China raised reserve ratio requirements for the third time this year.
• Australia just unveiled a massive new mining tax.
• Financials (stocks) are being re-rated by the rising specter of financial re-regulation.
• The ECRI leading economic index just slipped to a 38-week low. Prospects of a second half slowdown loom large.
• The attempted terrorist attack in Times Square is a reminder that geopolitical risks have not gone away.
• Treasury yields have collapsed nearly 35 basis points and are not consistent with the recent move by equities.
• The U.S. implicit GDP price deflator receded to its slowest rate in 60 years in the first quarter.
• The latest Case-Shiller house price index confirmed that we are into a renewed leg down in home prices.
• Initial jobless claims are not consistent with sustained employment growth.
Governments see it differently, of course.
“The global recovery is better than anticipated largely because of unprecedented efforts of the G-20 countries (to stimulate their economies),” Canadian Finance Minister Jim Flaherty told reporters at a recent G-20 meeting.
Companies have been increasing their dividends as of recent. With earnings improving and prospects for growth optimistic, corporations are feeling generous enough to offer incentives to purchase their stock. Many stocks are still revealing valuations that are below where they should be under ideal conditions, and a quarterly payout by way of a dividend is an effective way to offer quick value to these beaten down investments.
How much can you expect to yield through dividend paying stocks?
The average dividend yield of all of the stocks on the S&P 500 at current levels is 1.72%, producing an average annual payout of 73 cents a share. There are only 124 stocks within this index that do not provide these payouts. Of the dividend paying equities, 52 have payouts topping 4%, largely consisting of mature companies that are beyond their growth phase in the business cycle.
What stocks have the greatest yield at current prices?
Following is the list of stocks in the S&P 500 that are currently yielding the highest return as a result of dividend payouts:
- Windstream Corporation (WIN) – Dividend Payout (Yield): $1.00 (9.2%) – Average Analyst Price Target: $11.92
- CENTURYTEL INC (CTL) – Dividend Payout (Yield): $2.90 (8.45%) – Average Analyst Price Target: $36.2
- AT&T INC. (T) – Dividend Payout (Yield): $1.68 (6.52%) – Average Analyst Price Target: $29.72
- ALTRIA GROUP INC (MO) – Dividend Payout (Yield): $1.4 (6.46%) – Average Analyst Price Target: $23.42
- HEALTH CARE REIT (HCN) – Dividend Payout (Yield): $2.72 (6.35%) – Average Analyst Price Target: $46.25
- PITNEY BOWES INC (PBI) – Dividend Payout (Yield): $1.46 (6.09%) – Average Analyst Price Target: $25.75
- CENTERPOINT ENERGY (CNP) – Dividend Payout (Yield): $0.78 (5.42%) – Average Analyst Price Target: $16.3
- R.R. Donnelley & Sons Company (RRD) – Dividend Payout (Yield): $1.04 (5.14%) – Average Analyst Price Target: $29
- AMER ELECTRIC POW CO (AEP) – Dividend Payout (Yield): $1.68 (5%) – Average Analyst Price Target: $38.72
- LORILLARD, INC (LO) – Dividend Payout (Yield): $4.00 (5%) – Average Analyst Price Target: $87.38
- PHILIP MORRIS INTL (PM) – Dividend Payout (Yield): $2.32 (4.88%) – Average Analyst Price Target: $56.89
- Microchip Technology Incorporat (MCHP) – Dividend Payout (Yield): $1.37 (4.76%) – Average Analyst Price Target: $32.08
- MERCK CO INC (MRK) – Dividend Payout (Yield): $1.52 (4.54%) – Average Analyst Price Target: $43.13
- SPECTRA ENERGY (SE) – Dividend Payout (Yield): $1.00 (4.43%) – Average Analyst Price Target: $24.1
- PFIZER INC (PFE) – Dividend Payout (Yield): $0.72 (4.34%) – Average Analyst Price Target: $22.38
Generally, many of the stocks mentioned above have good prospects for growth. Analysts, by large, are cautious about market prices in the near term; some expecting a correction to continue, or yet to come, and many are taking the approach of keeping money on the sidelines that would allow investments at market lows. The dividend stocks mentioned above will provide investors with the payout incomes needed to generate cash flows, while being cushioned in cases of market volatility due to the dividend yield propping up the stock price to a certain extent.
Be sure to do your homework before you buy to assure that the payout is sustainable and the future growth/sustainability is in-line.
Disclaimer: Comments and opinions offered in this report are for information only. They should not be considered as advice to purchase or to sell mentioned securities. Data offered in this report is believed to be accurate, but is not guaranteed.
QUESTION: Gold has been soaring. Happily I hold a lot of gold How do I turn my higher gold into profits?” –S. Kagem Brooklyn, NY.
Russell Response: This may come as a shock to you, but you become wealthier as your gold rises in price. You don’t have to sell your gold to record a profit. Just sit on your gold, and if it continues to rise you will be that much wealthier. The other alternative is to sell your gold for — for what, fiat dollars? Would you feel richer or more important, would you feel safer, if you held dollars instead of gold? Figure your wealth in terms of how many OUNCES of gold you own. If you own enough gold, you will always be rich, no matter what the stock market does or whether we’re in a depression or a boom.
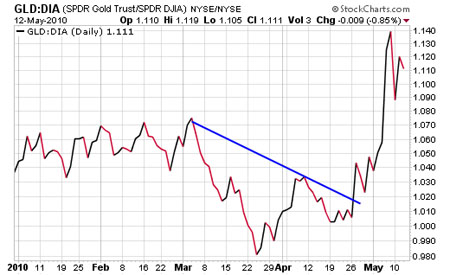
Below we see the telltale ratio, better known as ‘where to put your money.’ Here’s the ratio of the Dow to gold, the recent surge in the ratio is in favor of gold. Believe the chart; unlike governments, charts don’t lie.
Wall Street is a two-way street. Gold has been up 12 out of the last 18 days. So it’s probably time for a correction. Hold off on buying. Remember, if you are overly emotional or greedy or impatient, the market will cost you.
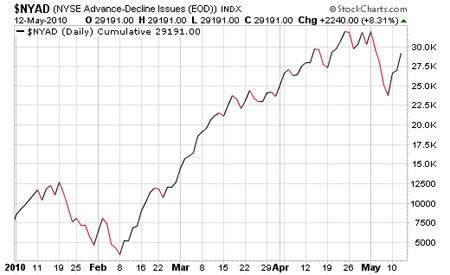
Below is the daily advance-decline line for the NYSE. Mystery, the Dow has been advancing for the last few months, but note that the advance-decline line has topped out. The A-D line follows the direction of the majority of stocks on the NYSE. The chart tells us that the majority of stocks topped out and have slumped, even while the Dow was rising. This is how a diversified holding of stocks probably produced paper losses for you, even as the Dow and the S&P were rising. Once the “internal market” tops out, you’re going to show paper losses, regardless of what the big stock averages do.
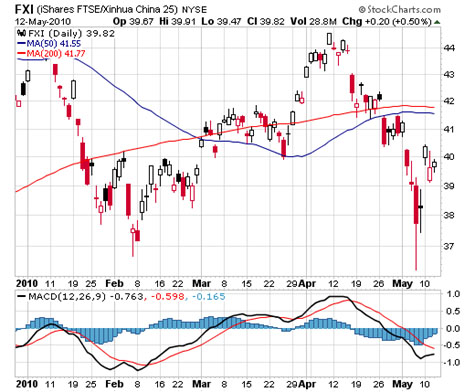
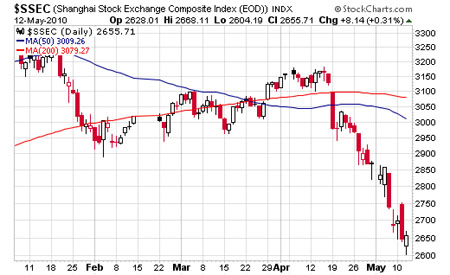
The whole world has its eyes on China. The word is that “China, with its immense buying power, will save us, and drive prices up.” Maybe so, but I look at the chart below, and I doubt that China is going to “crank up the world’s economy.” China is battling a land and real estate bubble. Prices for houses in China are going wild, and the Chinese government is raising bank reserves and making it more difficult to finance a home in China. At any rate, the FXI 25 is often referred to as the “Chinese Dow.” From the looks of it, the Chinese economy could be running into trouble. The Chinese authorities most definitely do not want a real estate bubble, and they are seeing to it that it doesn’t happen.
Below we see the important and widely followed Shanghai Composite. From late-November through to Tuesday this benchmark index has dropped 20%, which, by modern standards qualifies it as a bear market. China is going to give the world a few surprises in coming months! This isn’t a hunch or a rumor or Richard Russell guessing, this is the markets talking.
The Gold Report and The Energy Report do not render general or specific investment advice and does not endorse or recommend the business, products, services or securities of any industry or company mentioned in this report.
From time to time, Streetwise Reports LLC and its directors, officers, employees or members of their families, as well as persons interviewed for articles on the site, may have a long or short position in securities mentioned and may make purchases and/or sales of those securities in the open market or otherwise.
Streetwise Reports LLC does not guarantee the accuracy or thoroughness of the information reported.
Streetwise Reports LLC receives a fee from companies that are listed on the home page in the In This Issue section. Their sponsor pages may be considered advertising for the purposes of 18 U.S.C. 1734.
Participating companies provide the logos used in The Gold Report and The Energy Report. These logos are trademarks and are the property of the individual companies.
Streetwise Reports LLC
P.O. Box 1099
Kenwood, CA 95452
Tel.: (707) 282-5594
Fax: (707) 676-8047
Email: info@streetwisereports.com
-
I know Mike is a very solid investor and respect his opinions very much. So if he says pay attention to this or that - I will.
~ Dale G.
-
I've started managing my own investments so view Michael's site as a one-stop shop from which to get information and perspectives.
~ Dave E.
-
Michael offers easy reading, honest, common sense information that anyone can use in a practical manner.
~ der_al.
-
A sane voice in a scrambled investment world.
~ Ed R.
Inside Edge Pro Contributors

Greg Weldon

Josef Schachter

Tyler Bollhorn

Ryan Irvine

Paul Beattie

Martin Straith

Patrick Ceresna

Mark Leibovit

James Thorne

Victor Adair