
Daily Updates
On April 27th, I sold a large piece of the equity portfolio that I manage for clients and placed it into cash. The timing of doing this was based on observations I have been making on this blog site prior to that decision. In other words, I don’t just talk about theory on this blog page—I follow through via my own actions!
While we don’t always get such precise timing on a trade—this one worked out quite nicely, having sold basically near the market peak prior to the recent volatility. You can see my BNN video clip where I discussed my reasons for selling on that day at http://watch.bnn.ca/tuesday/#clip294784
As for what is happening right now on the markets…..
…..read it all HERE
Chinese stocks have entered official bear market territory. The Shanghai Composite Index retreated 1.9 percent on Tuesday, bringing it 21 percent below its Nov. 23 high. Fears that officials will have to raise interest rates to cool inflation have been weighing on Chinese shares.
Those fears intensified yesterday after the annual inflation rate pushed up to an 18-month high in April and property prices rose at a record clip.
“The Chinese economy will slow down considerably,” investor Marc Faber, publisher of the Gloom, Boom & Doom report, said in a Bloomberg Television interview. The government is “trying to cool speculation.”
…..read more HERE
China’s Bear Market Stocks to Rebound, Templeton Says
China’s Shanghai Composite Index, the first of the 10 biggest benchmark measures to enter a bear market this year, will rebound as a surge in exports lowers the risk of a slump in economic growth, according to Franklin Templeton’s local fund management unit.
….read more HERE
The Safe Six in our Ticker Trax™proposition are Platinum, Copper, Gold, Silver (rising three percent Tuesday), Molybdenum & Generic Drugs/Novel Molecular Compounds. The six commodities are prescribed for a Ticker Trax audience that can withstand extreme investing risk by exercising caution, purchasing cheaply and holding for years.
….read all about each stock HERE
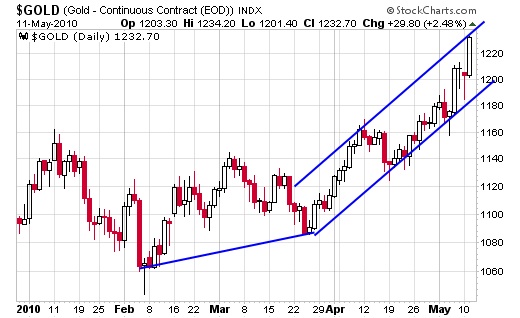
Gold $1,236 – A Pause That Refreshes is Welcomed
Please don’t confuse a desire for some consolidation and new base-building with anything more than it is. Yes, it would be great to continue a straight up move but the history of this “mother” of all secular bull markets has been two steps up and one step back. This pattern has killed the perma-bears and bulls turned bears hoping to buy back in at significant lower levels.
Gold has often traded in some nicely defined channels and if it does it again, we can see a pullback here to as low as $1,185 and mean absolutely nothing to the bigger picture. I continue to believe my 2010 target of $1,300 to $1,500 is very doable. Besides, I love watching Tokyo Rose wiping off the blood and saying for the umpteenth time – “gold is not in a bull market and this pullback is the beginning of the end.” What an indicator!
plus:
Quick Update
Stepping out for the evening but an update on some news of the day was needed.
First, the U.S. stock market appears to have weathered yet another storm and my bear suit remains in the closet (but is still available for immediate use). Gold is in need of a consolidation and even a 3-5% correction. Whether it does or doesn’t, my target for 2010 remains $1,300 to $1,500.
….read much more HERE
Are Precious Metals and Indexes Going Parabolic?
It’s been an exciting couple weeks in the market with gold now making new all time highs as money floods into this shiny safe haven. It has everyone all worked up wanting to take part or they are riding the rally up already. But the big question is when should some money be taken off the table to lock in gains and lower your overall risk during these crazy times?
Below are a few charts showing you how I see things at this time.
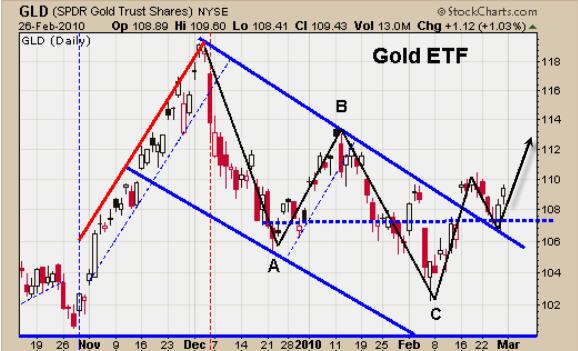
GLD – Gold Exchange Traded Fund
The price of GLD and gold appear to be going parabolic (straight up). The tough part about this type of price action is that large moves can happen in a very short period of time. But on the flip side, when the price reverses we tend to see prices fall just as fast if not faster. Trading this type of price action carries a very high level of risk. Those chasing it up buying at these overbought market conditions is a double edge knife.
SLV – Silver Exchange Traded Fund
Silver is trading similar to gold but the key difference here is that silver has not broken to a new high as of yet. The high was set in 2008 just over $20 per ounce. But from looking at the chart I think metals are ready for a breather.

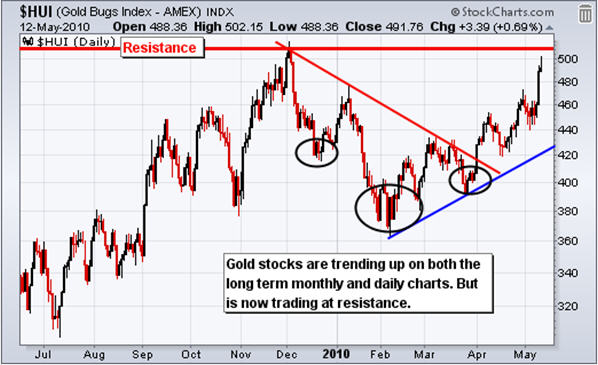
HUI Index – Gold Stocks
Gold stocks have yet to breakout along with silver as they both are nearing key resistance levels. With gold stocks and silver trading near resistance I figure we will see pause in the coming days as traders digest the recent strong moves up taking some money off the table incase prices get stuck under these resistance level.
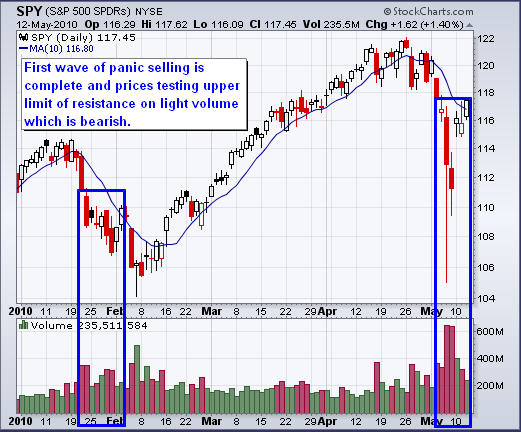
SPY – SP500 Broad Market Exchange Traded Fund
The broad market appears to be forming a possible short setup on the daily chart as the price continues to drift higher with declining volume. Also indexes are testing key resistance levels and the 10 period moving average. The next few days should be interesting…
Mid-Week Precious Metals and Index Exchange Traded Fund Report:
In short, it looks like precious metals and the broad market could take a breather in the coming days. I’m not sure how large of a correction we will see but I do not think it will be all that big.
Gold and silver should have a quick dip with buyers stepping back in on weakness. The SP500/broad market is a little more tough to call as last weeks market crash messed things up washing out all the stops in one day instead of weeks… but we could easily see a 5% drop in the market still.
Anyways I hope this analysis helps everyone…
Check out my trading services at: www.TheTechnicalTraders.com
Subscribe to Free Newsletter HERE (lower right hand side look for Free Technical Trading Charts)
Chris Vermeulen
-
I know Mike is a very solid investor and respect his opinions very much. So if he says pay attention to this or that - I will.
~ Dale G.
-
I've started managing my own investments so view Michael's site as a one-stop shop from which to get information and perspectives.
~ Dave E.
-
Michael offers easy reading, honest, common sense information that anyone can use in a practical manner.
~ der_al.
-
A sane voice in a scrambled investment world.
~ Ed R.
Inside Edge Pro Contributors

Greg Weldon

Josef Schachter

Tyler Bollhorn

Ryan Irvine

Paul Beattie

Martin Straith

Patrick Ceresna

Mark Leibovit

James Thorne

Victor Adair