
Daily Updates
Stockscores.com Perspectives for the week ending July 11, 2010
After the Mechanics, It Is All Mental
In this week’s issue:
Weekly Commentary
Strategy of the Week
Stocks That Meet The Featured Strategy
![]()
I am often asked about the skills necessary to be a great trader. The answer to that question parallels the criteria for most pursuits where excellence is the goal. First, you have to learn the mechanics and then you must learn mental mastery.
The mechanics are the simple and straightforward part of the equation. Traders first need a set of criteria for identifying opportunities, the rules for entry. Some will develop technical analysis criteria, perhaps looking for a convergence of indicators that the traders tests to determine their effectiveness. Others will rely on fundamental valuations, looking to buy stocks that appear to be on sale in consideration of the company’s ability to make a profit. Some may combine research methods from both analytical disciplines.
With these rules established, the trader must work to develop a method for understanding and managing risk. I plan to lose on every trade I make, knowing the exact triggers that will make me exit a trade at a loss. For me, I rely on price barriers established by the past actions of traders. Others may use percentage drawdown or even time scale factors to know when to exit. For me, the amount of risk on the trade determines the position size that I take so I always know my exposure to loss going in. This all comes from the recognition that trading requires capital and losing it or tying it up in dead stocks is a quick way out of the trading game.
Then there is the question of when to exit. Again, the individual trader must develop their set of criteria to exit a trade, knowing the importance of sticking with winners and letting profits run. The winners have to pay for the inevitable losers so all exit strategies should factor in some understanding of expected value and probability theory. You can’t be right all of the time, but you can change what you do when you are right and when you are wrong. (continued below)
- Get the StockSchool Pro Free

Open and Fund a brokerage account with DisnatDirect and receive the StockSchool Pro home study course free, including special Pro level access through the DisnatDirect client website. Offer only available to Canadian residents. For information, click HERE
Finally, since technology now plays a huge role in trading, there is the mastery of the tools that traders use to identify and execute trading opportunities. My primary tool is the Stockscores web site, but I also use real time quote feeds, spreadsheets, order entry tools and information sources to help in my trading decisions. Technology has given traders a lot more power, but also a lot more to think about. The challenge is to separate the significant from the minutiae and remain focused on using technology to make money.
These are some of the mechanics of trading. Just as a golfer must master the mechanics of the golf swing, the trader must master these areas if they are to ever succeed.
But mastery of the mechanics of trading only assures the trader occasional glory. As anyone who has ever seen me golf will attest, mechanics alone will barely get you down to the green. In golf, there are times when the threat of the woods or water call out to your subconscious mind, causing you to overpower your understanding of mechanics and leaving you in search of some small thing that seems to separate you from success.
Trading is no different.
The fear of losing money and the desire to feel the empowerment that comes with trading profits can lead many away from the execution of their trading plan. Learning the mechanics of trading can take mere months, but for some, mastery over their trading minds can never be achieved. For most of us, it is this second phase of our learning where the greatest amount of effort must be spent.
First you have to learn the rules that form the backbone of your trading approach. Then you have to work on understanding why you keep breaking those rules. Understanding that mechanics alone will not make you money is a revelation that often comes to traders long after their brokerage account balances have been depleted. Keep this in mind as you work to master the markets.
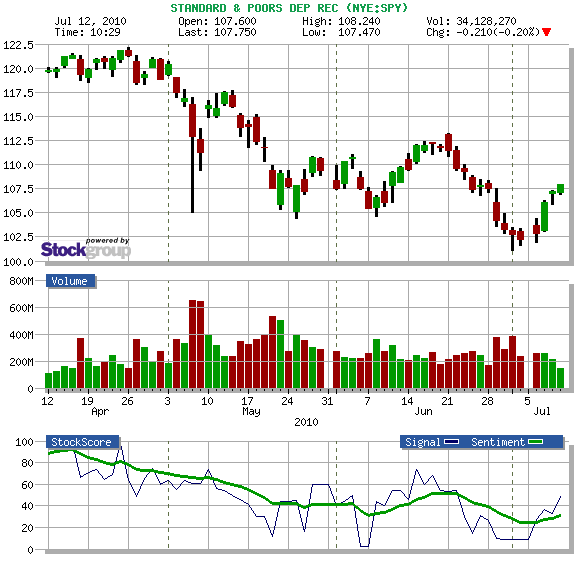
![]()
This is a difficult market to trade because investors have very little commitment to individual stocks. Trends are short and the market whipsaws back and forth often. Right now, the easiest thing to do is trade the index ETFs. The trades have to be short term swing trades since the market trends don’t tend to last more than a couple of weeks. However, if you get it right, you can pull out a few percentage points on each swing which can add up to some decent gains after 10 trades.
Since this newsletter only comes out on the weekend, I can’t provide a timely alert on a trading opportunity that I see in these ETFs. I do that in the daily edition of the newsletter, which now sends out alerts in real time via email and cellular text message. You can subscribe to that from the Products, Newsletter area of www.stockscores.com
I can tell you what to watch for if you want to look for the trade set up yourself. Right now, the markets are making a bounce back from recent weakness and we are on the third up day in a row. I expect we could see a couple more up days before the markets run in to resistance at the downward trend line.
This is where the opportunity is. Watch an index ETF like the SPY for a break of the short term, intraday upward trend line. The reversal signal may also come in the form of a break down from a falling top. It probably will not happen early this week but could occur later in the week, once that resistance has been hit.
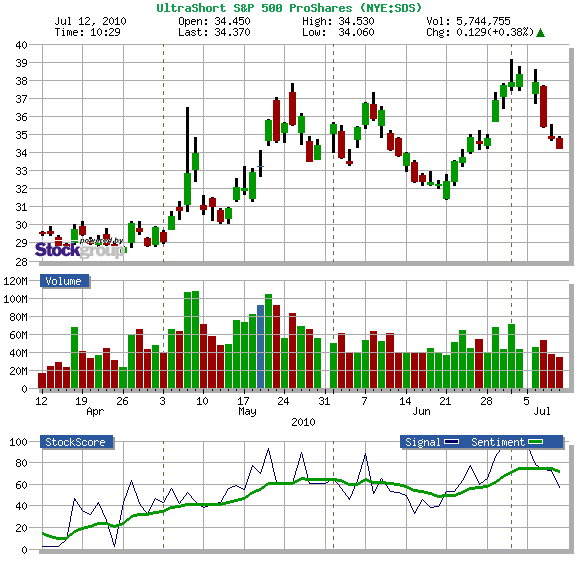
Be patient for it and, when it happens, consider buying an ETF that has a reverse and leveraged correlation to the overall market. The SDS is a good choice for that. However, take your entry signal from the SPY since the leveraged effect of the SDS can throw off the chart.
![]()
1. SPY
Use the SPY to pick the entry signal for a short sell trade as the market rallies up to resistance on the daily chart. It is best to look for this entry signal on the 15 or 60 minute intraday charts. I will provide my alert to subscribers of the daily newsletter.
2. SDS
You can leverage the trade using the SDS ETF which will go up if the market goes down at about twice the pace.
References
Get the Stockscore on any of over 20,000 North American stocks.
Background on the theories used by Stockscores.
Strategies that can help you find new opportunities.
Scan the market using extensive filter criteria.
Build a portfolio of stocks and view a slide show of their charts.
See which sectors are leading the market, and their components.
Click HERE for the Speaker Lineup and to Purchase the video if you want to learn from some of the worlds best traders including Tyler Bollhorn.

Tyler Bollhorn started trading the stock market with $3,000 in capital, some borrowed from his credit card, when he was just 19 years old. As he worked through the Business program at the University of Calgary, he constantly followed the market and traded stocks. Upon graduation, he could not shake his addiction to the market, and so he continued to trade and study the market by day, while working as a DJ at night. From his 600 square foot basement suite that he shared with his brother, Mr. Bollhorn pursued his dream of making his living buying and selling stocks.
Slowly, he began to learn how the market works, and more importantly, how to consistently make money from it. He realized that the stock market is not fair, and that a small group of people make most of the money while the general public suffers. Eventually, he found some of the key ingredients to success, and turned $30,000 in to half a million dollars in only 3 months. His career as a stock trader had finally flourished.
Much of Mr Bollhorn’s work was pioneering, so he had to create his own tools to identify opportunities. With a vision of making the research process simpler and more effective, he created the Stockscores Approach to trading, and partnered with Stockgroup in the creation of the Stockscores.com web site. He found that he enjoyed teaching others how the market works almost as much as trading it, and he has since taught hundreds of traders how to apply the Stockscores Approach to the market.
Disclaimer
This is not an investment advisory, and should not be used to make investment decisions. Information in Stockscores Perspectives is often opinionated and should be considered for information purposes only. No stock exchange anywhere has approved or disapproved of the information contained herein. There is no express or implied solicitation to buy or sell securities. The writers and editors of Perspectives may have positions in the stocks discussed above and may trade in the stocks mentioned. Don’t consider buying or selling any stock without conducting your own due diligence.
Adrian Day of Adrian Day Asset Management says that you should be restructuring your portfolio to reflect the ongoing economic decline of the West and the rise of the East. The US is now in a period that historically parallels Great Britain at the end of WWII, when a pound cost $5, on its way to $1, some 37 years later.
While we are seeing some dollar strength now, this is only a fleeting move in a secular bear market (UDN). Central banks have cut their holdings of the greenback from 70% to 65%, and we could be on our way to 50% or lower. They no longer wish to hold such a heavy weighting of the currency of a country with such a large and worsening structural deficit. This will not be achieved through some great cataclysmic sell off, but a slow and steady diversion of new money into other assets. Adrian especially likes the Singaporean and Hong Kong dollars and the Chinese Yuan (CYB). Ownership of Canadian and Australian dollars, and gold, is rising. He is not a fan of the yen or the euro.
Day is extremely cautious about global stock markets for the time being, but likes emerging markets long term, which will be driven by a rising middle class in the decades to come. Brazil (EWZ) is a top choice, with vast improvements in governance since the bad old days of the eighties, and one of the world’s strongest currencies. He’s out now, awaiting an election that could bring a leftist tilt. He likes real estate mortgage lender Gafisa (GFA), in which Chicago mogul San Zell is the largest investor (click here for more depth at http://www.madhedgefundtrader.com/july_30__2009.html ). Adrian clearly adores Singapore (EWS), where companies have believable accounting and super strong balance sheets. Day has nothing in Africa or Eastern Europe.
Adrian is also a big gold bull (GLD), as it now is a defensive holding that does well in every economic scenario. He doesn’t see the retail rush to buy the barbaric relic as a fiat currency replacement any time soon. And then there’s the central bank bidding war. Ben Bernanke and Alan Greenspan are in denial, still don’t understand the Fed’s role in creating the credit bubble, and until they do, investors have no reason to trust in paper currencies.
The cerebral Englishman wants to buy oil and gas during the traditional summer weakness, as well as commodity producers. He worships Freeport McMoRan (FCX), the top copper miner, as one of the best managed companies in the world. He is bullish on food (CORN), ags like Potash (POT), and water (PHO) (click here for my piece on H2O at http://www.madhedgefundtrader.com/september_17__2009.html ). He also likes business development companies such as Apollo Investments (AINV) and Ares Capital (ARCC).
After getting a degree from the prestigious London School of Economics, Adrian devoted a lifetime to uncovering undervalued investment opportunities around the world. Today Adrian runs his own money management firm which focuses on global diversification for institutional clients. He is about to release a book entitled Investing in Resources: How to Profit from the Outsized Potential and Avoid the Risks. You can learn more about Adrian’s firm by visiting his site at http://www.adriandayassetmanagement.com/ .
To listen to my interview with Adrian on Hedge Fund Radio in full, please click here at http://www.madhedgefundtrader.com/july-6-2010-adrian-day.html and then on the “PLAY” arrow at “Today on Hedge Fund Radio.”
A 5 chart sampling and the Bottom Line taken from the comment plus 45 Charts Don Vialoux analyses in this great Monday comment HERE
Be sure to read Don’s Weekend Article Agriculture – A Golden Harvest
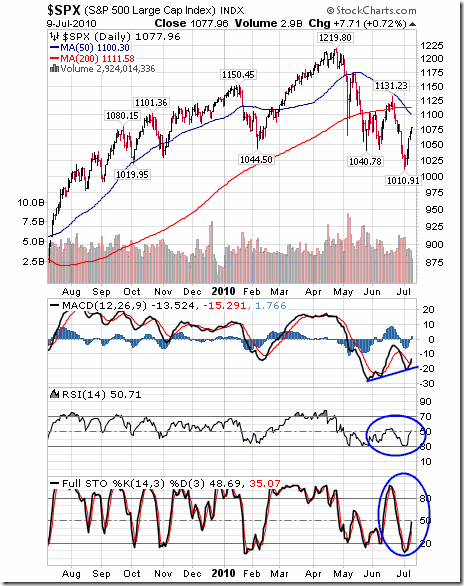
The S&P 500 Index gained 55.38 points (5.42%) last week. The gain last week is typical of a short term recovery within an intermediate downtrend. The gain last week occurred on lower than recent volume. In recent weeks its 50 day moving average (currently at 1100.30) has proven to be a reliable short term resistance level. Short term momentum indicators are recovering from oversold levels. MACD shows encouraging divergence relative to the Index’s intermediate downtrend.
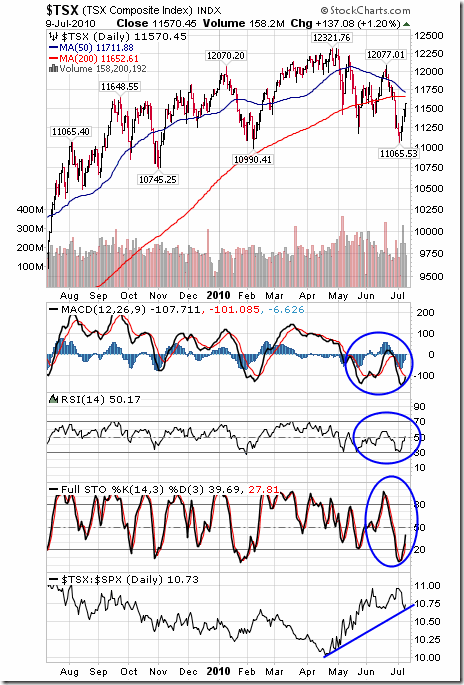
The TSX Composite Index added 374.39 points (3.34%) last week. Intermediate trend remains down. A “Death Cross” likely will occur this week. Short term momentum indicators are recovering from oversold levels and have short term upside potential. Strength relative to the S&P 500 Index remains positive, but is showing early signs of change. Short term upside potential is to its 50 day moving average currently at 11,711.88.
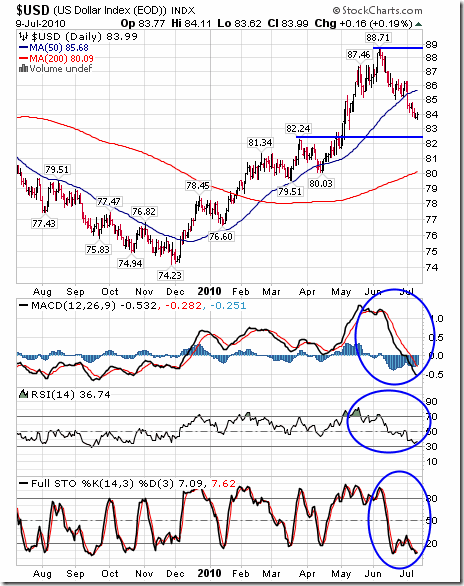
The U.S. Dollar fell another 0.46 last week. Continuing weakness below its 50 day moving average is significant because previously the average acted as support. Short term momentum indicators are oversold, but have yet to show signs of recovery. Support is indicated near 82.24. Chances of a short term recovery are high. If recovery is to its 50 day moving average and if resistance appears, intermediate trend of the U.S. Dollar changes from up to down. Confirmation of an intermediate downtrend of the U.S. Dollar when it occurs will have important ramifications for equity and commodity markets.
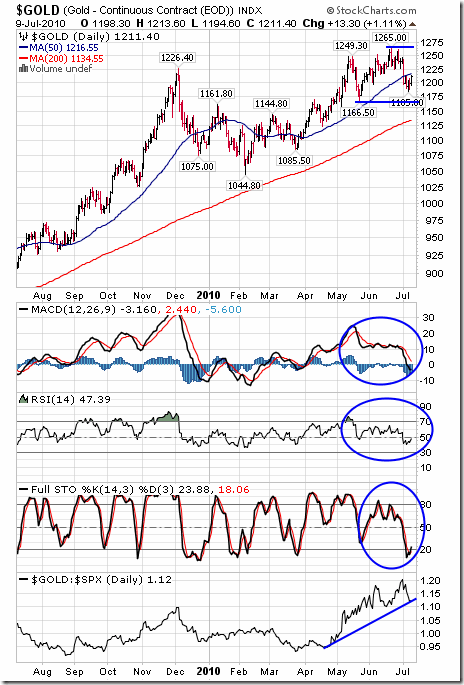
Gold was virtually unchanged last week. Intermediate trend remains up. Technical action was mildly bullish on Friday when gold bounced without testing support at $1,166.50. Short term momentum indicators are oversold and trying to recover. Strength relative to the S&P 500 Index remains positive. Resistance is at its all time high at $1,265.00. According to Thackray’s 2010 Investor’s Guide, gold’s period of seasonal strength starts today and continues to October 3rd.
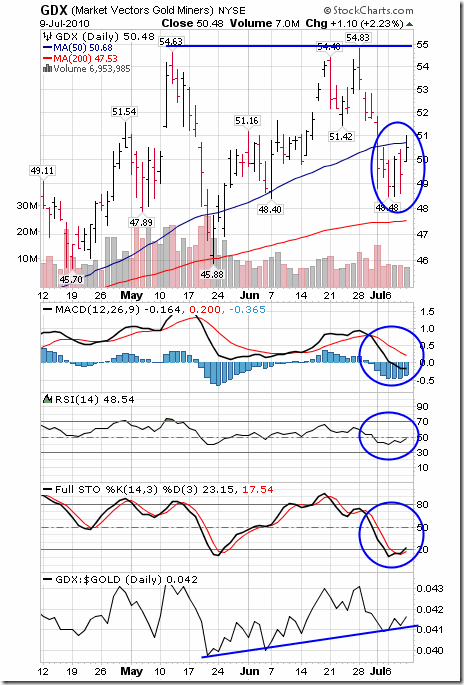
Gold equity indices and related ETFs also are showing early technical signs of recovery. The AMEX Gold Bug Index, the Philadelphia Gold and Silver Index and the Market Vectors Gold Miners ETF (Symbol:GDX) moved above a five day trading range on Friday triggering a short term technical reversal. Short term momentum indicators are oversold and showing early signs of recovery. Strength relative to the price of gold remains positive, an encouraging technical indicator for both gold and gold equities. Suggested strategy changes to “Initiate positions at current prices and add on weakness”.
Fin Reg becomes an issue this week. Congress returns from recess. Passage through the Senate is far from assured. Many questions about content and impact remain unanswered.
What about “Death Crosses”? Several more likely will occur this week. Forget about “Death Crosses”! They are great “talking points” for the media, but they are not relevant over the intermediate term.
Short term technical indicators have recovered from deeply oversold levels and in many cases no longer are oversold.
Intermediate technical indicators remain bearish for the most part. Many key indices already are approaching key resistance levels and/or their 50 day moving average where resistance is likely.
Currencies remain a focus. The Euro has gained 6.7% in five weeks, an extraordinary event considering the political and economic realities in Europe. It is substantially short term overbought and due for a correction. Look for a corresponding recovery in the U.S. Dollar.
Equity markets during a U.S. mid term election year have a history of moving lower from July to September.
The Bottom Line
Nice recovery bounce last week! Additional strength is possible this week. However, the intermediate seasonal, fundamental and technical outlook remains unfavourable. Strength is an opportunity to increase cash positions. Exceptions exist. Selected sectors with favourable seasonality and improving short term technicals are purchase candidates at current prices and on weakness. Selections must also have positive strength relative to the market.
….read more and view many more Charts HERE
Be sure to read Don’s Weekend Article Agriculture – A Golden Harvest
Uranium Bottoming as China Boosts Stockpiles
“China is buying unprecedented amounts of uranium, signaling that prices are poised to rebound after three years of declines.”
“India and China are leading the biggest atomic expansion since the decade after the 1970s oil crisis”
“The uranium bull market of 2006 and 2007 stimulated the development of new supply, but we do not think it is enough,” Schatzker wrote in a report. “The prevailing uranium price is too low to stimulate sufficient supply to cover future reactor requirements.”
….read about Stocks involved in Uranium Bottoming as China Boosts Stockpiles
As a starting point, it is important to understand what real long-run rates of return have been for different assets.2 Good data exists on developed country equity markets by sector and on real estate.
For example, most people know that the real long-run return on U.S. equities is about 6.5%. Small-cap stocks outperform large companies by a wide margin, value stocks outperform growth stocks, also by a wide margin, and small value stocks easily outperform small growth stocks. However, small companies have much greater volatility and business risk.
It is also well known that the real return on bonds lags the real return on stocks, but risk is much less. In a portfolio, the inclusion of some bonds along with stocks lowers risk faster than it lowers returns up to a point.
…read the whole 14 page Asset Allocation Thoughts
*All chart data from IHS/Global Insights, and may not be reproduced without written consent.
-
I know Mike is a very solid investor and respect his opinions very much. So if he says pay attention to this or that - I will.
~ Dale G.
-
I've started managing my own investments so view Michael's site as a one-stop shop from which to get information and perspectives.
~ Dave E.
-
Michael offers easy reading, honest, common sense information that anyone can use in a practical manner.
~ der_al.
-
A sane voice in a scrambled investment world.
~ Ed R.
Inside Edge Pro Contributors

Greg Weldon

Josef Schachter

Tyler Bollhorn

Ryan Irvine

Paul Beattie

Martin Straith

Patrick Ceresna

Mark Leibovit

James Thorne

Victor Adair