
Daily Updates
Read Full Article HERE
Read Summary HERE
WHAT’S DRIVING THE MARKET?
We’ve been asked repeatedly how the stock market has managed to bounce off the nearby lows with such veracity. Especially with the ongoing weakness we have seen in the incoming U.S. economic data due to the fact that the retail investor still refuses to participate and is solely focused on income-generating strategies. The answer is that the market may have been on the receiving end of another few jolts of liquidity. M2 money supply has expanded $38.5 million in the past two weeks and the M1 money multiple has risen from 0.839 to 0.862.
When we go to the weekly data from the Fed, we see that “trading assets” on commercial bank balance sheets expanded to $325 billion in the past two weeks from $297 billion. And, when we go to the Commitment of Traders report, we see that there has been a big swing in the net speculation position on the S&P 500 “E-minis” on the Mercantile Exchange (futures and options) to a net long position of 28,172 contracts from 15,155 net shorts just two weeks ago. That’s a big part of the bounce-back — prop traders and short-coverings. Nothing fundamental here, as far as we can see.
More in this issue of Breakfast with Dave:
- While you were sleeping: European equity markets continue to rally, now up six days in a row, while, Asian stock markets are slipping; Moody’s downgraded Portugal’s credit rating by two notches, to A1; China’s economy appears to be cooling down
- Just call it a whole lot of volatility: for the first half of 2010, the action in the S&P 500 has been very volatile
- Small business sentiment in the U.S. gets smaller: the latest NFIB optimism index fell to a three-month low in June
- Bank of Canada outlook surveys: slowing growth and easing credit conditions
Read Full Article HERE
Read Summary HERE
Natural Gas Valuations Jump Up with Buyout – Who’s Next?
Valuations in the Canadian gas patch took a BIG jump today as Pengrowth Energy Trust (PGF-TSX) bought out junior gas producer Monterey Explorations (MXL-TSX) for its Montney gas play in NorthEast British Columbia. Monterey’s stock jumped 80%, up $3.46, to close at $7.74 on 6.3 million shares.
Pengrowth paid well over $200,000 per flowing barrel for a natural gas producer – when the average for junior producers is $55,000 – $70,000 per flowing barrel, according to Canaccord Genuity and BMO Nesbitt Burns recent data. Storm Exploration (SEO-TSX), one of the most respected teams and lowest cost gas producers on the TSX, sold for $69,000 per flowing barrel exactly one month ago.
Now, there were some mitigating reasons for this very high valuation – which I will explain briefly – but it has investors wondering – which junior gas producer is next? With premium buyouts that high, these previously moribund junior gas stocks could have some profit potential for investors this summer.
There are several junior Montney gas players, including – in alphabetical order – Advantage Energy, Birchcliff Energy, Celtic Energy, Cequence Energy, Cinch Energy, Crew Energy, Crocotta Energy, Delphi Energy, Insignia Energy, Orleans Energy, Painted Pony Explorations, Progress Energy, Rock Energy, Seaview Energy and Terra Energy and Trilogy and Yoho Resources.
One factor driving valuations could be the new focus on the deep (3500 m) Duvernay shale, the bottom formation in the Montney area, which is pervasive yet unexplored. The Duvernay shale is believed to be the source rock for all the prolific oil producing reef structures in the Beaverhill Lake and Leduc formations just above it. Over $450 million was paid for Alberta oil and gas rights last week, and most analysts believe the bulk of it was spent for the Duvernay shale. Many junior gas stocks with Duvernay rights had an uptick last week after the sale.
All this is happening while natural gas prices are still low. Production in the US is still increasing, especially in the Marcellus shale of Pennsylvania, although demand is also up. Many companies still must drill or lose their gas lands regardless of price.
But low gas prices have not impacted mergers & acquisitions in the US. Canadian brokerage house GMP Securities estimates more than $70 billion in transactions in natural gas producers have been completed in the US in the last two years.
In speaking with Calgary CEOs and investment bankers today, nobody understood why Pengrowth paid that much for Monterey. But, while Monterey has only 1,700 boe/d now, it has 20 million mmcf/d (million cubic feet of gas per day production) ready to go into a new 28 mmcf/d facility. The industry converts gas into oil at 6:1, so that 20 mmcf/d=~3,333 boe/d. Pengrowth clearly paid for that, and Pengrowth expects to exit 2010 with 6,000 boe/d on the Monterey lands. At 6,000 boe/d, Pengrowth says the valuation metrics are just under $50,000 per flowing barrel. Pengrowth already owned a big chunk of Monterey, but good for Monterey management for getting that priced in.
And their latest 3 wells AVERAGED 7 mmcf/d on short term IP rates – you do see these bigger numbers, but not often as an average. That’s good consistent high rates of production.
Also, Monterey spent the money to acquire the Duvernay rights to its properties. Many analysts are calling the Duvernay the next “Horn River” play, referring to the huge new shale play on the Yukon-BC-Alberta border. Except the Duvernay – if it works – is in the middle of lots of oil and gas infrastructure, like pipelines and suppliers, and doesn’t need tens of kilometers of roads built through tough northern bush.
All this is good news for investors in junior and intermediate natural gas stocks, as the industry is clearly saying – build it, and we will come (buy you out).
About the Author (Subscribe to The Oil & Gas Investments Bulletin HERE )
Hello, this is Keith Schaefer, editor and publisher of The Oil & Gas Investments Bulletin. I started my subscription service in mid-2009 because I could see there was no place where retail investors could go to easily find which oil and gas companies were creating huge shareholder wealth by using exciting new technologies, such as horizontal drilling, fracing and 3D seismic.
These companies are increasing cash flows – and stock prices – by finding ways to get more oil and gas out of the ground. And junior and intermediate producers – $2-$20 stocks – are leading the way.
I find the leaders in the new plays that are using these technologies. My research is finding higher and higher flow rates from new wells in old formations as management teams fine tune their use of these new technologies.
It’s amazing how technology is lowering operating costs – and increasing profits – for many publicly traded energy companies.
I find the ones who have the capital and the knowledge to be the fastest growing in their area – this usually means they have a large undeveloped land position in an area where either production costs are very low or production rates can be very high. They are covered by several research analysts, so there is research support and institutional money flow behind them.
And my subscribers and myself are making money from my research. I eat my own cooking and buy all the stocks I research for subscribers.
Hussman on Misallocating Resources, Market Valuations, Earnings Estimates, and Public Policy
Once again John Hussman has written an excellent weekly column. This week, in Misallocating Resources, Hussman talks about stock market valuations, PE ratios, bailouts, and other things.
Let’s start with a look at stock market valuations.
Market Valuations and Earnings Estimates
From Hussman…
On a valuation basis, the S&P 500 remains about 40% above historical norms on the basis of normalized earnings. The disparity between our valuation assessment and the putative undervaluation being touted by Wall Street analysts is so great that a few remarks are in order. First, virtually every assessment that “stocks are cheap” here is based on the ratio of the S&P 500 to year-ahead operating earnings estimates, and often comes with a comparison of the resulting “earnings yield” with the depressed 10-year Treasury yield. What’s fascinating about this is that this is the same basis on which analysts deemed stocks to be about 40% undervalued just prior to the 2007 top, following which the market plunged by more than half. There’s a great deal of analysis regarding forward operating earnings that I published in 2007, but probably the most comprehensive piece was Long Term Evidence on the Fed Model and Forward Operating P/E Ratios from August 20, 2007.
….continue reading Hussman on Misallocating Resources, Market Valuations, Earnings Estimates, and Public Policy
Ed Note: A followup to yesterday’s article Uranium Bottoming – China buying Unprecedented Amounts
A New Paradigm for Power Generation 
This Plant will Power
- 20,000+ American-style homes, or a …
- Large hospital complex
- Entire government complex
- Irrigation systems
- Water treatment & distribution site
- Waste – sewage facility
- Heavy oil recovery
- Refugee community
- Emergency – disaster response center
- Military installation
- University or college
- Mining or drilling operation
- Industrial center or factory
- Corporate data centers
- And more
Small & Modular nuclear power Reactors (SMRs)
That “smaller solution” is the category of power reactors known as Small & Modular nuclear power Reactors (SMRs). The history of SMRs is about as long as the commercial use of large nuclear power plants. The fuels and technology included in today’s SMR designs have been studied for over 50 years, and some units went online decades ago. SMRs provide the benefits of larger nuclear power plants – clean, continuous, reliable energy with no greenhouse gas emissions – yet they require very little space in which to operate. SMRs can be transported to sites and engaged.
From Uranium-stocks.net
June 14, 2010 – Alternate Energy Holdings, Inc. (OTCQB: AEHI) – today announced the signing of a memorandum of understanding with New Mexico-based Hyperion Power Generation, Inc. The MOU is the beginning of a joint venture between the two companies to license, build and market Hyperion’s refrigerator-sized modular nuclear reactors on a world-wide basis.
From Energy Wise:
Some companies, though, have an alternative to the large-scale, 1,200 megawatt-and-up monsters that are running into such opposition. The small modular reactor, delivering only 25 MW of power for eight or 10 years before being replaced, could come before the Nuclear Regulatory Commission for approval this year. The output will be enough to power about 20,000 homes.
Hyperion Power Generation is one such company, having revealed last year the design for its Hyperion Power Module. Using a liquid metal cooling design (specifically, lead-bismuth eutectic), the 1.5 meter wide and 2.5 meter high reactor would be shipped to customers fully sealed, and shipped back in the same state a decade later, not requiring any refueling or storing of nuclear waste. Of course, if they really start delivering on the reported 150-plus purchase agreements already in place, that means a whole lot of nuclear material being shipped around the country, even in small and supposedly sealed amounts.
Other nuclear players are also reportedly getting in on the act, from french company Areva to Toshiba and its subsidiary Westinghouse. The small reactors, intended for hard-to-reach locales, military bases, factories or anything else that might not get connected to the traditional power grid easily, will come with substantially reduced price tags compared to traditional nuclear projects. Instead of, say, a $3 billion estimate that likely gets bumped up by a factor of two or three by the time it is completed, Hyperion will ask $50 million.
From Uranium-stocks.net
A visit to their web site tells us that Hyperion Power Generation Incorporated (HPG) are the owners of this small, non-weapons grade nuclear power reactor. Invented by Dr. Otis “Pete” Peterson, in New Mexico, at the Los Alamos National Laboratory which was established in1943. HPG was awarded the exclusive license to utilize the intellectual property and develop a product that will benefit the U.S. economy and global society as a whole.
Before we get too excited they go to say that:
“The next multi-million dollar phase of work on the development of Hyperion, underwritten by private investors”
Altira Group LLC has provided the investment funds required by HPG out of the recently closed Altira Technology Fund V — a $176 Million fund focused on venture capital for energy technologies.
So it looks as though we do not have an investment opportunity at the moment however they may go public somewhere down the line.
This concept was originally conceived as a clean, affordable solution to power mining and industrial operations such as the retorting of oil sands and shale. Other applications and requests for modules now come in daily from around the globe. This takes us back to our original question in wondering just how long it will be before we can all be reasonably independent in terms of our energy needs. As we were rather curious about this idea we put a few questions to Hyperion and received the following answers as listed below from Deborah Deal Blackwell, APR Vice President, Licensing & Public Affairs
Q1 How long will it be before it is available on a commercial basis?
A1 shooting for 2013
Q2 What power generating capacity does it have?
A2 225 MW electric – 70 MW thermal
Q3 How much uranium will it use?
A3 Not much. The whole thing is no bigger than a hot tub
Q4 How many of these plants do you expect to build worldwide etc?
A4 4,000 of the first design
Q5 How much do they cost?
A5 Based on material prices today, we are looking at an initial price of $25 million per module.
Q6 Please have a guess at how much uranium 4000 would use?
A6 Fuel will be a metal compound and we are still working out how much of it will be uranium – sorry, just can’t give you a better answer right now.
Q7 Can you see the day when each industrial facility would have their own unit?
A7 Yes, but at the rate the U.S. is going, it will be 20 years if not more. Ignorance, politics, red tape and just plain laziness is getting in the way of the U.S. making the advancements our country needs in the energy area. This country is moving too slow on reacting to climate change. Those of us in the nuclear industry who understand the key role that nuclear can play in battling climate change, need to form a cohesive bipartisan intense effort to educate the public and our elected officials. It’s all hands on deck!
I bet the French incorporate SMRs (small modular reactors) into their industrial infrastructure – and hopefully they will be our SMRs! – before the U.S. does. France apparently did a good job of pulling its people together to make energy independence through nuclear a national imperative. We need to do the same.
Q8 What about a mini version suitable for the residential market – I know we are pushing it here, but if you don’t have dreams they cant come true.
A8 Again, at least 25 years away in the U.S. because politics, and fear generated by ignorance in the general population is getting in the way.
Hyperion Power Generation have assembled a team of scientists and other capable professionals who intend to develop this product for all of the good uses that we can possibly imagine.
We certainly wish them every success in their endeavours and we will watch for future developments and possible investment opportunities regarding Hyperion.
Any comments? Please feel free to add them to this article.
Have a good one.
If you are new to this web site and wish to receive our free newsletter regarding investment in uranium stocks and updates regarding uranium, then please click here to subscribe.
Precious and base metals are not only critically strategic commodities — but what’s happening in those markets are also blatant signs of what may well be the most urgent financial AND strategic dilemma of our time:
The threat to the cornerstone of our nation, the massive financial and debt crisis and their impact on the value of the U.S. dollar, and hence, your wealth.
So today I am going to review with you why I believe the precious and base metals sectors are critically important to your portfolio.
I will demonstrate for you that the single best defense you can take for your portfolio is to go on the offense — to use precious and base metals investments to protect your wealth from the ravages of a falling dollar and to capitalize on a myriad of wealth-building opportunities.
First, let’s review the major forces that are poised to drive gold, silver, platinum, palladium, copper, aluminum, tin and more — higher and higher.
The forces are explosive, they’re spinning off huge profits … and, they are just beginning …
WHAT ARE THOSE FORCES?
They are the three most powerful economic forces on earth today!
1. Unprecedented demand from Asia.
And … at the same time …
2. An unprecedented financial crisis and debt implosion in the U.S.
Coupled with …
3. An unparalleled bear market in the purchasing power of the U.S. dollar.
So, let’s review these forces so that you fully understand them … how they are impacting the metals markets … and why you should make metals investments a key part of your investment portfolio.
Force #1: Asia.
There’s no question that Asia’s rise in the world is unprecedented. I think everyone would agree with me on that.
And, it’s being led by China’s economy, which has grown at an average rate of about 10% for the last eight years.
Moreover, not only is it just high growth in Asia, it’s growth that’s starting from a level that saw 1.4 billion people in China — and another 1.6 billion people in the rest of Asia — emerge out of absolute poverty.
And now that China and Asia are modernizing, the standard of living of 3 billion people — nearly half the world’s population — is soaring.
I won’t go through all the stats with you. I’ll just pick one or two for now that show you how massive this trend is.
Consider, for instance, car ownership in China: Right now, even after almost two decades of explosive economic growth, car ownership in China is still only about 40 vehicles per 1,000 people, compared to 900 per every 1,000 in the U.S.
If that stat just rises to 100 cars per every 1,000 people in China — which is certainly not a stretch of the imagination — the demand for cars will overwhelm the markets for steel, aluminum, platinum, palladium, rubber, iron, you name it.
That’s just autos!
Even that pales in comparison to what’s happening to the demand for copper and other metals for housing, urban construction, infrastructure projects, and more in Asia.
And, it’s why China in particular has been on a rampage to secure natural resources, especially metals, all over the world.
The pace of China’s acquisitions of natural resource companies is exploding higher! Just look at the history …
In 2002, China made only one deal in natural resource acquisitions. In 2003, two deals. In 2004, another three deals.
In 2005, 11 deals.
In 2006, 25 deals.
In 2007, 33 deals.
In 2008, 53 deals.
In 2009, more than 166 deals, mostly in natural resources!
Asia and China’s demand alone would be enough to send metals prices higher.
But one of my major points today is that it’s not just Asian demand this time around.
Demand for metals, indeed all natural resources — what I call tangible assets, real wealth — is being multiplied many times over by …
Force #2: The great financial crisis that’s enveloped the world.
How so, when one would expect a softening of demand, due to the financial crisis?
Well, this is where you need to put your thinking cap on and see through what’s happening and what Wall Street is telling you in traditional economic-speak.
This is where you need to see through the so-called rules of thumb on recessions and economic crises and see how different today’s times are.
Not only is Asian demand soaring but it’s happening at a time when the world is awash in debt and fiat currency.
That’s particularly true of the U.S., unfortunately. The U.S. is now the most indebted nation on the planet, and those debts — $136 trillion — are having immutable consequences on today’s economy and nearly all asset prices.
Most of all, it’s changing the way they view the dollar! Hardly surprising, when you consider the facts …
- The officially recognized national debt is $13.1 trillion
- Unfunded national obligations of Social Security, Medicare, government pensions and more equal $107.8 trillion
- $1.6 trillion U.S. Federal deficit
- Another $9 trillion in cumulative deficits over the next ten years
- $3.5 trillion owed to foreign investors
- Plus, another trillion dollars for health care reform, no matter what bill finally makes it through Congress
Grand total of U.S debts: 136 TRILLION.
To give you an idea of how big that is, imagine the government could somehow pay off that debt at the rate of $100 million per day, every day starting right now.
Even at that rate, it would take more than 3,450 years before the total government debts and obligations are paid off.
Bottom line: Savvy domestic U.S. and international investors are now realizing what I’ve been warning about for years … that …
America’s massive debts are unpayable!
As a result, the favorite debt solution of central bankers and politicians will be to pay off government debts with ever cheaper currency.
Force #3: The dollar is already in the process of being devalued!
Step-by-step, international investors and international organizations are aggressively pushing to replace the dollar with a new reserve currency, ending America’s supremacy as a global economic power.
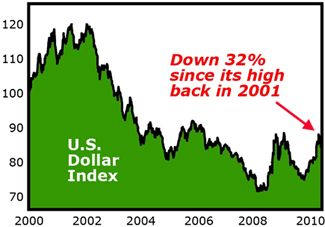
This is also why — despite recent disasters with other currencies like the British pound or the euro — the dollar is still down 32% since its high back in 2001. I repeat, it still lost almost one-third of its value in the past decade.
Moreover, it’s also why the dollar’s role as a reserve currency is being challenged all over the world, and why I believe we are now facing a final day of reckoning for the dollar.
This dynamic — a plunging dollar, a fiat paper currency losing purchasing power — is presenting investors with a whole different ball game. It means that …
If your capital is denominated exclusively in U.S. dollars and it does NOT include a strategy for protection against the falling dollar … you may be ACTUALLY LOSING MONEY WITHOUT EVEN KNOWING IT — AS YOUR MONEY GRADUALLY BUYS LESS AND LESS.
So — to truly preserve your capital and its purchasing power — you may decide you need to go on the offensive with a strategy that includes strategic contra-dollar investments that protect your wealth and allow you to grow it as well.
Just like savvy investors are doing, with tangible assets and resources that not only provide the world with the basic necessities of life, but actually rise in value as the dollars falls.
That’s especially true of precious and base metals — assets that are not only in huge demand from Asia, but that are also contra-dollar plays that typically rise in value as the dollar falls.
Bottom line: These powerful forces — Asian demand, the financial crisis, and the falling dollar — give you a triple tailwind to invest in precious and base metals — and to propel those investments higher to protect and grow your wealth.
Consider the inflation-adjusted charts for commodities like platinum, palladium, aluminum, copper and more.
Most believe that the prices of the precious and base metals are already high, or, that they’ve seen their highs just before the financial crisis hit and that they offer very little upside profit potential.
BUT NOTHING COULD BE FURTHER FROM THE TRUTH!
The FACT of the matter is that the prices of most metals remain cheap on an inflation-adjusted basis — and have loads of catching up to do on the UPSIDE!
These inflation-adjusted charts show you — in no uncertain terms — how cheap metals prices are — and how much higher they could rise, giving you tremendous profit potential to protect and grow your wealth in the years that come.
For instance, consider, just for starters, aluminum.
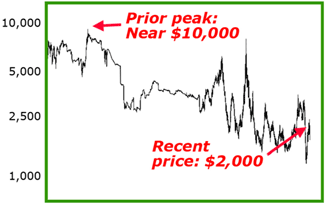
Aluminum’s peak inflation-adjusted price: Near $10,000 per metric tonne back in 1933.
Its recent price: About $2,000 per tonne.
In other words, aluminum is selling for less than about one-fifth of its prior peak value — and could rise more than 400% in price in the months and years ahead.
Or consider, tin.
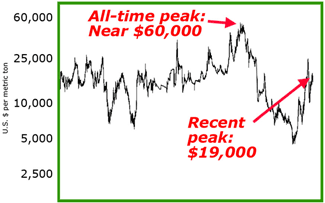
Tin’s all-time peak in 1978 on an inflation-adjusted price: Near $60,000 per metric tonne.
Its most recent price: $19,000 per tonne.
It’s selling for less than one-third its peak value.
Now take a look at copper, perhaps one of the most important base metals of all.
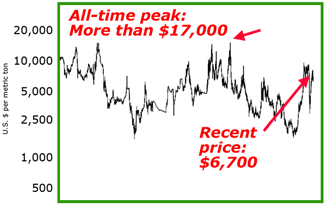
Copper’s all-time peak in 1973-4 on an inflation-adjusted price: More than $17,000 per metric tonne.
Its most recent price: $6,700 per tonne.
Put simply, copper is selling for about 40% of its prior peak value, and can more than double in price in the years ahead, from roughly $3 a pound today to over $6 a pound!
And now, here’s platinum:
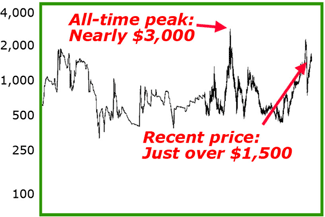
Its inflation-adjusted high: Nearly $3,000 an ounce in 1979.
Its price today: Just a tad over $1,500 an ounce.
In other words, platinum prices are set to DOUBLE.
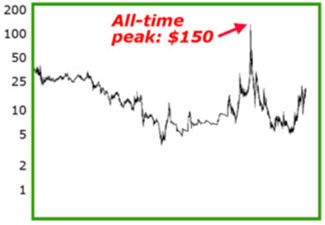
And then there’s palladium, whose inflation-adjusted high was, in 1917, at more than $2,000 an ounce — but is now trading for just $435 an ounce, showing it has the potential to gain more than 400%.

Or silver, which would have to rise almost ten-fold to reach its 1980 high in inflation-adjusted terms!
And most of all, LAST BUT CERTAINLY NOT LEAST, perhaps the most important metal of all: Gold.
In fact, the most common question I get today is whether or not I think gold has reached a peak, and if not, how much higher I think it could go.
So let me answer those two very important questions, right now, head on, and then I’ll move on to show you how to get positioned to reap potential huge profits ahead, not only in gold, but in the other metals as well.
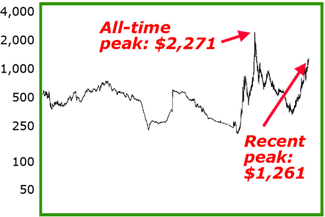
Look at the inflation-adjusted chart in gold again.
Adjusted for inflation — that is the long decline that’s already occurred in the dollar’s purchasing power — at say $1,200 gold, the precious yellow metal is actually selling at just a tad more than HALF its all-time high.
Its previous 1980 peak — in today’s dollars — is $2,271 per ounce.
In other words, gold prices could EASILY double again in just the next couple of years.
Moreover, at $1,200 an ounce, I believe gold investors are banking on the dollar’s purchasing power remaining stable — which it is not going to do.
Not with the financial crisis still roaring …
Not with governments around the world contemplating spending even more money to try and stimulate their economies …
Not with the Federal Reserve continuing to print paper dollars like there’s no tomorrow …
And not with other central banks around the world … in China, India, Russia and more — actually buying up gold reserves to protect themselves from the dollar’s inevitable decline!
That’s why I have three longer-term gold price scenarios for gold that I want you to be fully aware of.
Three Possible Gold Price Scenarios
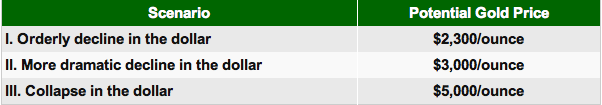
First, I believe that, no matter what, gold is going to hit its inflation-adjusted high of $2,300 an ounce — at a minimum.
But that assumes an orderly decline in the dollar, and an orderly process of phasing in of an eventual new world reserve currency of some kind.
In scenario two, where the world’s currency markets continue to show the kind of volatility that’s recently occurred — with rising global uncertainty regarding the outcome, gold could eventually reach $3,000 an ounce.
And in scenario three, where the dollar falls completely out of bed and the markets take over, I wouldn’t be shocked to see $5,000 an ounce for gold.
The bottom line: Gold is showing you the major forces I’ve already outlined here for you today — that soaring economic growth in Asia coupled with the financial crisis, which is going to inevitably pound the dollar lower, devaluing its purchasing power step-by-step …
… are converging to give you an investment sector that’s perfectly positioned to not only help you protect the value of your money in the months and years ahead, but also give you multiple opportunities for profits.
The next logical question then is: How does one get set up to profit from this amazing situation?
I recommend three general steps investors should take …
Step 1: For ultimate protection, and for future profit potential,
I believe that everyone should have up to 25% of their liquid investment funds in gold and gold-related opportunities.
Naturally, each investor needs to take a look at his or her individual investment needs. There’s no such thing as a one-size-fits-all portfolio. But whether you invest 10% or 25% in gold, I recommend your allocation be further subdivided into four equal units. Using a 25% allocation, here’s how it would break down:
A. I’d put about 6.25% in bullion, in ingots or bullion coins such as the American Eagle or Canadian Maple Leaf. Given the storage hassles and costs, there’s no need to put more than that in bullion.
B. I’d put another 6.25% into the SPDR Gold Trust ETF, symbol GLD, and …
C. I’d put another 6.25% divided equally amongst my three favorite gold mutual funds …
- Tocqueville Gold Fund (TGLDX)
- U.S. Global Investors World Precious Minerals Fund (UNWPX)
- U.S. Global Investors Gold and Precious Metals Fund (USERX)
Then …
D. I’d put the remaining 6.25% divided equally into my top-rated gold mining shares …
- Goldcorp Inc., (GG)
- Barrick Gold Corp., (ABX)
- Kinross Gold Corp, (KGC)
- Gammon Gold, (GRS)
Combined, these gold mining shares own the majority of the gold reserves in the world today, which is a great reason to own them.
Step 2: Diversify beyond gold to the other metals that are benefitting from this environment — rising Asian demand coupled with a long-term bear market in the dollar.
I consider an assortment of my favorite Exchange Traded Funds here …
- ETFS Physical Palladium Shares ETF (PALL)
- ETFS Physical Platinum Shares ETF (PPLT)
- ETFS Physical Silver Shares ETF (SIVR)
- PowerShares DB Base Metals Fund (DBB)
And …
Step 3: I would also consider the intelligent purchase of short- and long-term call options on metals companies, bearing in mind that options are not for everyone, and certainly not for ALL of your money.
They’re volatile, speculative investments. But the purchase of options has two unique advantages: First, you can never lose a penny more than you invest. And second, you get virtually unlimited profit potential!
Lastly …
Step 4: Consider active guidance in the area of metals investing, and all natural resources.
My Real Wealth Report is a perfect example, where I follow these markets intensely giving my subscribers in-depth analysis on the natural resource markets … on Asia … and what’s happening to the dollar on a monthly basis, including all my specific recommendations and timing signals.
If you’re not already a Real Wealth Report member, consider joining now. It will be the best $99 you ever spent. To join, click here now.
Best wishes for your health and wealth!
Larry
This investment news is brought to you by Uncommon Wisdom. Uncommon Wisdom is a free daily investment newsletter from Weiss Research analysts offering the latest investing news and financial insights for the stock market, precious metals, natural resources, Asian and South American markets. From time to time, the authors of Uncommon Wisdom also cover other topics they feel can contribute to making you healthy, wealthy and wise. To view archives or subscribe, visit http://www.uncommonwisdomdaily.com.
-
I know Mike is a very solid investor and respect his opinions very much. So if he says pay attention to this or that - I will.
~ Dale G.
-
I've started managing my own investments so view Michael's site as a one-stop shop from which to get information and perspectives.
~ Dave E.
-
Michael offers easy reading, honest, common sense information that anyone can use in a practical manner.
~ der_al.
-
A sane voice in a scrambled investment world.
~ Ed R.
Inside Edge Pro Contributors

Greg Weldon

Josef Schachter

Tyler Bollhorn

Ryan Irvine

Paul Beattie

Martin Straith

Patrick Ceresna

Mark Leibovit

James Thorne

Victor Adair