
Daily Updates
1. You have just watched the “gold punisher” administer an incredible eleven day beating on the US dollar. From about $1478 to $1610, gold has now risen 11 days in a row.
2. Click this gold chart link now to view (a larger image) the beating, and to view the four buy points you need to be prepared to respond to, if price declines to those areas. In particular, the approx. prices of $1595, $1578, $1560, and $1535 are where you need to be prepared to buy “enhanced” amounts of gold, with US dollars.
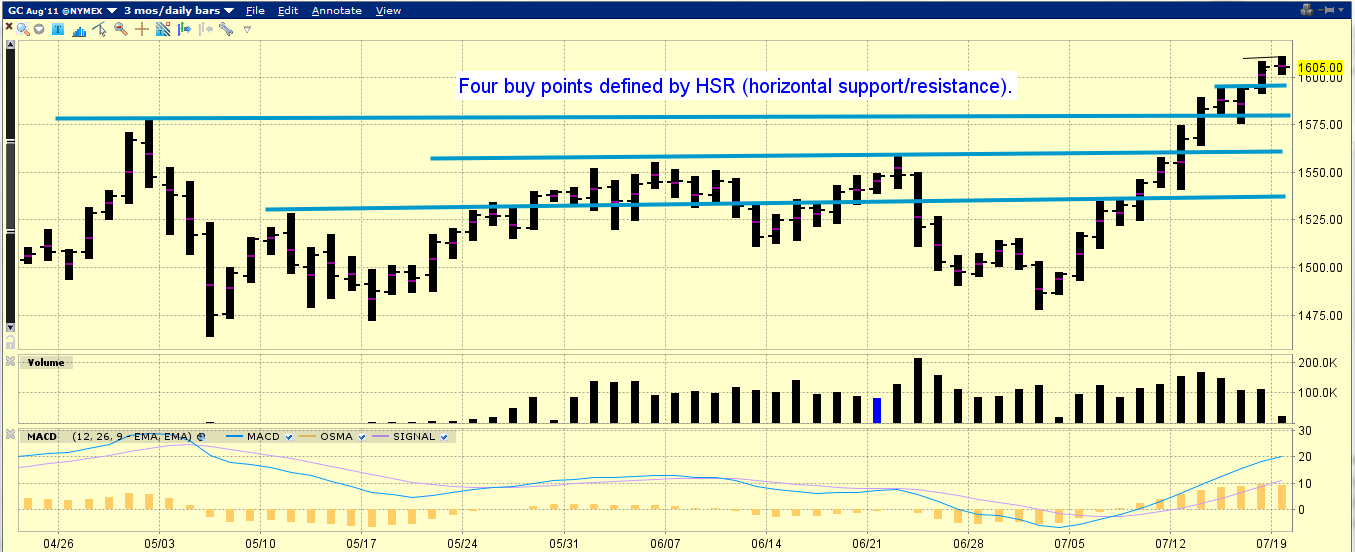
3. Use horizontal support to decide when to buy, and all other technical analysis to tweak how much you buy. If you try to use oscillators like RSI & MACD to decide when to buy, you will be financially destroyed over time.
…read points 4 – 24 HERE
Mark Leibovit, chief market strategist and publisher of VRGoldLetter.com, tells BNN he is now revising his call for the price of gold
Gold Trades Past $1,600!
Well… The dollar is on the hot seat versus gold and silver this morning, but on the opposite side of the burner, the dollar is applying heat to the currencies… Strange, because normally dollar weakness will show up in all non-dollar assets… But not today… And speaking of gold… It’s within spittin’ distance of $1,600 this morning, making those prices at the beginning of the month tiny objects in the rear view mirror!
Final Prices on all charts July 18th/2011
One currency that’s not letting the dollar drag it down, is the Swiss franc (CHF)… The franc just keeps going higher and higher… I saw an article over the weekend that called for the franc to reach parity with the euro (EUR), thus making it the most expensive currency in the world! Of course, some of that reaching parity with the euro will come from the euro weakening…
And as yields rise in the Eurozone peripheral countries like Italy and Spain, the Swiss franc picks up new buyers, and that drives the price even higher! And since everyone believes the problems of Portugal, Greece and Ireland will spread, it’s looking like the franc will be underpinned for some time…
Friday, the Eurozone bank stress test results were revealed, and there were five banks that failed the stress tests, but like I told you Friday, the markets were already punishing the euro, because they believed the stress tests were limited in their bite… So, while the results showed that five banks had failed, the damage to the euro was already being priced in…
That feeling of selling euros on Friday carried through to the overnight market last night, even after being given a couple of days to simmer down… There will be a “summit” of Eurozone leaders this week, on the 21st, so any strength that the euro might show ahead of that meeting would be short-lived, for all eyes will be on the Eurozone leaders’ resolve… European Central Bank (ECB) President, Trichet, still believes that the Eurozone can win this situation, by showing will and determination… He said, “It is not a question of technique. It is a question of will and determination.”
He went on to clarify the ECB’s position on collateral they hold, and here, this is important… Because the ECB’s credibility is at stake… Trichet said, “If a country defaults, we can no longer accept as normal eligible collateral defaulted bonds issued by the government of that country. Because, in the eyes of the Governing Council, this would impair our ability to be an anchor of confidence and stability.”
OK… I think it was important for Trichet to make a stand like that… Now, he just needs to make certain that the ECB doesn’t have to eat those words… I also hinted a message that Trichet was sending to his fellow central bankers around the world, namely the Federal Reserve… It was like he was saying… “We’ll never do what the Fed did”!
Or maybe that was just me thinking that… Because I always read into what people are saying…
Well… The US lawmakers didn’t invent a debt hoola-hoop this past weekend… But it looks like the NFL is about to end their lockout in time to start the season… The lawmakers are still pointing the blame finger at each other for not getting this thing worked out… I saw a letter that Judge Andrew Napolitano wrote to the Speak of the House, John Boehner… Telling the Speaker that he needs to make a stand and not raise the debt ceiling… Very interesting letter…
On Friday, US CPI (a stupid index!) printed and showed that inflation in this country fell -0.2% in the month of June! Don’t ask me how they arrived at that figure, because I doubt the government accountants know exactly what goes into the calculation! But, hey! There it is, right there! The government is telling you, to not worry about inflation… Because… In their eyes, it’s only “transitory”… Which if you believe what this report is telling you, then the government was right about the inflation being transitory…
Well… Here I go into the conspiracy theory room again… Stay with me on this one, because it all makes abundant sense… Big Ben Bernanke pushed quantitative easing rounds 1&2, on the grounds that the economy wouldn’t grow with deflation all around (still fighting deflation he was)… The other day, he mentioned that if the economy stalled, or deflation rose, he would be willing to do more QE… Well, just two days after saying that about deflation… US CPI for June fell -0.2%! So… Big Ben could very easily point to deflation again… We all know that CPI since the mid-’90s has been so hedonically adjusted that no-one that uses today’s methodology really knows for sure what CPI is… John Williams over at Shadow Stats, still computes inflation using pre 1990 methodology… So, he knows!
So, what I’m trying to say here is that, could this all be part of the plan to allow the Fed to implement another round of QE, and do so on the grounds of “deflation”? I think so… But that’s just how I roll…
Industrial production in June was better than May’s -0.1%, but still not what the forecasters were thinking it would be, and Capacity Utilization remained unchanged versus May… So… There’s no sign of a recovering economy there, folks… No sign at all!
Today, we get the “once important but nobody pays attention anymore” TIC flows… You know the data formerly known as the “Net security purchases by foreigners” report… The buying of our debt has not been close to covering the trade deficit each month, but what happens is that the report showing the lack of funding, prints a month after the trade figures does, so, being the “what’s happening today” kind of traders, they don’t have the time or capacity to go back and see that the trade deficit for May was $50.2 billion… Anything less than that in the total net TIC flows should be a hammer on the dollar… But we haven’t been covering the deficit for so long now that nobody cares… Well, nobody but me…
OK.. Enough of that “data talk” in the US… Let’s go elsewhere for our giggles…
And that place is New Zealand… Last week New Zealand posted a very strong second quarter GDP report, especially in the face of the earthquakes that have disrupted the economy there. Now it has printed a much stronger than expected CPI report… New Zealand inflation picked up 1% last month and 5.3% year on year! So… A strong GDP report followed by a strong inflation report has the New Zealand dollar/kiwi (NZD) holding on to the 84-cent handle with ease, while currencies around the world have difficulty handling the dollar strength.
Well… While I was just typing away here, gold has moved past $1,600! And silver has climbed back to $40! The uncertainty of the US not reaching a debt ceiling resolution, and the debt picture of the peripheral countries of the Eurozone, are really responsible for this latest push in gold and silver… I think we’ll see gold hover around $1,600, going back and forth above and below $1,600 for a while, like we saw it do at $1,000, $1,100, $1,200, $1,300, $1,400, and $1,500… I know I’m not the sharpest tool in the shed, but I think a see a pattern here! HA!
Before the article continues below, here is a comment on Silver by:
Bull markets have a tendency to carry all the troops along with it, and the bull market in precious metals is not about to ignore silver. Thus, all those who got frightened or disgusted with silver and sold out — are now looking at the chart below and “licking their wounds.”

Gold Trades Past $1,600! continued below:
And then this story came across my computer this past weekend, saying that 1 in 7 Americans are now on food stamps… Here’s a snippet from The Economist… “Participation in the US food stamp program has surged, with 1 in 7 Americans relying on it to have enough to eat, according to The Economist. Moody’s Analytics found that spending $1 on food stamps generates $1.73 in economic activity, which makes the program the most effective stimulus.”
Of course, The Economist, being what it is, would believe that you should send food stamps to each and every individual whether they can afford to have them or not! So, don’t take that part from the snippet… Take the other part of it: 1 in 7 Americans being on food stamps… That’s just unreal to me…
When I was a young boy, my dad – who was a truck driver, and didn’t get paid if he didn’t work – seemed to be on strike all the time, and our family got “assistance”… I’ll never forget that… I was embarrassed at the time, and still carry that with me… One of the reasons I went to work when I was in the 7th grade, working evenings, going door-to-door selling newspaper subscriptions, so that I would have “my own money” and never need “assistance” again… The point I’m making here is that it’s not something that these 1 in 7 people want… I know…
Then there was this… My friend, whom I’ll see again next week in Vancouver, Addison Wiggin, orchestrates a great daily letter called The 5 Minute Forecast, or The 5… On Friday, Addison was talking about how he thought that, in the end, US lawmakers would make some backroom deal and raise the debt ceiling, without any spending cuts to speak of…. He went on to say…
That was averted when the White House and Congress agreed to $38 billion in spending cuts. That was all supposed to take place during the current fiscal year.
Never mind that during the three weeks the politicians tangled over this, the national debt ran up by $41 billion. But it gets better: The Congressional Budget Office put the accountants to work, figuring out how much of the savings were real, and how much were just an accounting fiction.
Actual savings – only $352 million. Out of a $1.65 trillion deficit, that works out to 0.02%.
Let’s hope in our heart of hearts that “real spending cuts” are made this time…for our kids’ and grandkids’ futures…
To recap… Gold has rallied to $1,600 this morning, and silver is back to $40! Other than Swiss francs and yen (JPY), the dollar is swinging a mighty hammer, this morning… The New Zealand dollar/kiwi is holding on to 84-cents and only slipping slightly. US CPI printed at -0.2% on Friday… Can you believe that? And the Swiss franc should be underpinned for a long time, due to the problems of the US, the Eurozone, and the Middle East…
Chuck Butler
for The Daily Reckoning
Chuck Butler is President of EverBank® World Markets and the author of the popular Daily Pfennig newsletter, which is reposted here at The Daily Reckoning. With a career in investment services and currencies extending over 35 years, Mr. Butler oversees all aspects of customer service and the trading desk for EverBank World Markets. A respected analyst of the currency market, Mr. Butler has frequently made appearances or been quoted by the national media. These include the Wall Street Journal, US News and World Report, MarketWatch, USAToday, CNNfn, Bloomberg TV, CNBC, and the Chicago Tribune. Mr. Butler was previously the Chief International Bond Trader and Director of Risk Management for Mark Twain Bank, and has held significant positions in the investment industry since 1973.
For additional information visit EverBank
The dollar is and has been in a strong down trend for many years and I feel as though it’s getting close to another major land slide. It could take place any time in the next month or so according to my weekly chart analysis.
The general rule is if the dollar falls in value then we tend to see both stocks and commodities rise. The inverse relationship at times can be tick for tick meaning if the dollar ticks down one increment then we see the broad market or specific commodities move in the opposite direction at the same time.
Since 2009 the relationship between the dollar and investments has been so close that if you were to just focus on what the dollar was doing then you could almost trade equities and commodities without reading their charts. The dollar index chart is one of those trading tools everyone should be analyzing. At $80 a month for getting the dollar index data feed it’s not a cheap trading tool…
Dollar Index 4 Hour Candle Stick Chart:
This chart clearly shows this month’s price action for the dollar which is pointing to lower prices if things play out according to the charts. This short term chart shows that in the next day or so we should see the US dollar start to sell back down.

SP500 Daily Chart (Stock Market):
The SP500 index is a great barometer of what the overall stock market is doing. The chart below shows the 5 and 14 day simple moving averages and their recent crossovers.
Last Friday we had a bearish crossover and if the market does not rally early in the week then I am anticipating further weakness in stocks. While I am still bullish on stocks as of this moment the coming week will quickly tell us what stocks are going to do. If we get a bounce which turns into a strong follow through rally then we should see a sizable rally around the corner and also a falling dollar.

Gold Weekly Chart:
Back in May when gold was hit with strong distribution selling I posted my thoughts on how gold could be forming a 6-12 month topping pattern and how price could get choppy. Well, we are now entering that period which could prove to be interesting…
Keep in mind this is a weekly chart and from the looks of things this top could play out for another 5-6 months from here. Silver is in much of the same predicament but trading way below its May high. I’m thinking more of a double top in silver over the next few months.

Weekend Trend Trading Conclusion:
In short, I am bearish on the dollar for a week or so which should help boost stocks and commodities. After that we could see all investments make some big trend changes if buyers don’t step up to the plate to buy. If we any major headline news about the sky is falling then it could trigger a sharp correction. Unfortunately, at this time head line news is running wild spooking investors from buying much of anything other than gold. Any resolution to foreign economic issues will put pressure on both gold and silver and likely help boost stocks.
The past month I have been very cautious because the market is wound up and ready to explode in either direction. During times like this I prefer to stay mostly in cash until I get low risk setups and a clear trend.
That’s all for now, but if you would like to get my pre-market video analysis of the dollar index, each morning and intraday updates along with my trade alerts be sure to join my premium service at $59 a month which is less than the cost for the dollar index charting data feed!
Join Now: http://www.thegoldandoilguy.com/free-preview.php
Chris Vermeulen
My name is Chris Vermeulen the Founder of TheGoldAndOilGuy. I have more than a decade of extensive experience trading stocks, indices, ETFs, CFDs and Futures. My trading style has been thoroughly refined over the years, blending the best cutting-edge approaches that have only been possible with modern systems and diverse technologies. I believe I represent the ideal combination of trading styles and trade setups including a number of trading breakthroughs entirely on my own.
It is this blend of the time-tested and innovatively new that allows me to take advantage of bull, bear and flat markets regardless of how each week plays out. I’ve repeatedly observed that one of the biggest keys to making a lot of money in challenging markets involves aiming for big, quick returns, while maintaining an extraordinary focus on minimizing risk. This may be what most distinguishes what I provide vs. the experiences delivered by the vast majority of other newsletters.
More simply, I hate to lose on any trade, so I’ve evolved my own models with an emphasis on yielding a superior win ratio, without having to be too conservative on the types of trades I’ll take. I can aim high so that we can win big… but when we lose, we aim to always pinch those losses as small as possible. Many of my competitors tout crazy high profit potentials, but they seem to employ models that deliver crazy high loss realities for their subscribers. How they stay in business, I don’t understand. What I do understand is that subscribers must see bottom line results. While at a quick glance my strategy does not look real exciting, remember I post real numbers/results that members and myself have made. Also my daily videos and intraday updates help individuals scale out at better prices than what is posted on the track record. So I think it’s my consistency in winning that moves them to offer such glowing praise.
My company- Technical Traders Ltd.- has thoroughly established a stellar reputation as a provider of lower risk solutions for subscribers seeking bigger returns without the roller coaster risk. You’ve probably seen me on many of the websites and publications listed in the right column, or perhaps in others not included. I’m proud of the fact that so many find what I have to offer so valuable. My goals are simple: to provide my subscribers with novice-friendly analysis, the very best cherry-picked recommendations & outstanding trader education and, MOST IMPORTANTLY, to help people just like you make a lot of money while growing their trading knowledge & confidence.
The market is something I literally think about every waking hour. My life’s work is to not only out-perform the market each year but to also make some real money. I share the fruits of all that labor with my subscribers, always striving to deliver value well beyond my subscription fee. There is no other business more intriguing, exciting or potentially more profitable than being involved in the markets! And I believe my thoroughly proven trading strategies are as straightforward and simple as they can get. Join me and I’ll work extraordinarily hard toward helping you grow as a trader while realizing opportunities and profits beyond your expectations.
Interview: Trading Expert Helps Investors Learn the Ropes
Chris Vermeulen
CEO & Founder, Sign up Today.
-
I know Mike is a very solid investor and respect his opinions very much. So if he says pay attention to this or that - I will.
~ Dale G.
-
I've started managing my own investments so view Michael's site as a one-stop shop from which to get information and perspectives.
~ Dave E.
-
Michael offers easy reading, honest, common sense information that anyone can use in a practical manner.
~ der_al.
-
A sane voice in a scrambled investment world.
~ Ed R.
Inside Edge Pro Contributors

Greg Weldon

Josef Schachter

Tyler Bollhorn

Ryan Irvine

Paul Beattie

Martin Straith

Patrick Ceresna

Mark Leibovit

James Thorne

Victor Adair