Spending on Housing Dropped 12% in Canada in June
07/26/2018 6:18 PMCanadian housing data continued to disappoint in the month of June. As sales dipped, so too did the total amount spent on real estate. The total dollar volume dipped 12% year-over-year in June, totaling C$23.5 billion. A tough blow to government tax coffers which have...
read more
Nasdaq slumps as Facebook suffers biggest one-day drop ever
07/26/2018 4:10 PMInvestors are giving a thumbs down to Facebook’s quarterly report. U.S. stocks mostly fell on Thursday, with technology stocks leading the Nasdaq sharply lower as Facebook shares plummeted in their biggest one-day drop ever following...
read more
Tech Alert
07/26/2018 2:41 PMThe $NDX keeps moving from new highs to new highs driven by a narrow group of stocks. Nothing new about that as this trend has been ongoing for some time and headlines of new record prices for such stocks such as $FB, $AMZN, $GOOGL, $MSFT are now a daily occurrence. The untouchables. Jeff Bezos is worth $140B, no that was so last week, now he’s worth $150B.
How do you quantify risk in a market that prices in no risk?
While most people are focused on stocks prices one underlying issue that appears to be largely ignored by participants is the unprecedented market capitalization expansion we are witnessing in these few select stocks.
The numbers are simply staggering. Magic money out of thin air.
$FB, $GOOGL, $AMZN, $MSFT and $AAPL. These 5 stocks now worth nearly $4.1 trillion. That makes these 5 companies the 4th largest economy of the world if you use GDP as a reference. Not bad for less than a million people employed at these 5 companies.
Now check this out: Their combined market cap increase? $260,000,000,000. That’s $260B. In just the past ELEVEN trading DAYS!
No seriously:


Oh it gets better.
2018 year to date? EIGHT HUNDRED TWELVE BILLION DOLLARS market cap expansion in just 6.5 months. $812,000,000,000. That’s a company the size of a $MSFT or $GOOGL in its own right.
read more
About The Semiconductor Sector
07/26/2018 2:16 PMI’ve bludgeoned you over the years about how the Semi signal in January of 2013 was the first real proof that the positive economic cycle that is so readily obvious now was in play. We used the Semi Equipment book-to-bill ratio first and foremost per my little graphic here…

The theoretical progression was to be along the lines of Semi Equipment → Semi → Broad Tech → Manufacturing → Employment = Widespread acknowledgement of a strong economy. ![]()
So last year we (NFTRH) began the process of evaluating the reverse of the above, that would start the clock ticking on the “widely acknowledged strong economy”.
But in this age of interconnected information and sound bites flying at us with the power of 10 billion butterfly sneezes it is important to realize that the markets and especially the economy can move like aircraft carriers trying to turn in waters filled with all sorts of hyper active sharks, PT Boats, day traders, casino patrons, men, machines, substance abusers (info junkies) and Ma & Pa all trying to make some coin. In other words, the process can be real slooooow. Just as it was in turning to the positive side half a decade ago.
As the mainstream media were feeding this garbage to the masses… Fund manager looks beyond FAANG stocks and finds even bigger winners for 2018 … we took exception and did a little digging into the fundamentals, just as we did back in 2013.
NFTRH first included this daily chart of two premier fab equipment companies (as mentioned in the MSM article linked above) vs. the broad Semi sector. The first breakdown came in February.
read more
Proponents for Higher Corporate Taxes Aren’t Going to Like This
07/26/2018 1:51 PMMichael has the results of a CD Howe Study that concludes that increases in payroll taxes are passed almost entirely to workers in the form of lower wages. Another study concludes that wages in Provinces drop by more than a dollar when corporate tax revenues...
read more
Trump Juncker Progress on Trade Sends Stocks Surging
07/26/2018 1:46 PMTodd Market Forecast for 3pm Pacific Wednesday July 25, 2018. Dow +172 on 690 net advances NASDAQ COMP +91 on 381 net advances SHORT TERM TREND Bullish INTERMEDIATE TERM Bullish STOCKS: Today the analysis is pretty easy. President Trump and EU Commission President,...
read more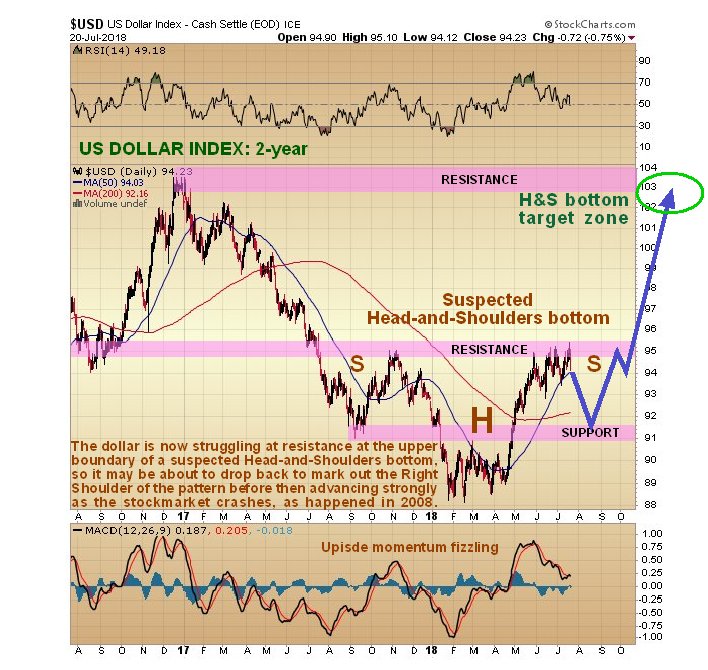
Copper, Gold, Platinum, Silver, US Dollar updates at KEY JUNCTURE…
07/25/2018 2:21 PMCommodities, including gold and silver, have plunged to become so deeply oversold that a snapback rally looks likely soon, that could be sharp as if they turn up here it will trigger a wave of short covering. Such a rally is likely to be sparked by a dollar reaction, as we will see, but it is likely to be followed by further heavy losses across the sector if a general market crash ensues as expected.
We will start by looking at the latest dollar index chart, as a dollar reaction here will be what ignites a commodity rally. The 2-year chart for the dollar index shows that the dollar is rounding over beneath a zone of resistance that dates back to a reversal that occurred at this level last October and November. The pattern that has formed from last July looks like a large Head-and-Shoulders bottom with the Right Shoulder of the pattern about to form. If this is what it is, it implies that the dollar will in due course go considerably higher to the 102 – 104 area, which we can expect to happen during the market crash phase, but first there is the little matter of the Right Shoulder forming to balance the pattern, and if a more or less symmetrical Right Shoulder forms then we are looking at the dollar dropping to the 91 – 92 zone over the near-term, which will be sufficient to generate a significant snapback rally in commodities, that, as mentioned above, is likely to be magnified by short covering. That is the theory that I have and which is mine and what it is too.

So now let’s proceed to review the charts of a range of important commodities – copper, gold, silver, and platinum and their respective COT charts, which will give us more of an idea regarding how likely it is that they will soon rally. 1-year charts are selected to enable us to relate them directly to the COT charts which are also for 1-year. Starting with gold we see that it has accelerated into a deeply oversold state on its MACD indicator and relative to its moving averages, with the drop from its April peak clipping $150 off its price at its April peak. Clearly gold didn’t take kindly to the dollar’s latest rally. Gold’s accumulation line has held up well, however, which increases the chances of a snapback rally imminently, which will be augmented by sudden short covering as mentioned above.
read more
The last time we saw this gold skyrocketed $300!
07/25/2018 2:03 PMHere is a special update on the gold market from Jason Goepfert at SentimenTrader: Optimism on gold dropped to one of its lowest levels in its 7-year bear market, and the lowest since December 2015. When holding through all days when sentiment was this low, gold’s...
read more
The Do’s & Don’ts of Buying An Island Property
07/25/2018 1:57 PMOzzie goes over a comprehensive list of factors to consider if you're inclined to buy an Island property off the coast of...
read more
Trump-Juncker meeting in focus, Lira crumbles
07/25/2018 1:53 PMAsian stocks have commenced on a positive note this morning, as strong U.S. corporate earnings and optimism over China boosting fiscal support for its economy rekindled risk appetite. European markets could benefit from the risk-on sentiment; however, gains may be...
read more