
Timing & trends

Advocates of government stimulus are running victory laps on recent developments that appear to vindicate their strategy. In particular, Paul Krugman compares the sluggish growth in Europe to the somewhat-less-sluggish growth in the US to prove that stimulus was more effective than austerity. Other economists are using government inflation measures to defend Fed Chairman Bernanke’s easy-money policy. The only problem is, they’re calling the race before the finish line is even in sight.
As usual, Paul Krugman overlooks basic economics (which, despite his Nobel Prize, is a science about which Mr. Krugman really knows very little). The reason stimulus is so politically popular is that it appears to work in the short-term. However, appearances can often be deceiving, as they are right now in the US. Stimulus merely numbs the pain of economic contraction, as the underlying trauma gets worse. Austerity might slow an economy down, but at least the wounds are able to heal. America has chosen the former and Europe the latter, albeit not quite as large a dose as needed. The fact that in the short-run Europe is suffering more than the US does not vindicate Washington’s approach. On the contrary, this is exactly what is to be expected.
What we’re seeing is like a race where each runner has a broken ankle. One has a coach who tells him to pace himself and not worry so much about winning this one, while the other coach gives his runner a shot of painkillers and tells him to give it all he’s got. Of course, early in the race, the doped-up runner is going to be flying down the track like nothing’s wrong, while the other runner might be limping at half his normal speed. However, when the drugs wear off, the sprinter is liable to collapse from pain, leaving the better-coached runner to limp across the finish line.
The true test is not the immediate effects of stimulus or austerity, but the long-term results. For that reason, Krugman’s conclusions are meaningless. The apparent success of stimulus simply results from spending more borrowed money on government programs and consumption. But don’t we all agree now that this is exactly what caused the financial crisis in the first place?
As far as inflation is concerned, a vindication of Federal Reserve Chairman Ben Bernanke is equally premature. First of all, it’s not that Quantitative Easing will lead to inflation; it’s that QE is inflation. Secondly, there is a lag between QE and rising consumer prices, so the jury is still out as to how high consumer prices will ultimately rise as a result of current and past Fed policy mistakes.
But even more fundamentally, it is absurd to look solely at government price measures, which are built to understate inflation, and conclude that QE has not already produced an elevated cost-of-living. For example, the 2.4% rise in the Personal Consumption Expenditure (PCE) Index in 2011 is more of an indictment of the accuracy of the index than a vindication of Bernanke. In fact, of all the ways the government purports to measure inflation, the PCE is perhaps the most meaningless, as it relies on built-in mechanisms like goods substitution to hide a lower standard of living. As an example of how this works, imagine you are used to eating farm-fresh butter but have to switch to cheaper but also less-healthy margarine from a factory; the PCE would say you are no worse off. That’s exactly why the Fed chooses to use this uncommon metric.
Mark Gertler, an economics professor at New York University, argues that even the Consumer Price Index, which rose at a more vigorous 3.2% in 2011, proves Bernanke’s critics wrong. According to Gertler, the CPI has risen at an average annual rate of 2.4% thus far under Bernanke’s tenure, significantly less than the 3.1% average under Alan Greenspan, and the 6.3% under Paul Volcker. However, Gertler overlooks two key points. First, the methodology used to calculate the CPI was much different during the Volcker era. If we still calculated the CPI the way we did then, the numbers would be much higher for both Greenspan and Bernanke. Second, given the huge economic contraction that has taken place under Bernanke, consumer prices should have fallen– significantly. The fact that they rose anyway indicates tremendous inflation.
Of course, the Fed’s ability to stimulate the economy with inflation only works as long as bondholders remain ignorant of its plan. For now, the seemingly hopeful news reports are giving the Fed cover to keep stimulating. As long as the market remains convinced there is no inflation, the Fed can continue to create it. However, once the effects are so pronounced that even the PCE can no longer hide them, the Fed will be in a real bind.
Think of our two runners again. Even after the race is over, the fellow who chose to dope up likely injured himself even further. He might have even ended his career. So, the early dash and the cheer of the crowd in that one race was clearly not worth the many years of misery he would incur in the future.
Regardless of what the triumphant Keynesians would have you believe, my analysis continues to be that the current combination of monetary and fiscal stimulus is driving us toward disaster. Instead of a real recovery, the US will experience an inflationary depression. Europe, on the other hand, will suffer much less, precisely because it was not seduced by the short-term appeal of stimulus.
For an in-depth look at the prospects of international currencies, download Peter Schiff’s and Axel Merk’s Five Favorite Currencies for the Next Five Years.
Subscribe to Euro Pacific’s Weekly Digest: Receive all commentaries by Peter Schiff, John Browne, and other Euro Pacific commentators delivered to your inbox every Monday.
For a great primer on economics, be sure to pick up a copy of Peter Schiff’s hit economic parable, How an Economy Grows and Why It Crashes.

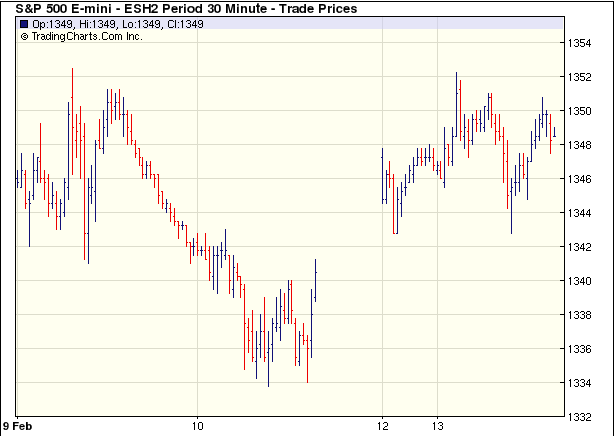
For the first time since the last week of December of 2011, the S&P 500 Index closed lower on the weekly chart. Recently I have been discussing the overbought nature of stocks based on a variety of indicators. However, the real question that should be asked is whether last week was just a short term event or if we see sustained selling in coming weeks.
….read it all HERE
The Dow made another post-financial crisis rally high Thursday as it approached the 13,000 level. To provide some perspective to the current Dow rally that began back in early October 2011, all major market rallies of the last 111 years are plotted on today’s chart. Each dot represents a major stock market rally as measured by the Dow. As today’s chart illustrates, the Dow has begun a major rally 28 times over the past 111 years which equates to an average of one rally every four years. Also, most major rallies (78%) resulted in a gain of between 30% and 150% (29.8% to 150.5% to be exact) and lasted between 200 and 800 trading days (9.5 months to 3.2 years) — highlighted in today’s chart with a light blue shaded box. As it stands right now, the current Dow rally (hollow blue dot labeled you are here) would be classified as well below average in both duration and magnitude.
To subscribe to Chart of the Day go to the http://www.chartoftheday.com and sign up.
(Marc Faber suggests preserving your wealth with 25% of your portfolio in this basket of high yielding (5%), high-quality stocks) –
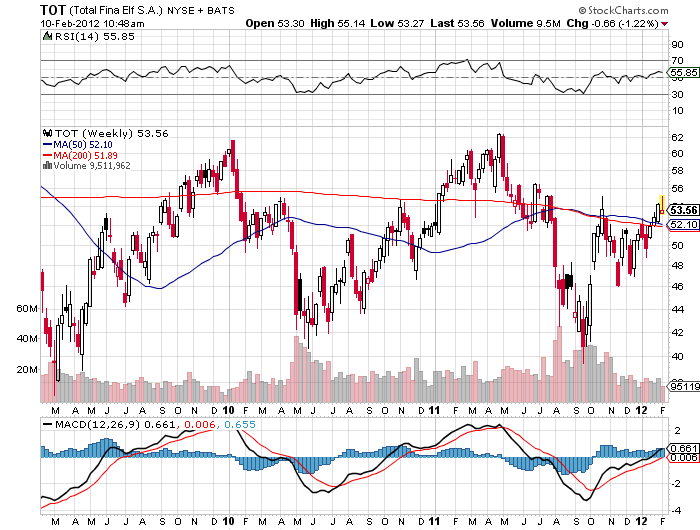
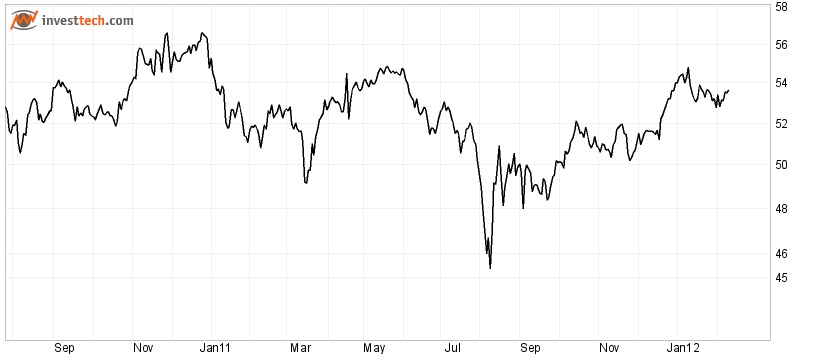
There is a huge amount of underground lending throughout Asia. Mr. Bernanke can drop his dollar bills on the U.S., but the growth in dollars here can lead to strong economic growth and inflation in other countries. That has happened in the past few years. I am the most bearish person you can imagine on earth, which is why I recommend putting, say, 25% of your money in equities, 25% in precious metals, 25% in cash and bonds and 25% in real estate. These assets won’t go up substantially this year, but they could preserve your wealth. People say large-capitalization stocks are inexpensive, and I agree. I would buy a basket of high-quality big-caps in Europe and the U.S. You can by Total [TOT], in France, which yields more than 5%,
and Nestlé [NESN.Switzerland]
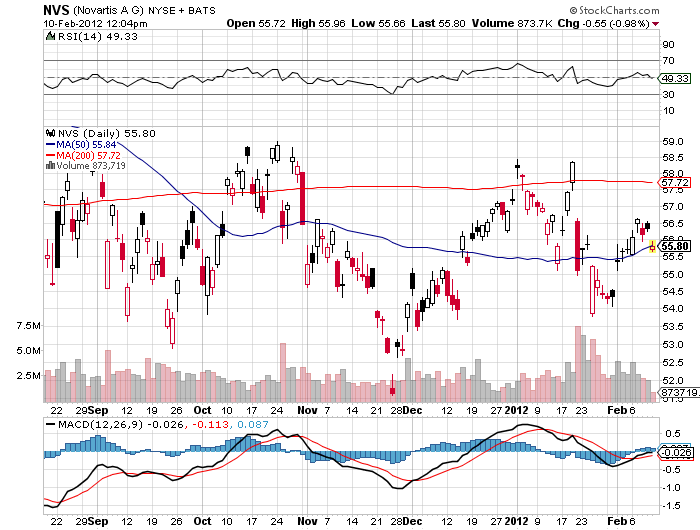
and Novartis [NVS]
and Pfizer [PFE].
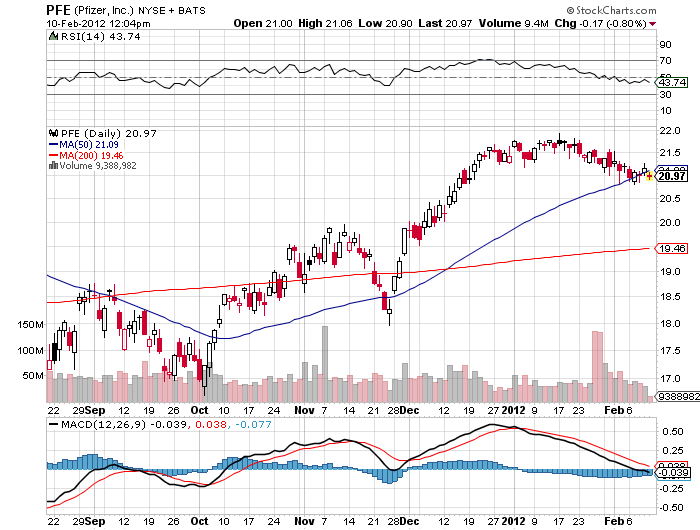
These stocks don’t have huge downside risk.
Because emerging markets saw big declines last year, you could also buy SATS [SATS.Singapore], in Singapore, which provides catering services to the airline industry and ports. It yields 5% and trades for 13 times earnings. I also like K-REIT Asia Management [KREIT.Singapore], a real-estate investment trust that yields 7%. The stock has fallen by about 50% and the dividend might be cut. But even if it is cut to 4%, this is an OK investment. These stocks won’t go up right away, but reinvesting dividends will yield an adequate return over time. StarHub [STH.Singapore], the mobile-phone company, yields 6.9% and the P/E is 14.
Read more articles at Marc Faber’s Financial Doom Blog HERE

The Federal Reserve recently announced important policy changes after its Federal Open Market Committee (FOMC) meeting. Here are the three most important takeaways, in its own words:
1.The Committee decided today to keep the target range for the federal funds rate at 0 to 1/4 percent and currently anticipates that economic conditions – including low rates of resource utilization and a subdued outlook for inflation over the medium run – are likely to warrant exceptionally low levels for the federal funds rate at least through late 2014.
2.The Committee judges that inflation at the rate of 2 percent, as measured by the annual change in the price index for personal consumption expenditures, is most consistent over the longer run with the Federal Reserve’s statutory mandate. In the most recent projections, FOMC participants’ estimates of the longer-run normal rate of unemployment had a central tendency of 5.2 percent to 6.0 percent.
3.The Fed released FOMC participants’ target federal funds rate for the next few years.
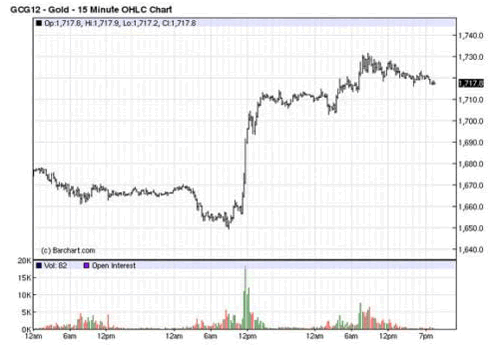
The first item is the most important as it was not expected – and it had an immediate effect on markets. As seen in the chart below, gold spiked higher on the surprise news of extending the zero-rate policy through 2014.
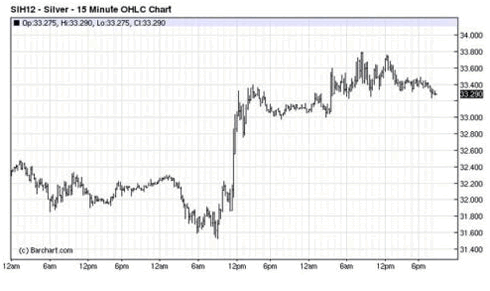
The news prompted a similar jump in silver services:
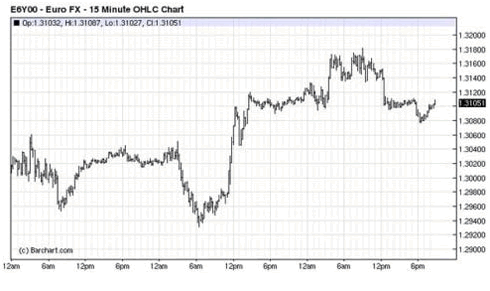
Keeping rates low requires the Fed to print new money to buy Treasuries, so the dollar weakened against the euro, although the reaction wasn’t as big as in those in the gold and silver markets. This is partially due to the fact that the ECB is on its own campaign of printing money.
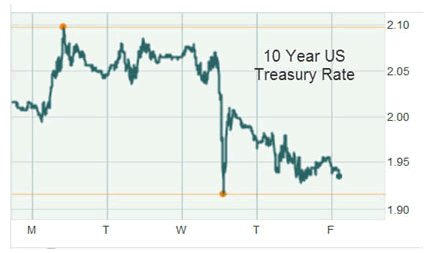
The promise to keep short-term rates low for a longer period also caused longer-term rates to fall slightly, as seen in the 10-year Treasury rate chart below, which fell from about 2.05% to 1.95 %, a relatively modest decline.
What Does This Say about the Fed’s Policy?
The most important action of the three was to extend the zero Fed funds rate to the end of 2014. This is a form of easing that could affect more rates than just short-term rates. Furthermore, there is a debate as to whether the action was the result of the Fed’s concern about the economy slipping back into recession. Or, this could also be a bullish sign for the economy and stock market, as the guaranteed low rates could increase investment to improve our economy. Zero rates drive investors to take on risks – such as buying stocks – to gain higher returns. As a result, this induces more investment toward riskier parts of the market, which might otherwise be underfunded. Though the Fed aims to stimulate the economy, we’re more likely to see a slip back into recession rather than see an effective Fed stimulus improving the economy.
The press conference suggested that quantitative easing (QE) remains on the table. As a result, new targeted asset purchases by the Fed are likely in our future. These additional purchases with newly printed money could become inflationary. That is why gold shot higher and the dollar weakened in the short term.
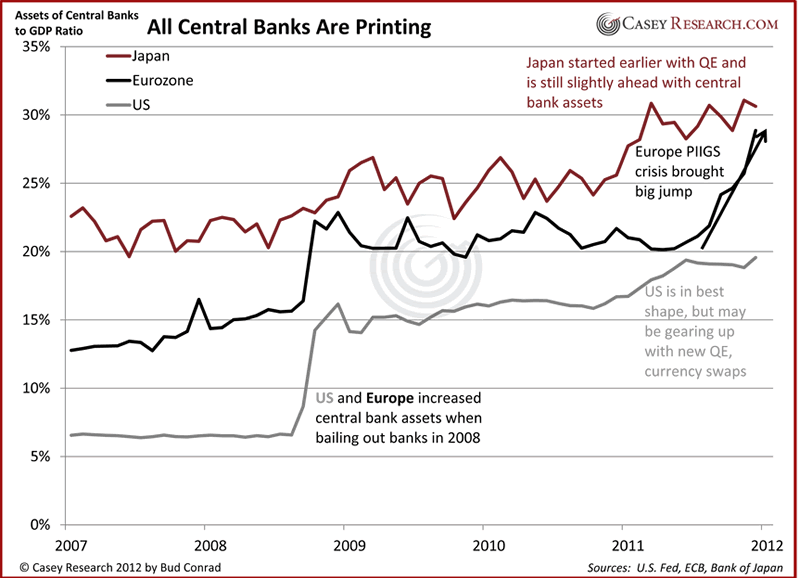
Both the Fed and the ECB have decidedly less-hawkish members and leadership than just last year. Both have now moved toward more money printing to keep rates low. The chart of central bank balance sheet as a ratio to GDP shows that the central banks of the world are clearly “printing”:
Longer-Term Implications
The problem with printing money and promising to do so for years ahead of time is that the negative consequences of inflation only happen after a delay. As a result, it’s difficult to know if a policy has gone too far until years down the road at times. Unfortunately, if confidence in the dollar is lost, the consequences cannot be easily reversed. One problem for the Fed itself is that it holds long-term securities that will lose value if rates rise. The federal government faces an even more serious problem when interest rates rise, as higher rates on its debt mean greater interest payments to service. Due to this federal-government debt burden, the Fed has an incentive to keep rates low, even if the long-term result is higher inflation. However, for now the Fed’s statement suggests it sees inflation as “subdued,” so it’s putting those concerns aside for now.
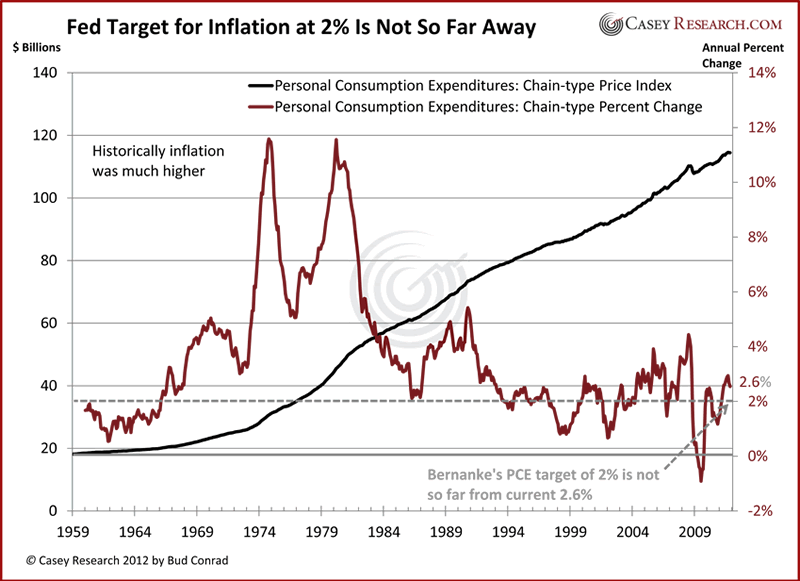
Along with the promise of low rates, the Fed for the first time gave an inflation target of 2%, as measured by Personal Consumption Expenditures. The actual and target inflation show that the Fed is currently not under major pressure from missing its target… not yet.
The Fed has not even tried to set a target for the unemployment rate, which is only expected to edge below 8% by 2013. The Fed says that that the longer-run unemployment range is 5% to 6%. The big difference from the current level of 8.5% indicates that the Fed faces a greater challenge with unemployment than inflation now.
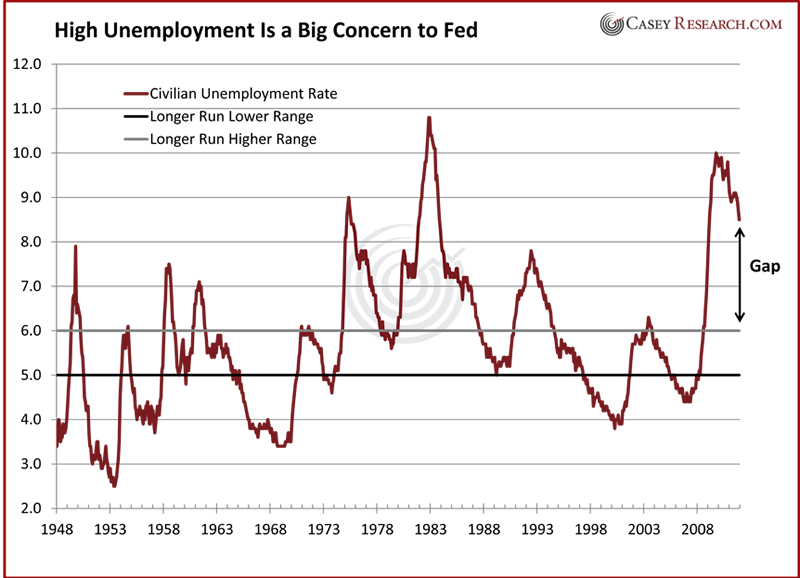
My conclusion from the Fed’s actions is that it doesn’t care as much about its inflation target as it does about improving the unemployment rate. Thus, it will err on the side of letting inflation rise, if it would improve unemployment. But holding rates too low too long fueled the housing bubble. Repeating the same game will have consequences of malinvestment in the form of new bubbles in the economy. The Fed hopes to restore employment before the negative consequences of loose monetary policy show up.
The Fed provided the accompanying chart of the Fed funds rates expected by the seventeen members of the FOMC. Each dot indicates the value (rounded to the nearest quarter-percent) of an individual participant’s judgment of the appropriate level of the target Federal funds rate at the end of the specified calendar year. Over the long run, the Fed expects the funds rate to rise to around 4.25%. Eleven of the members indicate that the rate will rise before 2015. Only six expect the rate to stay close to zero through 2014.
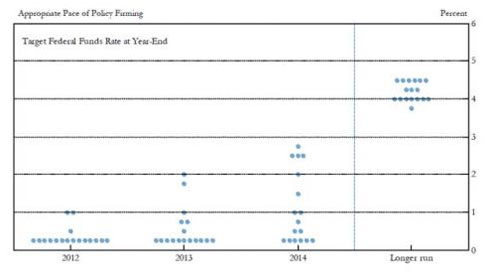
The above chart should not be taken very seriously, as Fed predictions have been notoriously inaccurate. Furthermore, it’s likely that rates will rise before 2014 as a result of market forces pushing them upward due to mistrust of the currency – measured by rising gold and commodity prices.
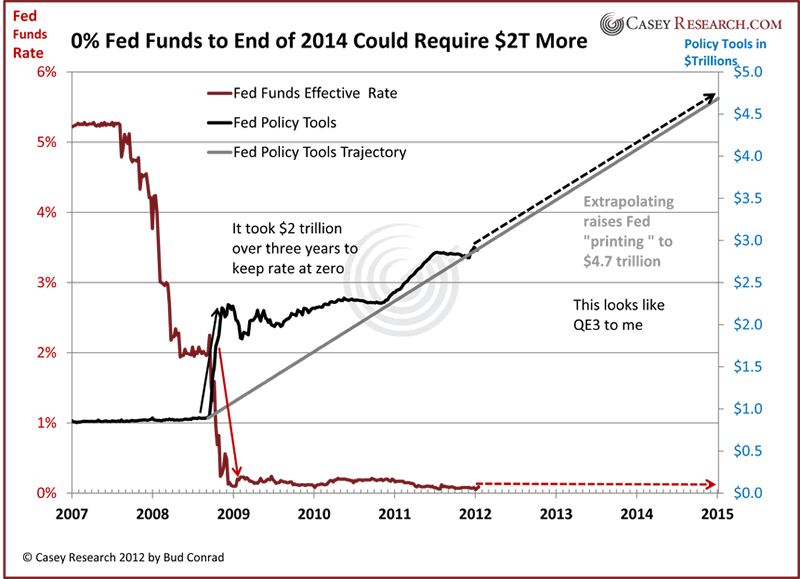
The Federal Reserve balance sheet expanded dramatically as the credit crisis became acute in 2008. The Policy Tools (shown below in black) grew by $2 trillion with the QE1 purchase of mortgage-backed securities and the QE2 purchase of long-term Treasuries. This was an unprecedented effort to support those markets, provide liquidity, and drive rates down to zero. A simple extrapolation of similar expansion policies to the end of 2014 suggests that the Fed may require an additional $2 trillion to extend its goals. The problem is that such action would surely weaken the dollar and drive gold much higher. If confidence is lost, rates could rise even as the Fed continues to print and buy securities. The Fed says that it will change its policy if conditions warrant. I think they will be forced to stop this policy well before 2014 is over. Nonetheless, in the meantime, they will plant the seeds of rising prices with ultralow rates.
The gold price is driven by Fed policies and its bias toward printing money rather than defending the dollar’s purchasing power. This Fed bias was again reconfirmed by this announcement. With all the Fed’s renewed vigor toward keeping rates low longer, we can once again reconfirm the ongoing downward slide for the dollar. As a result, gold remains the best investment against the damaging government deficits and central bank policies around the world.
While the dollar may look good compared to the other fiat contestants on the global money stage, the United States’ debt situation is untenable – and various factors could bring it to its knees faster than anyone expects. Don’t let it burn you: learn how to protect yourself and your assets.]
© 2012 Copyright Casey Research – All Rights Reserved
Disclaimer: The above is a matter of opinion provided for general information purposes only and is not intended as investment advice. Information and analysis above are derived from sources and utilising methods believed to be reliable, but we cannot accept responsibility for any losses you may incur as a result of this analysis. Individuals should consult with their personal financial advisors.

-
I know Mike is a very solid investor and respect his opinions very much. So if he says pay attention to this or that - I will.
~ Dale G.
-
I've started managing my own investments so view Michael's site as a one-stop shop from which to get information and perspectives.
~ Dave E.
-
Michael offers easy reading, honest, common sense information that anyone can use in a practical manner.
~ der_al.
-
A sane voice in a scrambled investment world.
~ Ed R.
Inside Edge Pro Contributors

Greg Weldon

Josef Schachter

Tyler Bollhorn

Ryan Irvine

Paul Beattie

Martin Straith

Patrick Ceresna

Mark Leibovit

James Thorne

Victor Adair