
Timing & trends
The U.S. Dollar is positioned between points 3 and 4 on the monthly chart and around point F on the daily charts. Assuming that support holds close to this month’s lows, the upside target is 93 within the next two years (33 months from the May 2011 low).

The recent four-week correction fit the parameters of 1981 and 1996 well:
- Tested 89-day exponential moving average
- Tested 34-day Bollinger Band
- Generated RSI(14) of 36
- Retraced 49% of the rally from October
First resistance is at 80.50. A failure to close through there could result in another test of support around 78.25. Next target is the upper channel line at 84.
Gold, HUI and the Dollar also continue to track the 2004 model. Therefore, we now recommend that traders view last week’s lows as the critical support in gold and the miners. Independently, timing models point towards a late February to early March high in gold.
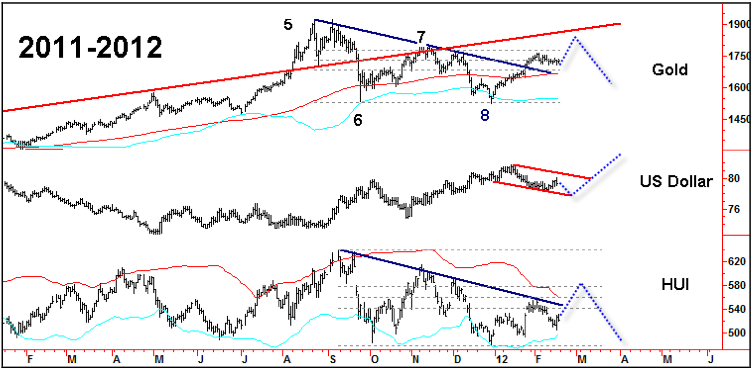
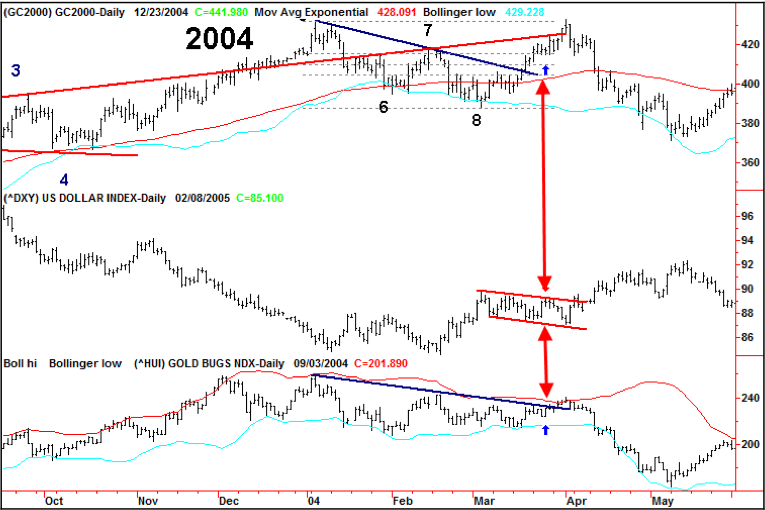
The correlation of Gold’s decade long bull market with the 1976-80 run from $100 to $850 continues to center around the action of the U.S. Dollar. The current price patterns relate to November 8, 1979. A close above 81 in the Dollar and a close below $1640 in gold would be outside the model. However, a close below 78 would be a catalyst for upside action in virtually all asset classes (except T-Bonds).

CHARTWORKS – 2/19/2012
BOB HOYE, INSTITUTIONAL ADVISORS
EMAIL bobhoye@institutionaladvisors.com” data-mce-href=”mailto:bobhoye@institutionaladvisors.com“>bobhoye@institutionaladvisors.com
The opinions in this report are solely those of the author. The information herein was obtained from various sources; however we do not guarantee its accuracy or completeness. This research report is prepared for general circulation and is circulated for general information only. It does not have regard to the specific investment objectives, financial situation and the particular needs regarding the appropriateness of investing in any securities or investment strategies discussed or recommended in this report and should understand that statements regarding future prospects may not be realized.
Investors should note that income from such securities, if any, may fluctuate and that each security’s price or value may rise or fall. Accordingly, investors may receive back less than originally invested. Past performance is not necessarily a guide to future performance. Neither the information nor any opinion expressed constitutes an offer to buy or sell any securities or options or futures contracts. Foreign currency rates of exchange may adversely affect the value, price or income of any security or related investment mentioned in this report. In addition, investors in securities such as ADRs, whose values are influenced by the currency of the underlying security, effectively assume currency risk. Moreover, from time to time, members of the Institutional Advisors team may be long or short positions discussed in our publications.

In order to estimate likely returns and risks in the financial markets, our general approach is to identify a set of historical instances that match current conditions on a broad range of important dimensions. In reviewing market conditions this week, what strikes me most is the pattern that emerges when we look across various horizons, from 2 weeks out to 18 months.
The chart below identifies periods in recent years where we reported market conditions as being at least “overvalued” and “overbought” in these weekly commentaries. Those two conditions alone aren’t enough, by themselves, to put the market in a “hard-negative” situation, but even those two tend to be enough to invite drawdown risk. The overvalued, overbought periods are shaded in blue on the chart below. The red lines indicate the deepest drawdown experienced by the market over the following 18 months (right scale), while the blue line charts the S&P 500 (left scale). Notably, even with weakly negative conditions – overvalued and overbought – the market has typically moved lower at some point in the next 18 months, wiping out all intervening gains. That surrender of intervening gains usually begins with a very hard and unexpected initial loss that takes out the bulk of upside progress within a period of a few days or weeks. This is a general pattern that we also see throughout market history.
….read the entire article (its well worth reading in ful)l:

Downside risk in equity markets and most sectors exceeds short term upside potential. Short term weakness will provide an opportunity to enter into seasonal plays this spring including Energy, Mines & Metals, Chemicals and Auto sectors. Energy already is showing early signs of seasonal strength.
Equity Trends
The S&P 500 Index added 18.59 points (1.38%) last week. Intermediate trend is up. The Index remains well above its 50 and 200 day moving averages. Short term momentum indicators are overbought and showing early signs of peaking.

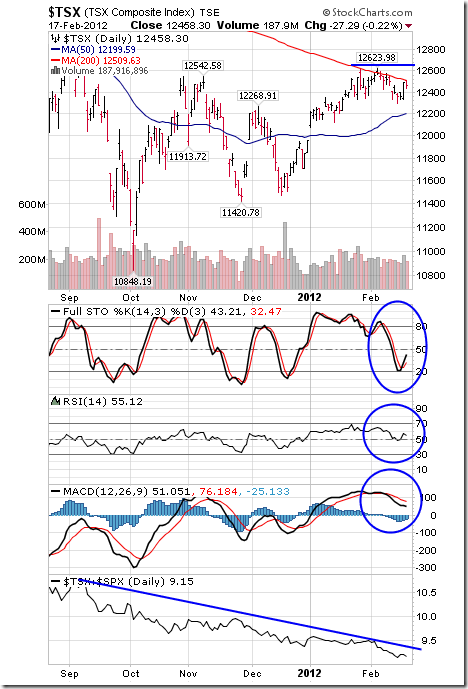
The TSX Composite Index added 68.88 points (0.56%) last week. Intermediate trend is up. Support is at 11,420.78. Resistance has formed at 12,623.98. The Index trades above its 50 day moving average, but recently has found resistance near its 200 day moving average currently at 12,509.63. Short term momentum indicators are trending down. Stochastics already are oversold and showing early signs of trying to bottom. Strength relative to the S&P 500 Index remains negative.
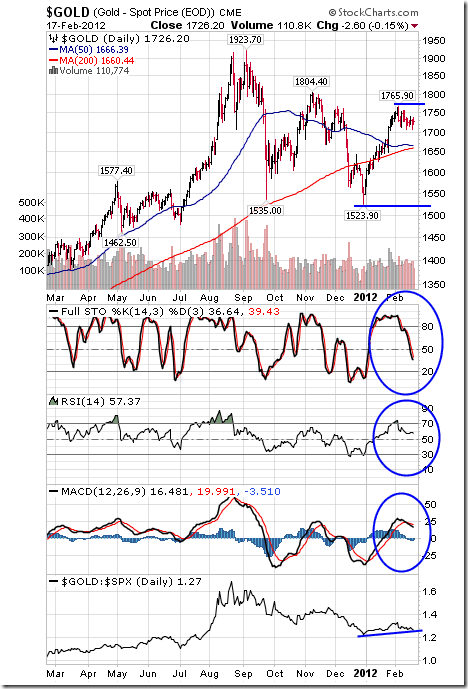
Gold fell $4.20 per ounce (0.24%) last week. Support is at $1,765.90 and resistance is at $1765.90. Gold is close to completing a so called “Death Cross” when its 50 day moving average moves below its 200 day moving average (Tech Talk is not a believer in “Death Crosses, but the media will talk about it). Short term momentum indicators have rolled over from overbought levels and are trending down. Strength relative to the S&P 500 Index remains mildly positive. Seasonal influences tend to peak near the end of February.
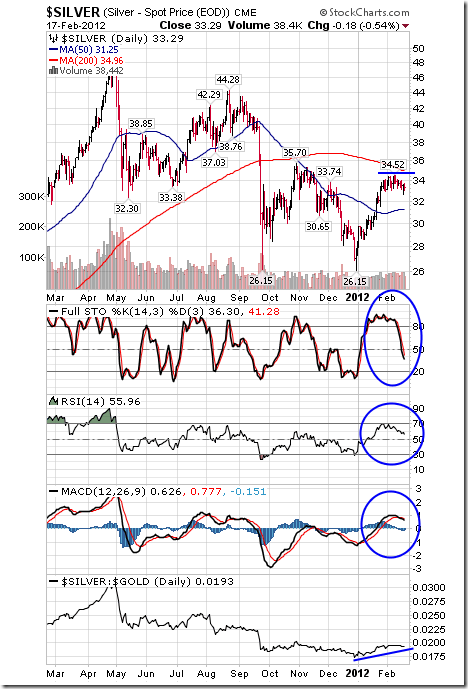
Silver slipped $0.41 per ounce (1.22%) last week. Support is at $26.15 and resistance is forming at $34.52 and near its 200 day moving average at $34.96. Short term momentum indicators have rolled over from an overbought level and are trending down. Strength relative to gold remains positive. Seasonal influences are positive until May.
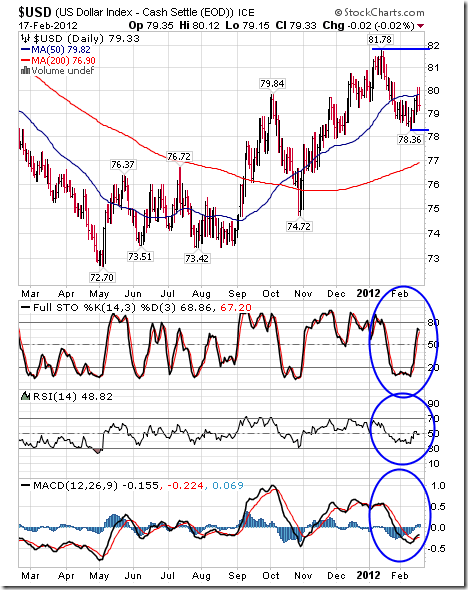
The U.S. Dollar added 0.22 last week. Intermediate trend is up. Support is forming at 78.36 and resistance is at 81.78. The Dollar remains above its 200 day moving average and below its 50 day moving average. Short term momentum indicators are recovering from oversold levels.
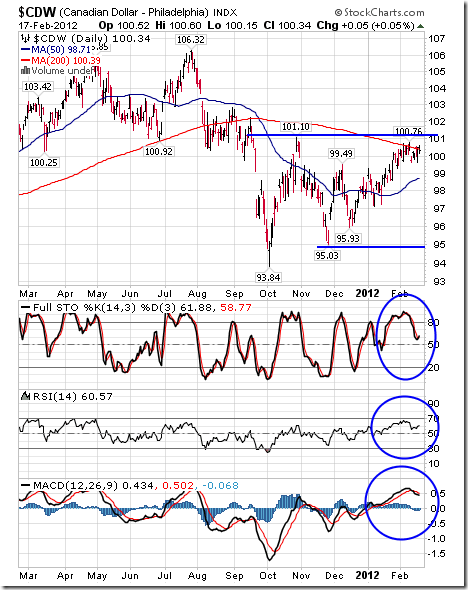
The Canadian Dollar added 0.46 cents U.S. last week. Intermediate trend is down. Support is at 95.03 cents and resistance is at 101.10 cents. The Canuck Buck trades above its 50 day moving average, but has found resistance near its 200 day moving average at 100.39. Short term momentum indicators have rolled over from an overbought level and are trending down.
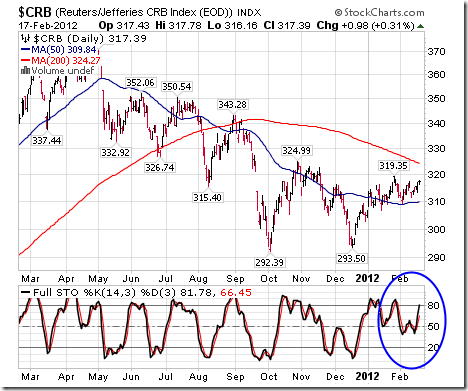
The CRB Index added 3.17 points (1.01%) last week thanks mainly to strength in the energy complex. Intermediate trend is down. Support is at 292.39 and resistance is at 324.99. Short term momentum indicators are trending higher.
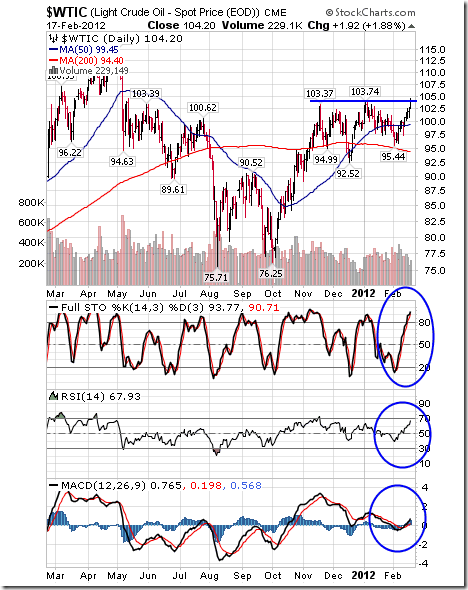
Crude Oil gained $6.51 per barrel (6.66%) last week. Intermediate trend is up. Crude broke above resistance at $103.74 on Friday implying intermediate upside potential to $112.75. Short term momentum indicators are overbought, but have yet to show signs of peaking. News over the weekend that Iran has halted exports of oil by French and United Kingdom companies adds to a bullish stance. Seasonal influences remain positive.
Don Vialoux has another 30+ charts, analysis and guest contributors HERE

A Primer for Investing in Canadian Farmland.
“Put your money in land, because they aren’t making any more of it!” – Will Rogers. When I think about burying some serious money for the long run, I think of farmland. I’m very bullish on Canadian farmland. My reasons: 1) Canadian farmland is very productive; 2) low cost on a global basis; 3) Canada is a stable country with a very adequate supply of water, energy and fertilizer; and 4) even the weather is cooperative as its growing season gets a little longer each year.
Some of Rick’s readers ask for more details. When ever you invest in land as a non-resident, you need to check the local laws. For example, when I was a farm realtor I had a group of Italians interested in buying a 2000-acre farm in Illinois. Now Illinois has a law prohibiting non-resident aliens from owning farmland. But it doesn’t prohibit corporations from buying farmland. So, we created a corporation and bought the farm.
How does this apply to buying a Canadian farm?
…..read more HERE
Not long after the New Year dawned, Gold Stock Trades Editor Jeb Handwerger noted certain rare earths emerging from their 2011 slumber to produce impressive gains. It’s not yet March, but the good news keeps coming. Despite dire predictions that demand is drying up, Handwerger tells The Critical Metals Report in this exclusive interview that the world remains at risk of supply shortfalls. It’s not strictly a rare earths story, either. Read on to see what he has to say about the nascent niobium space.
COMPANIES MENTIONED: FRONTIER RARE EARTHS LTD. – GENERAL ELECTRIC COMPANY – GLENCORE INTERNATIONAL PLC – IAMGOLD CORP. – LYNAS CORP. – MATAMEC EXPLORATIONS INC. – MOLYCORP INC. – QUANTUM RARE EARTH DEVELOPMENTS CORP. – RARE ELEMENT RESOURCES LTD. – TASMAN METALS LTD. – TOYOTA TSUSHO GROUP – UCORE RARE METALS INC. – XSTRATA PLC
The Critical Metals Report: Jeb, as a student of the critical metals space who’s been watching precious metals stocks over the past 20 years, do you believe we’re seeing a renaissance in the industrial metals space?
Jeb Handwerger: It’s interesting. We saw last weekThe Wall Street Journal headline, “After Xstrata, a Mining Merger Pileup.” Of course, we always try to look beyond the headlines and read between the lines. The proposed merger between Glencore International plc (GLEN:LSE) and Xstrata PLC (XTA:LSE) is old news for my readers because for some time we’ve said we would see increased global hunger for natural resources. This transaction goes much deeper and is implicit with words not mentioned in the routine press release.
TCMR: How is it more important than just that one deal?
JH: Banks are aligning with resource seekers to create real competitors to giants such as Vale S.A. (VALE:NYSE), BHP Billiton Ltd. (BHP:NYSE; BHPLF:OTCPK) and Rio Tinto (RIO:NYSE/ASE) to assimilate the resource stocks and claim resources such as copper, iron ore and metallurgical/thermal coal. The Xstrata-Glencore transaction is notable in that it confirms the rising demand from emerging nations, especially in Asia.
TCMR: There has been a lot of nervousness among investors regarding the pace of growth of China, and the mainstream media has been reporting softening GDP growth in many of the Asian nations, particularly China. Are we not getting the straight story from the mainstream media?
JH: The way we see it, the gloom and doom that came out of Europe in 2011 and fears of recession and global contagion were overdone. We’ve seen a flight out of equities into risk-off assets such as the dollar and treasuries. But the Federal Reserve Bank has extended low interest rates from mid-2013 to late-2014, and we’re seeing stimulus underway in Europe and China. In fact, we’re now seeing a return to the risk-on trade and a return to what we consider one of the most important sectors—the rare earths (REEs). Rare earths are intrinsic to the new technologies, rapidly increasing demands and this ongoing, long-term global commodity boom.
TCMR: So you believe in the long-term growth of BRIC nations (Brazil, Russia, India and China), not just in traditional metals but also in specialty metals and rare earths?
JH: Exactly. Many analysts are overlooking a Department of Energy report that came out at the end of 2011. Analysts claim that rare earth demand is low, and that China can just open the floodgates and drown the market with heavy rare earths (HREEs). Well, a U.S. government think tank wrote a 200-page report—these are the top professors, the top scientists, the top economists coming together—anticipating a supply shortfall in certain basic elements. Instead of only two elements that are most critical and strategic, there are now five. They’re saying that in the short-term we could experience supply shortages of yttrium, europium, neodymium, terbium and dysprosium.
TCMR: Even with lack of Chinese transparency?
JH: Right, even with the lack of Chinese transparency. This is what I’ve seen and I’m studying. So very few projects with these metals will really be able to come online outside of China, and these elements are growing more and more in demand. We’re not in the 1970s anymore. These emerging countries are building new automobiles, electric vehicles and fuel-efficient, lighter vehicles. The rise in demand for smart phones in emerging nations has been huge. Look at the Egyptian revolution. Look at the Arab Spring. These events would not have occurred if not for the rise of the smart phones.
TCMR: And that doesn’t even include all the green applications—for photovoltaic cells and so forth.
JH: Right. And wind turbines. General Electric Company (GE:NYSE) just announced that it’s launching a new generation of huge, transformative wind turbines that require HREEs.
TCMR: So let’s talk about these HREEs.
JH: Here’s an interesting example of a company that has HREEs in its deposit right here in the U.S.:Ucore Rare Metals Inc. (UCU:TSX.V; UURAF:OTCQX) released an announcement that Alaska Governor Sean Parnell has allocated $8.1 million (M) in the proposed state budget for 2013 to expedite Ucore’s development as a viable corporate entity. In other words, the state government of Alaska is sponsoring explicit support for Ucore’s flagship Bokan Mountain project, which contains strategically important HREE metals of dysprosium and terbium. These metals have been highlighted by the U.S. Department of Energy as being at risk of a supply shortfall in the near term. With Ucore, Alaska has not only taken an active role in the development of a rare earth company but in reviving the whole rare earth and critical mineral industry from mining to magnets.
It certainly underscores the importance of geopolitical support. Two other companies that have secured incredible geopolitical support and have the best chances of coming into production at the end of the day are Matamec Explorations Inc. (MAT:TSX.V; MRHEF:OTCQX) and Tasman Metals Ltd. (TSM:TSX.V; TAS:NYSE.A; TASXF:OTCPK; T61:FSE).
TCMR: Are they involved in the heavies, the REEs that industry and government seem most nervous about in terms of supply security?
JH: Sweden actually has recognized Tasman Metals as a national asset, a strategic asset. Its flagship project is called Norra Karr. It’s a large HREE project—the fourth-largest HREE element project in the world and the only NI 43-101-compliant REE mineral resource in mainland Europe. It’s in a mining-friendly location with great infrastructure. What’s also interesting is that this deposit has eudialyte mineralogy. Tasman has made significant progress in developing the process flow sheet for Norra Karr, which is critical for the Preliminary Economic Assessment (PEA) that will be nearing completion in a few weeks. Not only has the company shown impressive rare earth recoveries, but it is able to physically separate nepheline/feldspar with low iron content. This would be a great way to significantly reduce tailings. Recoveries of the HREEs, including a high percentage of dysprosium and terbium, exceeded 90%.
TCMR: What about Matamec?
JH: Interestingly, Matamec also seems to have that eudialyte metallurgy I mentioned, and it’s in mining-friendly Québec. In December 2011, Matamec signed a memo of understanding (MOU) with Toyota Tsusho Group (TYHOF:OTCPK). The trading unit of Asia’s largest auto maker, Toyota Tsusho has agreed to buy Matamec’s output from its Kipawa mine deposit—which is in many ways similar to Ucore’s Bokan Mountain deposit—to fast-track development of Kipawa’s rare earth metals production. Kipawa isn’t a big deposit; it’s quite compact. I think that’s what the end-users are looking for, not the projects with capital expenditures approaching $1 billion (B). They like compact projects with excellent infrastructure, favorable metallurgy and geopolitical support.
That was the lesson we learned with the Australian REE company, Lynas Corp. (LYC:ASX). Look at the gray hairs Lynas has given shareholders for being in a risky political jurisdiction. Alaska is extremely supportive of Ucore.
TCMR: Aside from Ucore in Alaska, do any other U.S. assets have heavy REEs?
JH: No. Not really. Ucore has the largest 43-101 HREE resources in the United States, although we have heard Rare Element Resources Ltd. (RES:TSX; REE:NYSE.A) and Molycorp Inc. (MCP:NYSE) are beginning to explore for the heavies around their current light rare earth (LREE) deposits. Those deposits have no historical geological footprint of HREEs like Ucore’s Bokan Mountain, which has transitioned into the mine development stage. The company recently announced Ken Collison as the new chief operating officer. Ken is an experienced mine engineer with a long history of designing mines in an efficient and economic manner.
TCMR: A couple of the rare earth companies have end-user agreements in place, which tend to verify the fact that manufacturing needs a secure supply of these rare elements to produce the most efficient, lightest, strongest, most powerful motors or magnets, whatever they manufacture. Do you consider these end-user agreements positive for the space?
JH: They’re hugely important. This is exactly what investors were looking for to give some validity to the sector, because this is a new, growing industry in its infancy.
TCMR: At this point we know that Matamec has an end-user agreement with Toyota.
JH: Correct. In December, Frontier Rare Earths Ltd. (FRO:TSX) signed a definitive agreement with Korea Resources Corporation (Kores), a government-owned mining and natural resource investment company, to form a strategic partnership designed to accelerate the development of Frontier’s Zandkopsdrift rare earth project in South Africa. Kores also announced that it intends to form a consortium to join the Frontier joint venture. It would include such leading Korean companies as Samsung Group, Hyundai Motors Group, GS Group, Daewoo Shipbuilding, Marine Engineering Group and AJU Group.
TCMR: Do you see end-user agreements on the horizon for Ucore and Tasman?
JH: I do. But they’re going to have to be very careful because they have to study what works to the benefit of the shareholders. Do they wait to finalize these end-user agreements or do they take the capital upfront? These are major decisions that CEOs are thinking about. I’m surmising that not only Ucore and Tasman, but others with high-quality projects have received offers. Some REE companies may be reluctant to make deals because their shares are trading at such bargain-basement prices.
These companies know they’re really undervalued. I mean, we’re talking about potentially billion-dollar mines, and these companies are trading at market caps of $40, $50, $60M. Imagine you’re the CEO of a company and you have shareholders you’re accountable to. Do you take the money and take security, and limit your upside? Or do you wait, holding out until your valuation improves? It’s a tough call. They can’t announce anything until the deal is done. They can’t say they are in talks, but that’s most likely what’s going on behind the scenes. As I understand it, the end-users are very interested in these companies because they want to ensure their security of supply. If they know they can be competitive and have access to a good supply, they’re happy.
TCMR: We’ve talked a little about HREEs as they relate new manufacturing applications. Are there other metals you’d like to discuss?
JH: Yes. Let’s transition into the ferroalloys. Earlier, we were discussing the Glencore/Xstrata deal. Part of that story is the need for ferroalloys. These are elements such as molybdenum, vanadium or niobium that are added to steel to make it lighter and stronger. Niobium is used to make super alloys, which are important to the defense of the United States as well as in industrial development.
TCMR: How is niobium important to strategic defense?
JH: Niobium—which is on the U.S. list of strategic metals—is used to make aeronautics and defense weaponry, the newest generation of helicopters, jets and jet thrusters, missiles, rockets and things we’re not even aware exist.
TCMR: Where are the niobium mines located?
JH: Two operating mines are in Brazil and one is in Québec, the Niobec Mine, owned by IAMGOLD Corp. (IMG:TSX; IAG:NYSE). IAMGOLD recently announced a $950M initiative to triple the niobium production with plans to spend $90M in 2012, $320M in 2013 and $540M in 2014.
TCMR: That’s pretty dramatic for what’s primarily a gold mining company.
JH: Exactly. That’s one of the issues I brought to my readers—why a gold producer would segue into expanding its niobium production. The simple answer is that IAMGOLD foresees substantial profits and a high rate of return on its investment in this strategic metal. Some of the top gold miners see the same potential, due to the growth in demand for these strategic metals for technology and green energy applications. They understand that we’re living in an age of energy conservation. They smell profits. This is what capitalism is about. Where can they get the most bang for the buck?
We’re all going to be looking at how we can conserve energy, and an intrinsic part of that conversation is that steel will have to be made simultaneously lighter and stronger. It takes the addition of niobium to do that, which is part of the reason why it appears on the government’s short list of essential strategic metals.
The Obama Administration has put in a bill to increase miles-per-gallon (mpg) requirements by 2015, all the way up to 54 mpg. The automotive industry has to make cars lighter to improve fuel efficiency, but they can’t sacrifice strength, which they need to meet safety targets. That’s what makes these ferroalloys, or these alloying agents, so important. When added to steel, the niobium increases the strength while at the same time reducing its total weight. Those efficiencies trickle down into shipping, into manufacturing—all the way down the supply chain.
TCMR: With only three niobium mines in production, are there other niobium deposits getting ready to meet supply requirements going forward as government and consumer demands increase for lighter, more fuel efficient and stronger steel products?
JH:It’s astonishing that the United States currently has to import 100% of the niobium it uses. It doesn’t seem right when we’re looking at a global renaissance in energy conservation that will require lighter, stronger steel. This is a much bigger market than the rare earth market.
TCMR: That’s scary.
JH: Enter center stage, Quantum Rare Earth Developments Corp. (QRE:TSX.V; BR3:FSE; QREDF:OTCBB). It’s the only company that has an NI 43-101-complaint resource of niobium in the U.S. Its Elk Creek Project in Nebraska is an ideal location for a mine. It’s smack in the middle of farmland through which major roads and rail lines are available for expansion. Quantum has both state and local support.
At one point, back in the 1970s and 1980s, this was a Molycorp Inc. asset that was supposed to go into production, but then the whole industry moved overseas. Now, Quantum is building upon the research done by Molycorp. In fact, some of the original Molycorp people are updating the findings, working on the metallurgy and the development process for the same property they worked approximately 40 years ago. Quantum has an experienced chemical engineer on board and a strong metallurgical team with decades of experience.
TCMR: How does Elk Creek compare with Niobec?
JH: Niobec has proven and probable reserves of 45.7M tons at .53% niobium. Elk Creek has an inferred resource—a much earlier stage, not reserves—of 80.1M tons at 0.62% niobium. It’s an early stage project but it’s showing that it has the potential of becoming a very large, high-grade mine. Results from its 2011 drill program indicate that Quantum hit some high-grade niobium, and that’s being factored into a new resource estimate targeted for publication within the upcoming few weeks. It could be huge.
TCMR: What about permitting? Nebraska isn’t a typical mining address.
JH: The state and local government has been 100% supportive, so initially it seems ideal for permitting. I’ve seen no opposition in what I’ve researched—only support. There should be an independent PEA published in the first half of 2012.
We still consider it a bargain price to the investment community; the nine-month downtrend has been broken above its 200-day moving averages. The trajectory is upward at this point. Volume is growing, too, which shows that Quantum is gaining increased interest.
As I indicated, while the giant IAMGOLD is sinking $950M into Niobec in Québec over the next three years, I conjecture that we might see another mining giant out there willing to enter the highly profitable niobium market at bargain basement prices.
TCMR: It will be interesting to see what happens in terms of niobium exploration going forward. This space seems to be in its infancy, just as the rare earths sector was in 2007.
JH: The trajectory is turning upward once again. Now that we’ve completed a basing process, we’re beginning to emerge into new uptrends in these really critical industrial metals.
That said, it’s a mistake to think that the West can rely on lawyers, courts and international enforcers such as the World Trade Organization (WTO) to secure rare earth supply. That’s no way to compete with China. In fact, the WTO’s ruling against China’s export restrictions of critical raw materials may only exacerbate the underlying issue and not resolve anything. Rare earths independence is the answer. Competition is the lifeblood of capitalism.
The companies that can secure supply at a reasonable price by crafting agreements with producers will be rewarded, but the reality is the U.S. and most other countries around the world are at risk of a supply shortfall in these critical elements. I want to make sure people hear that because it’s so important. They’re getting such misinformation and there aren’t a lot of strong voices in the sector.
TCMR: You mentioned Lynas earlier, and all the gray hairs its problems have given its shareholders. The company’s Mount Weld project contains the richest known rare earths deposit in the world, but it’s taken a while to get its refinery off the ground in Malaysia. News just came out of Kuala Lumpur on Feb. 1 that Lynas has been granted a temporary and conditional license for that operation.
JH: We are watching Lynas carefully because we think it may serve as a bellwether for the whole rare earth sector. Since April 2011 and the delays with receiving that temporary operating license to begin the commencement of refining rare earths, Lynas has had a nice bounce. Last time it did this sort of reversal from a downtrend, it made a very large gain.
TCMR: So, are you saying you’re long on Lynas?
JH: Yes I am. But we have to remember that a temporary operating license to refine rare earths under certain conditions doesn’t automatically mean the sky’s the limit. There may be a response through the sector. Other companies may realize that the rare earths and Lynas can get to a state of eventual cash flow as a pioneering model for the whole rare earth sector.
TCMR: Is the elimination of some of the names in this space likely?
JH: Certain companies have been highly promotional, so investors should do their homework.
TCMR: What would you have them watch out for, specifically?
JH: Check out the management. Make sure they have competent mining engineers and third-party consultants. Make sure they are staying on track with timelines. Check out their NI 43-101s and metallurgical results. Study the historical geological footprints to understand if it is a heavy- or light-predominated asset. Don’t take claims for granted. Make sure they have good infrastructure so their Capex does not become prohibitive. Understand the geopolitics involved. These are just a few of the important things that rare earth investors need to review. It’s not just geology, but also the metallurgy and potential radiation—and how they’re dealing with it. A whole mix goes well beyond the tonnage and grade. It’s so important to have an open-minded, broad perspective; you want to avoid getting myopic by focusing on one area and losing sight of the whole big picture.
TCMR: Bottom line, do you consider the rare earth space is a good place for investors? Or is the space so complex that investors would be better advised not to join the party?
JH: The way I see it, demand is increasing for these elements, for smart phones, for the smaller, more efficient and lighter products, technologies and alternative clean energies. Demand is growing rapidly.
The number of companies that will be able to get into production is limited. Mining is a tough business, and especially tough in rare earths, where you have so many moving parts. Despite that—or perhaps because of that—the rewards will be great for the high quality companies that get it done, the innovative, visionary companies whose management thinks outside the box. I’m confident that some of these companies will make a fortune. And so will the people who invest in them
TCMR: Thank you, Jeb. It’s been a pleasure.
Gold Stock Trades Editor Jeb Handwerger is a sought-after stock analyst and best-selling writer who’s syndicated internationally and known throughout the financial industry for accurate, in depth and timely analysis of the general markets, particularly as they relate to the rare earths, precious metals and, nuclear sectors. He studied engineering and mathematics and received his undergraduate degree from University of Buffalo and a masters degree at Nova Southeastern University in Fort Lauderdale. Teaching technical analysis to professionals in South Florida for some seven years, Handwerger began a daily newsletter that grew to become Gold Stock Trades: Mining for Winners in any Market, with thousands of readers from more than 40 nations who are interested in the North American resource markets. Click Here to subscribe to his free newsletter.
Want to read more exclusive Critical Metals Report articles like this? Sign up for our free e-newsletter, and you’ll learn when new articles have been published. To see a list of recent interviews with industry analysts and commentators and learn more about critical metals companies, visit our Critical Metals Report page.

-
I know Mike is a very solid investor and respect his opinions very much. So if he says pay attention to this or that - I will.
~ Dale G.
-
I've started managing my own investments so view Michael's site as a one-stop shop from which to get information and perspectives.
~ Dave E.
-
Michael offers easy reading, honest, common sense information that anyone can use in a practical manner.
~ der_al.
-
A sane voice in a scrambled investment world.
~ Ed R.
Inside Edge Pro Contributors

Greg Weldon

Josef Schachter

Tyler Bollhorn

Ryan Irvine

Paul Beattie

Martin Straith

Patrick Ceresna

Mark Leibovit

James Thorne

Victor Adair