

Downside risk in equity markets and most sectors exceeds short term upside potential. Short term weakness will provide an opportunity to enter into seasonal plays this spring including Energy, Mines & Metals, Chemicals and Auto sectors. Energy already is showing early signs of seasonal strength.
Equity Trends
The S&P 500 Index added 18.59 points (1.38%) last week. Intermediate trend is up. The Index remains well above its 50 and 200 day moving averages. Short term momentum indicators are overbought and showing early signs of peaking.

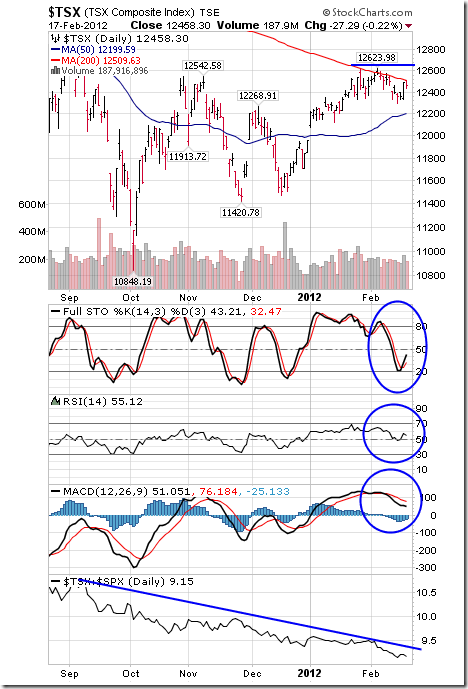
The TSX Composite Index added 68.88 points (0.56%) last week. Intermediate trend is up. Support is at 11,420.78. Resistance has formed at 12,623.98. The Index trades above its 50 day moving average, but recently has found resistance near its 200 day moving average currently at 12,509.63. Short term momentum indicators are trending down. Stochastics already are oversold and showing early signs of trying to bottom. Strength relative to the S&P 500 Index remains negative.
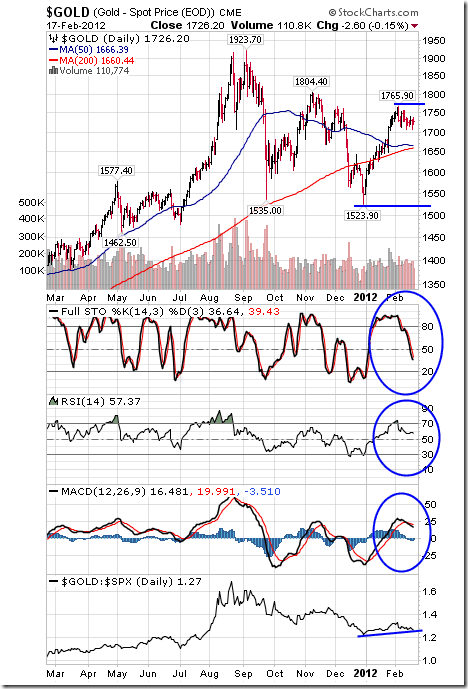
Gold fell $4.20 per ounce (0.24%) last week. Support is at $1,765.90 and resistance is at $1765.90. Gold is close to completing a so called “Death Cross” when its 50 day moving average moves below its 200 day moving average (Tech Talk is not a believer in “Death Crosses, but the media will talk about it). Short term momentum indicators have rolled over from overbought levels and are trending down. Strength relative to the S&P 500 Index remains mildly positive. Seasonal influences tend to peak near the end of February.
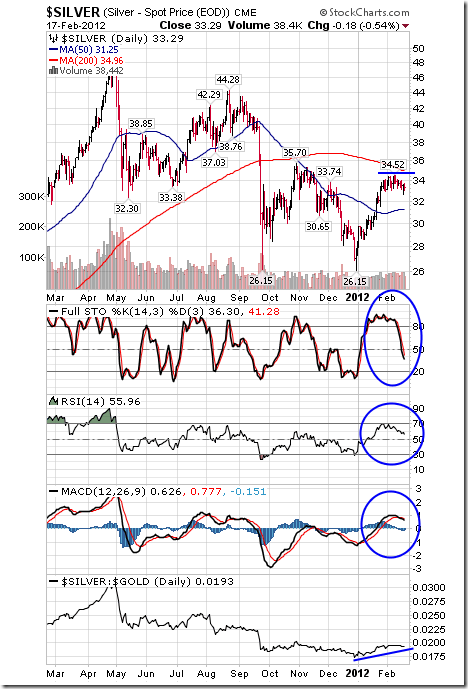
Silver slipped $0.41 per ounce (1.22%) last week. Support is at $26.15 and resistance is forming at $34.52 and near its 200 day moving average at $34.96. Short term momentum indicators have rolled over from an overbought level and are trending down. Strength relative to gold remains positive. Seasonal influences are positive until May.
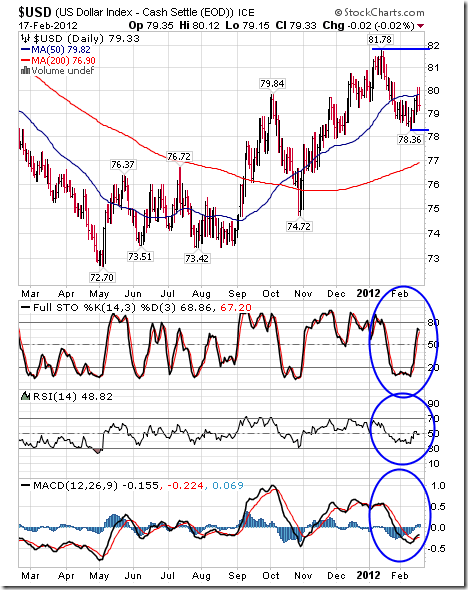
The U.S. Dollar added 0.22 last week. Intermediate trend is up. Support is forming at 78.36 and resistance is at 81.78. The Dollar remains above its 200 day moving average and below its 50 day moving average. Short term momentum indicators are recovering from oversold levels.
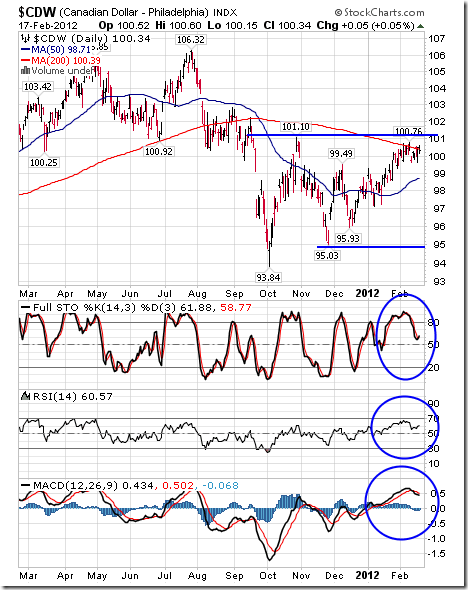
The Canadian Dollar added 0.46 cents U.S. last week. Intermediate trend is down. Support is at 95.03 cents and resistance is at 101.10 cents. The Canuck Buck trades above its 50 day moving average, but has found resistance near its 200 day moving average at 100.39. Short term momentum indicators have rolled over from an overbought level and are trending down.
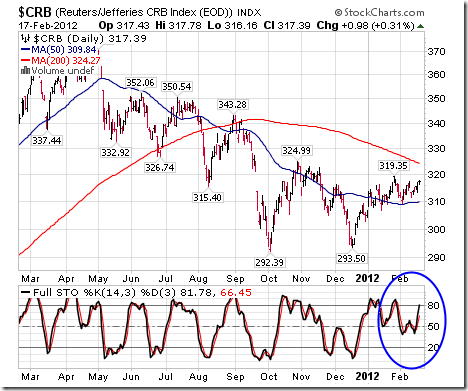
The CRB Index added 3.17 points (1.01%) last week thanks mainly to strength in the energy complex. Intermediate trend is down. Support is at 292.39 and resistance is at 324.99. Short term momentum indicators are trending higher.
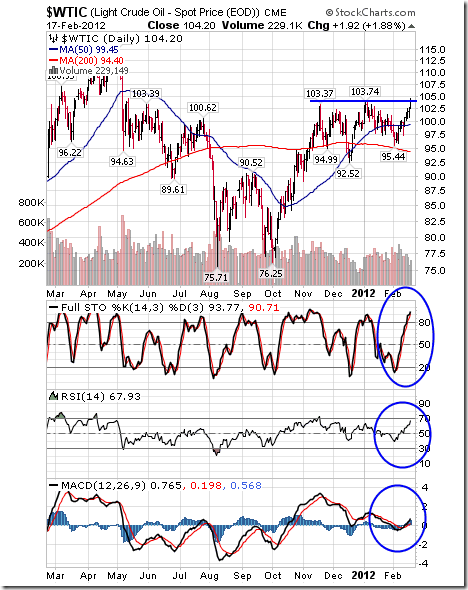
Crude Oil gained $6.51 per barrel (6.66%) last week. Intermediate trend is up. Crude broke above resistance at $103.74 on Friday implying intermediate upside potential to $112.75. Short term momentum indicators are overbought, but have yet to show signs of peaking. News over the weekend that Iran has halted exports of oil by French and United Kingdom companies adds to a bullish stance. Seasonal influences remain positive.
Don Vialoux has another 30+ charts, analysis and guest contributors HERE


