
Stocks & Equities
The world’s stock markets are increasingly interrelated. The psychology of traders, which drives most short-term price action, is continuously shaped by the nonstop torrents of global news flow. So even Americans can no longer afford to ignore what is going on in overseas markets. And the influence of European stock markets in particular is large and growing, making their recovery well worth watching.

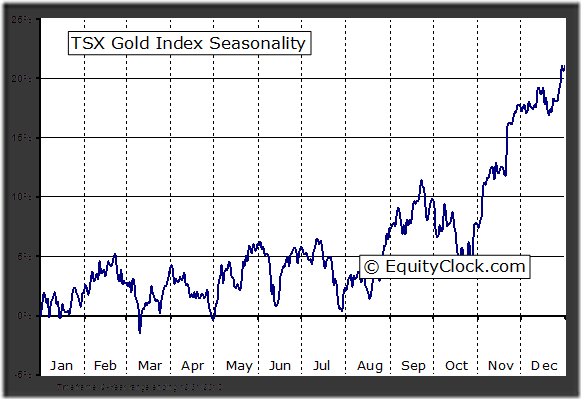
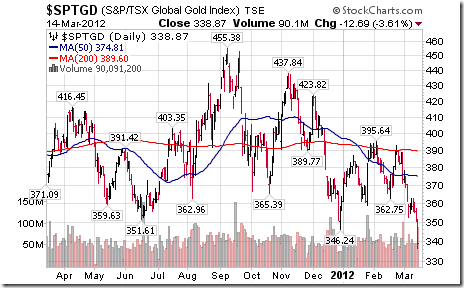
The PDAC Curse continues! Canadian gold equities have a history of moving higher from the last week in December until the third week in February in anticipation of encouraging news to be released just before or during the annual Prospectors and Developers Association Conference in Toronto early in March. Thereafter, Canadian gold equities tend to move lower. They followed their seasonal pattern once again this year. The TSX Gold Index from its low on December 29th to its high on February 23rd gained 13.4%. Subsequently, the Index plunged 13.4% by this Wednesday to reach a 20 month low. Moreover, next major support for the Index on the charts is 14% below current levels.
Weakness in gold equities this week is related to a $US68 per ounce plunge in the price of gold from last Friday to this Wednesday. On Wednesday, gold fell below its 200 day moving average at $1,679, a technical level that previously had provide strong support. Gold was responding partially to strength in the U.S. Dollar following news that U.S. Non-farm Payrolls in February continued to recover from depressed levels. The U.S. Dollar also strengthened following encouraging news from the Federal Reserve on Tuesday confirming slow, but steady economic growth in 2012. The Federal Reserve also noted its intention to maintain an easy money policy until the end of 2014.
The TSX Gold Index did not respond well to the news. Weakness in the Gold Index was the main reason why the TSX Composite Index dropped sharply on Wednesday when major U.S. equities indices were reaching multi-year highs. Moreover, prospects for gold and gold stocks are not encouraging between now and November 6th, the day when the next U.S president is elected. The U.S. Dollar has a history of moving higher between the end of March and the end of October during a U.S. Presidential election year. Not surprising, gold and gold stocks have a history of moving slightly lower during this period. Normally, gold and Canadian gold stocks have a period of seasonal strength from the end of July to the end of September followed by a second period of strength from the beginning of November to the third week in February. The latter period is likely to be the better period for re-entering the gold trade this year.
Preferred strategy is to look for better opportunities than gold and gold equities between now and November. Silver, platinum and their related equities are preferred over gold if your investment focus is on precious metals. Silver and platinum benefit from a growing demand for industrial purposes and have a history of outperforming gold between now and May..
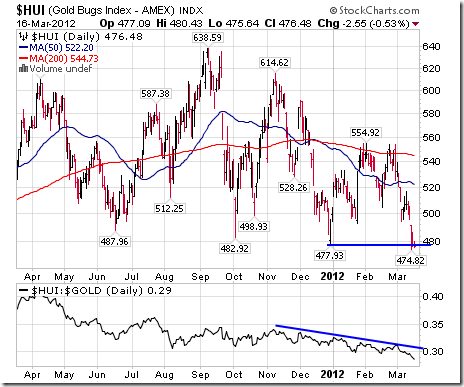
The Gold Bugs Index fell another 33.44 points (6.56%) last week. It broke support at 477.93 to confirm an intermediate downtrend. Strength relative to gold remains negative.

The major indices reached multi-year highs with the Dow breaking solidly through the 13,000-point barrier, the SP 500 edging over 1,400, and the Nasdaq Composite ploughing past 3,000 all in the same week. The market is now up over 30% from its October 2011 bottoms and nearly reaching 4-year highs.
When you look at technicals, the market is pointing to higher prices.
We enjoyed straight days firmly above the old highs of 1370 earlier in the week, which helps confirm the recent breakout. With the recent softening of the bond market, this technical sign may help provide the catalyst for the next leg higher.
The recent sell off in the bond market means we are likely near the end of a 30-year bond rally. Over the last 30 years, rates have been going lower making the bond market a safe and profitable haven for investors – especially with the recent economic volatility.
But rates are now bouncing up from historic lows.
That means bond investors will start losing money for the first time in a LONG TIME. As stocks make new highs, naturally bond funds will see outflows and stock funds will see inflows. This fresh money coming into the stock market could help push the market up to higher highs.
(From a timing perspective, this doesn’t mean the outflows from bonds will diverge into stocks right away. We’ve also had some surprisingly strong gains over the last few weeks which may signal a short term sell off. However, over the next few months, we may see more gains in the market up until May as predicted in the paragraph from above.)
U.S. gross domestic product (GDP) expanded an average 2.4 percent per quarter in the 2 1/2 years since the recession ended in 2009. While that means the world’s largest economy hasn’t had a smaller post-recession recovery rate since at least the 1940s, it also means there is room to climb higher when compared to past events. In the 2003 bull market, GDP rose 2.7 percent on average, before the S&P 500 surged 102 percent. In the 1982 rally, the rate was 5.7 percent with equities more than tripling during that cycle.
Does that mean we’re about to see the markets climb even higher?
When you have a market that has performed so well so fast, it’s really hard to jump in. From a psychological standpoint, there is by far a better chance for the market to head down rather than up. But from a technical standpoint, the market is looking to climb higher.
If we breach the 2007 highs and stay above there, we could be in for another strong bull market rally.
The one biggest concern scaring investors is the volume in trades that has been pushing the market higher. Trading at the New York Stock Exchange declined to the lowest level since 1999 last month, with the average volume over the 50 days ending Jan. 25 slowing to 838.4 million shares. The value of stocks changing hands dropped to $24.9 billion, a 50-day average not seen since at least 2005.
Keep an eye on bond outflows – the more this sell off continues, the greater chance the volumes in the equities market will increase on the buy side.
The Bigger Picture
The problem with our market today is that investors are reacting to daily news events. I have said this many times before. If you’re a day trader and have time to trade the news, this is the market for you.
But for most investors, waking up at the break of dawn and trading in front of a computer screen all day doesn’t work. That’s when you have to look at the big picture. The big picture is the real reason the markets are moving the way they are.
Right now, the markets are moving because of easy money and slightly better economic numbers.
The world continues to print more money – whether it’s a direct infusion of liquidity, operation twist or giving banks money at negative real interest rates.
Bernanke just told us last week that interest rates will remain at current low levels until late 2014 and that operation twist will continue. That means free money for at least another two years. While he suggests that there is no QE for now, he surely did not say there won’t be another one coming. The Fed will continue to play a major role this year.
There is so much printed money being flooded into the world and the stock market likes that type of liquidity. World money supply has soared dramatically over the past two years. Eventually, the piper will need to be paid. In the meantime, this liquidity has built a foundation under the stock market.
The IMF just said Greece will need more money – even though it just got hundreds of billions weeks ago. Brazil has promised to keep interest rates low for at least another year. Every week I stress that free money will continue to pour in around the world. But do you know how bad this situation really is?
The World’s Best and Worst Example
It took the U.S., the world’s largest debtor nation, more than 200 years for its own debt to reach $1 trillion. In the past four years alone, this debt has soared by over $5 trillion.
The U.S. is currently running deficits of over $1 trillion per year, which means this number will only keep growing. The U.S. has no way to pay this debt off – not without making major cuts that will lead to a revolt. When you consider that millions of baby boomers are now reaching retirement age and will be drawing on social security, the debt levels will continue to grow even faster than it has in the past four years.
That’s a scary thought.
If you look at U.S. total debt, the U.S. is now at about 400% debt to GDP ratio. Morgan Stanley says there’s “no historical precedent” for an economy that goes over 250% of its debt to GDP ratio without a crisis or huge inflation.
So when will it be time to pay the piper? When will this all come crumbling down? I don’t know. For now, politicians will continue to do what they’re doing. They’ll continue to patch things up by printing more money to pay for expenses, including paying the interest on their loans. They’ll continue to sell their debt to any nation that can afford to buy it.
Most people think that China is the number one holder of U.S. debt and Japan number two. Those people are wrong. The number one spot belongs to the Fed – by more than half a trillion dollars.
In the long run, all of this money printing and cheap money will devalue the dollar – especially against the purchasing power of gold.
(for now, we may see strength in the dollar relative to other currencies such as the Euro but this is based on its value relative to other currencies and not the purchasing power for assets such as gold and silver)
While gold and silver have recently experienced a selloff, these represent buying opportunities in the big scheme of things. I stick with my prediction that gold will be above $2000 and silver above $40 before the year is over.
The truth will eventually unfold. Take every opportunity to protect your wealth.
In the end, “He who has the gold makes the rules.”
Until next week,
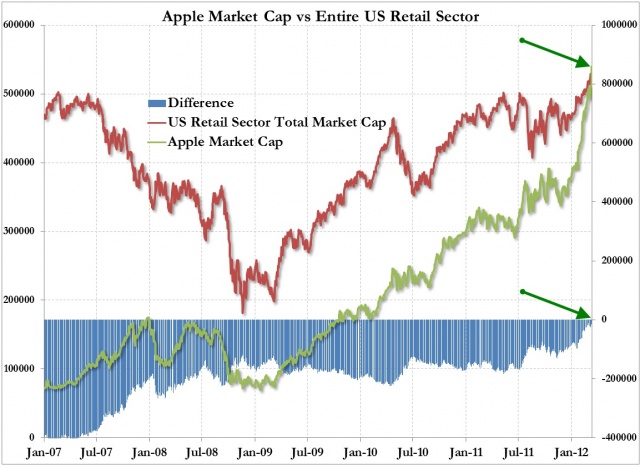
File this one under the “check back in 10 years” folder. This is a stat that will blow your mind. Apple’s market cap is now bigger than the ENTIRE U.S. retail sector. Now, I wouldn’t short AAPL in a million years, but these are the sorts of crazy stats that make you think “hmmm, is this really sustainable?”
As ZeroHedge says: “A company whose value is dependent on the continued success of two key products, now has a larger market capitalization (at $542 billion), than the entire US retail sector (as defined by the S&P 500). Little to add here”.
Michael is going to comment on the subject in this article in tomorrow’s Market Minute and he’d like anyone who listens to have this article posted here to refer too. “TODAY is my last day at Goldman Sachs. After 12 years, the environment now is as toxic and destructive as I have ever seen it.” (Greg Smith is resigning today as a Goldman Sachs executive director and head of the firm’s United States equity derivatives business in Europe, the Middle East and Africa.)

(Click on image or HERE to read the whole article or continue reading below)
Why I Am Leaving Goldman Sachs
To put the problem in the simplest terms, the interests of the client continue to be sidelined in the way the firm operates and thinks about making money. Goldman Sachs is one of the world’s largest and most important investment banks and it is too integral to global finance to continue to act this way. The firm has veered so far from the place I joined right out of college that I can no longer in good conscience say that I identify with what it stands for.
It might sound surprising to a skeptical public, but culture was always a vital part of Goldman Sachs’s success. It revolved around teamwork, integrity, a spirit of humility, and always doing right by our clients. The culture was the secret sauce that made this place great and allowed us to earn our clients’ trust for 143 years. It wasn’t just about making money; this alone will not sustain a firm for so long. It had something to do with pride and belief in the organization. I am sad to say that I look around today and see virtually no trace of the culture that made me love working for this firm for many years. I no longer have the pride, or the belief.
But this was not always the case. For more than a decade I recruited and mentored candidates through our grueling interview process. I was selected as one of 10 people (out of a firm of more than 30,000) to appear on our recruiting video, which is played on every college campus we visit around the world. In 2006 I managed the summer intern program in sales and trading in New York for the 80 college students who made the cut, out of the thousands who applied.
I knew it was time to leave when I realized I could no longer look students in the eye and tell them what a great place this was to work.
Over the course of my career I have had the privilege of advising two of the largest hedge funds on the planet, five of the largest asset managers in the United States, and three of the most prominent sovereign wealth funds in the Middle East and Asia. My clients have a total asset base of more than a trillion dollars. I have always taken a lot of pride in advising my clients to do what I believe is right for them, even if it means less money for the firm. This view is becoming increasingly unpopular at Goldman Sachs. Another sign that it was time to leave.
How did we get here? The firm changed the way it thought about leadership. Leadership used to be about ideas, setting an example and doing the right thing. Today, if you make enough money for the firm (and are not currently an ax murderer) you will be promoted into a position of influence.
What are three quick ways to become a leader? a) Execute on the firm’s “axes,” which is Goldman-speak for persuading your clients to invest in the stocks or other products that we are trying to get rid of because they are not seen as having a lot of potential profit. b) “Hunt Elephants.” In English: get your clients — some of whom are sophisticated, and some of whom aren’t — to trade whatever will bring the biggest profit to Goldman. Call me old-fashioned, but I don’t like selling my clients a product that is wrong for them. c) Find yourself sitting in a seat where your job is to trade any illiquid, opaque product with a three-letter acronym.
…..read next page HERE

-
I know Mike is a very solid investor and respect his opinions very much. So if he says pay attention to this or that - I will.
~ Dale G.
-
I've started managing my own investments so view Michael's site as a one-stop shop from which to get information and perspectives.
~ Dave E.
-
Michael offers easy reading, honest, common sense information that anyone can use in a practical manner.
~ der_al.
-
A sane voice in a scrambled investment world.
~ Ed R.
Inside Edge Pro Contributors

Greg Weldon

Josef Schachter

Tyler Bollhorn

Ryan Irvine

Paul Beattie

Martin Straith

Patrick Ceresna

Mark Leibovit

James Thorne

Victor Adair