
Stocks & Equities
U.S. equity indices recorded a classic key reversal sell patterns yesterday. A classic key reversal sell pattern includes opening above the previous day’s close, moving higher than the previous day’s trading range, closing lower than the previous day’s close and moving lower than the previous day’s trading range. Higher volume is a confirming indicator.
Key reversal sell signals for equity indices are rare. When they happen, they usually are a reliable indicator that equity markets are about to move lower in the short term. U.S. equity indices could easily fall back to break out levels that occurred on May 3rd when the last monthly employment report was released.

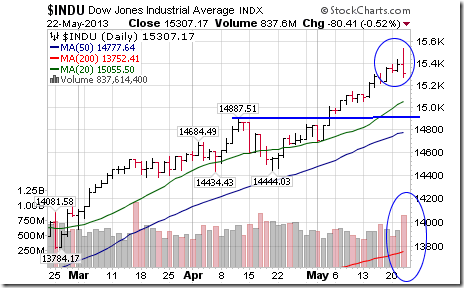

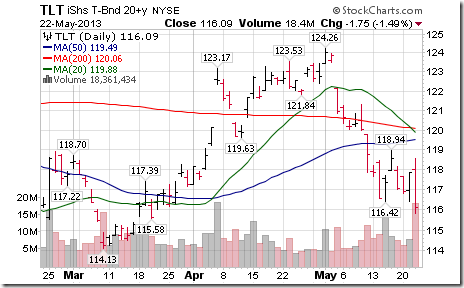
Trigger for the key reversals was news that the Federal Reserve is considering the possibility of reducing the size of its Quantitative Easing program as early as June. That means the Federal Reserve will purchase fewer Treasuries and Mortgage Backed Securities. As expected bond prices also responded strongly to the downside on the news.
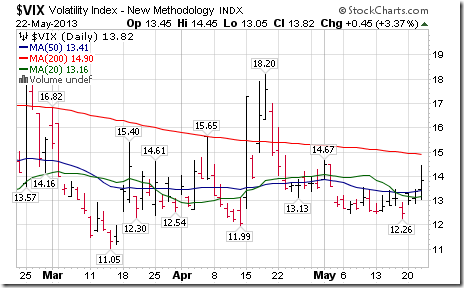
The VIX Index spiked on the news.
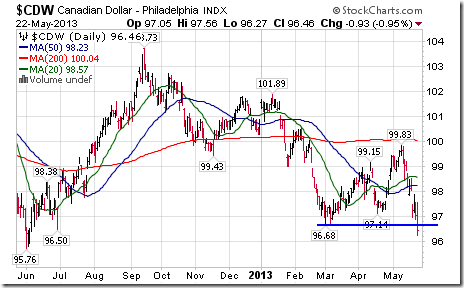
The U.S. Dollar move higher and the Canadian Dollar virtually collapsed on the news.
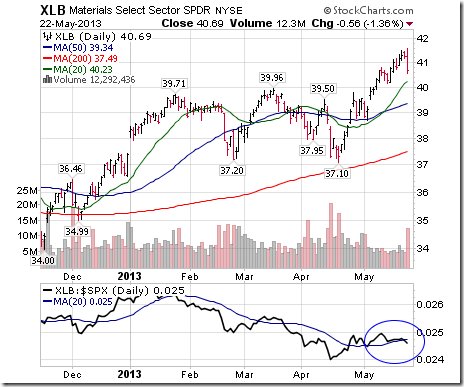
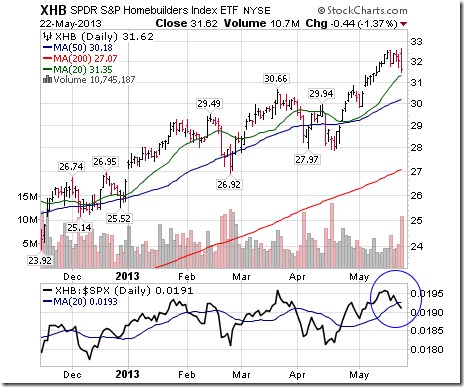
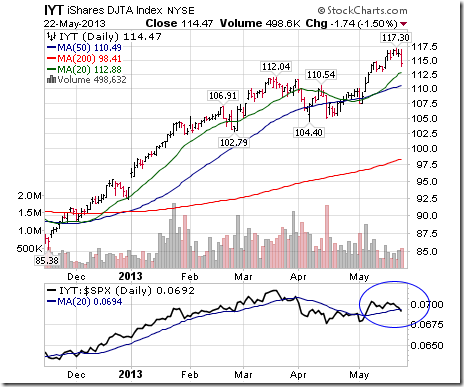
Economic sensitive sectors were notably under pressure. Their performance relative to the S&P 500 Index has started to deteriorate, a typical seasonal pattern at this time of year. Note that all charts below also recorded negative key reversal patterns.
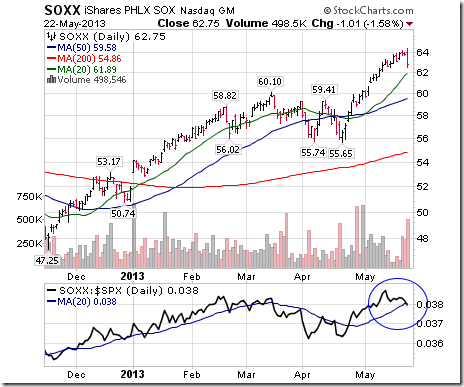
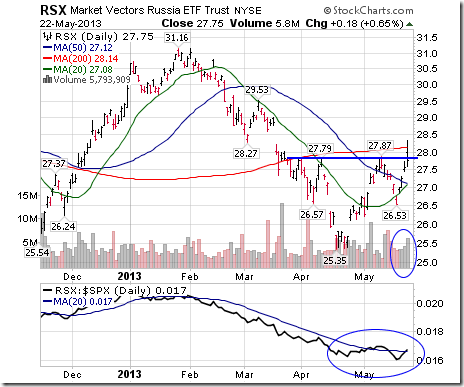
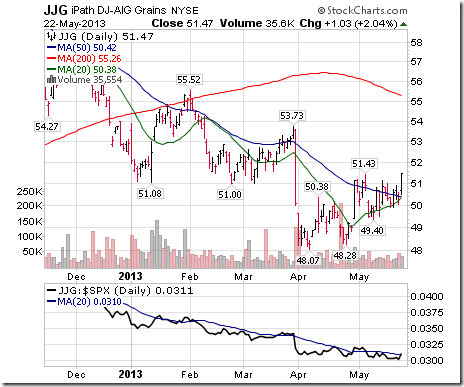
Not all markets and sectors moved lower yesterday. Notable strength was recorded by the Russian ETF and the Grain ETN. The latter is being influenced by problems with planting the grain crop on a timely basis due to weather (cold spring, tornado season)
Special Free Services available through www.equityclock.com
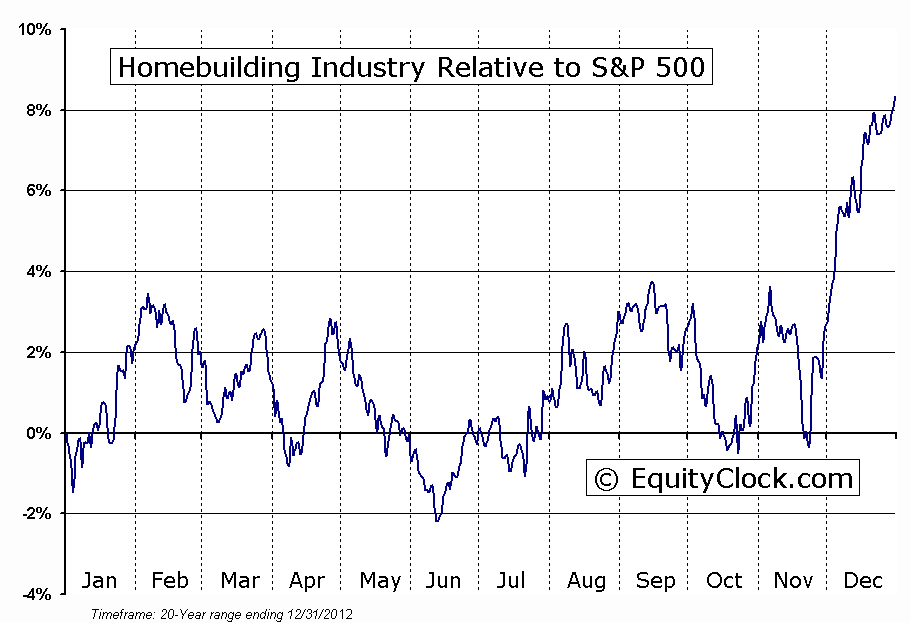
Equityclock.com is offering free access to a data base showing seasonal studies on individual stocks and sectors. The data base holds seasonality studies on over 1000 big and moderate cap securities and indices. Notice that most of the seasonality charts have been updated recently.
To login, simply go to http://www.equityclock.com/charts/
Following is an example:
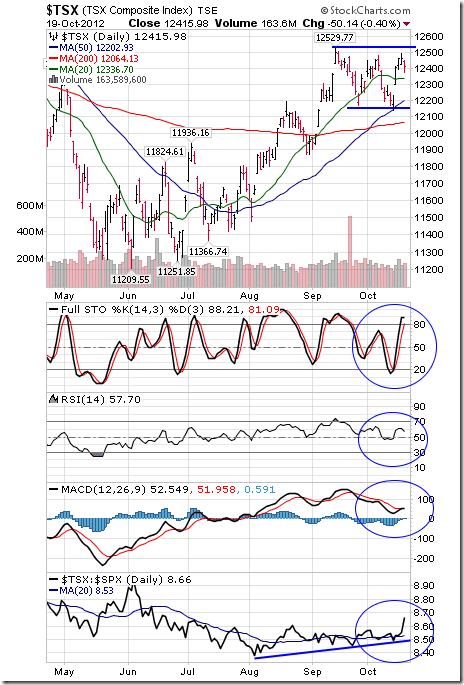
S5HOME INDEX Relative to the S&P 500

 Stocks, bonds – everything – at risk
As the global equity and bond markets grind ever higher, abundant signs exist that we are once again living through an asset bubble – or rather a whole series of bubbles in a variety of markets. This makes this period quite interesting, but also quite dangerous.
With equity and bond markets at or near all-time record highs, with all financial assets consistently shrugging off bad – or worse – news as the riskiest of assets continue to find consistent upward bids, we find ourselves in familiar and bubbly territory.
I can summarize my thoughts in one sentence: How could this be happening again so soon?
In times past, it took one or more generations between bubbles for people to financially recover and forget the painful lessons before they would consider doing it all again. Yet here we are, working our way through our third set of bubbles in less than two decades, which must be some sort of world record.
I will confess to my biases right up front: I have always been deeply skeptical of both the practice of running up debts at a faster pace than income (the common practice of the entire developed world over the past several decades) and the idea that the solution to too much debt is more debt, enabled by cheaper money courtesy of thin-air money printing.
In short, instead of seeing central banks as sophisticated stewards of intricate monetary policies, I view them as serial bubble-blowers and reckless debt-enablers whose only response, when confronted with the inevitable consequences of their actions, is to serve up more thin-air money at an even cheaper rate. And when that doesn’t work, then they simply try even more of the same, but in larger quantities.
While I think central banks are populated by earnest people with impressive credentials who have rationalized their actions as being necessary and in service of the greater good, I also think that the biggest ones hold an entrenched set of institutional views that are dogmatic, fail to incorporate the idea of economic and resource limits, and are seemingly immune to healthy introspection.
Somewhere along the way, I would have hoped they might have noted that each new crisis is larger than the one before – necessitating an even larger response that begets an even larger crisis next time, etc., and so on. A corporate bond hiccup in 1994 led to monetary loosening that enabled the development of the Long Term Capital Management (LTCM) fiasco of 1998, which was followed by the tech bubble, and then the housing bubble, and here we are with a now global equity and bond bubble that is larger than all the prior bubbles combined. Much larger.
It was famously said that the market can remain irrational longer than you can remain solvent. And if the trading maxim, don’t fight the Fed, is worth heeding, then surely one should absolutely not take on all of the central banks at once, either. So, the risk I run here in seeing things through my ‘common sense’ filter is that perhaps this time the Fed, et al., have got it right, and a true and lasting recovery is at hand.
With that caveat, in this report I lay out the five most worrisome signs that horrific market losses await the unwary, the careless, the reckless – and those who possess all three characteristics (i.e., your average central bank).
These are not normal times. The degree of separation between reality and today’s financial markets is extreme, which means they have a tremendous degree of potential energy stored up that could erupt in a downward cascade at any time.
While we can’t predict the exact time or trigger of a market avalanche back down to reasonable levels, I can definitely advise that you do not want to be standing in the valley when it happens.
Four Signs That We’re Bubbling
HERE are the four things including charts that convince me that we are in truly bubbly territory:

……just as metal Miners Mount a Powerful Reversal off Multiyear Support: (Asian gold premiums hit new highs as Europe urged to start “aggressive QE”)
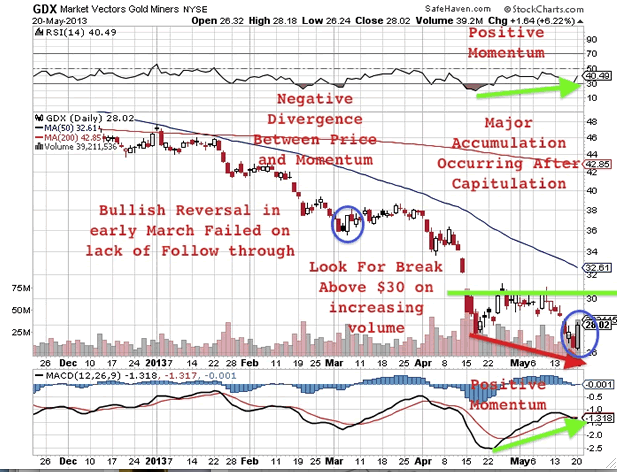
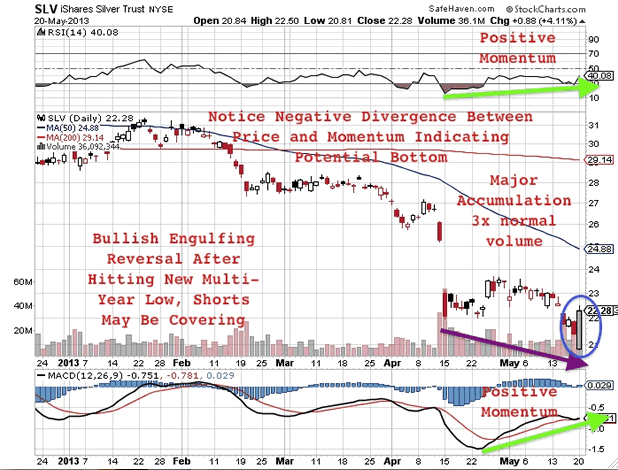
Jeb Handwerger wrote nearly a month ago that “The Worse Things Were For The Mining Sector, The Better They Will Get”. This was after the first downward plunge in gold (GLD) and silver (SLV) in April due to the Goldman short (update from Jeb below:)
Now four weeks later, gold, silver and the miners (GDX) tested that April low and even fell below it only to reverse higher than the previous day’s selling. Across the precious metals board, we witnessed bullish engulfing patterns. We witnessed a similar reversal back in October of 2011 in the S&P500 (SPY) when we called for a bullish upturn in equities. See the video update from back then.
We saw today (Monday) gold, silver and both the large and junior miners (GDXJ) dip lower at the open and close above Friday’s high on more than triple average volume. This is a significant technical development as it means the gold bulls have regained control at a key technical low.
Silver hit a five year trailing average in the low 20s and gold hit a three year trailing average below $1350. Multi-year support should hold after this downturn for close to two years.
This is one of the first major bullish engulfing’s since the decline and may suggest that a low is in place and the end of the decline may be near. It at least cautions a short term reprieve of the recent downturn.
This technical occurrence happened at the same time as Moody’s threatens a credit downgrade for the United States. According to them not enough is being done in the U.S. to bring down soaring deficits. Don’t forget the downgrade from the S&P in August of 2011 sent gold soaring to $1900.
Do not be surprised to see a reemergence of sovereign debt issues in the United States. The U.S. dollar (UUP) and long-term Treasury bonds (TLT) have been direct beneficiaries of the recent Japanese yen (FXY) devaluation and may soon see topping action. This could spark a rally into the commodities (DBC), energy (XLE), precious metals and the miners which historically has a negative correlation with bonds and dollar strength.
Disclosure: Author does not own securities in article.
STOCKS: Another Tuesday another rally marking the 19th consecutive up session for that day.
Today we were helped by comments by two regional Fed Presidents who assuaged investor fears that QE may be winding down. Also, Goldman Sachs increased their year end target from 1575 to 1750.
On Wednesday Bernanke speaks before the Joint Economic Committee of Congress and it’s doubtful that he will say anything bearish.
GOLD: Gold had been down over 20, but came back to close down only $4. Not bad chart action.
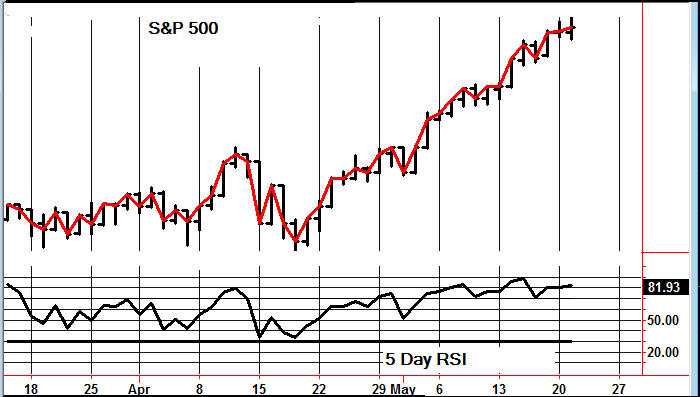
CHART: Yes, we are very overbought, but the S&P 500 keeps making a series of ascending tops and ascending bottoms. As long as this continues, the uptrend is intact.
DOW + 52 on 200 net advances
NASDAQ COMP + 6 on 150 net advances
SHORT TERM TREND Bullish
INTERMEDIATE TERM TREND Bullish
TORONTO EXCHANGE: Toronto was up 129.
S&P\TSX Venture Comp: The Venture Comp rose 5.
BONDS: Bonds rebounded slightly.
THE REST: The dollar was up. Silver, copper and crude oil were down somewhat.
BOTTOM LINE: Our intermediate term systems are on a buy signal.
TODD MARKET FORECAST Stock Market, Gold and Bond Advice
RANKED # 1 BY TIMER DIGEST
Timer Digest of Greenwich, CT monitors and ranks over 100 of the nation’s best known stock market advisory services.
Once per year in January, Timer Digest publishes the rankings of all services monitored for multiple time frames.
For the years 2003, 2004 and 2005, The Todd Market Forecast was rated # 1 for the preceding ten years. For the year 2006, we slipped to # 3 and in 2007, we were ranked # 5.
Our bond timing was rated # 1 for the years 1997, 2007 and 2008.
Gold timing was rated # 1 for 1997 and # 2 for 2006. Late word! We were rated # 1 for 2011.
We were # 1 in long term stock market timing for the years 1998 and 2004 and # 4 in 2010.
To subscribe go to Contact Us.
1. Huge rallies begin from these conditions
Below is the NYSE Gold Miners Index which is tracked by the GDX ETF. Look at the RSI. Not only did it reach a multi-decade low but it has remained oversold far longer than during the comparable periods. In the four previous periods, the market rebounded suddenly and strongly in percentage terms. Meanwhile, the bullish percent index, a breath indicator is more oversold than in 2008. We plot the indicator with a 10-week moving average that shows it as far more oversold than in 2008. While this indicator does not go back that far, odds are it is likely at a 13-year low.
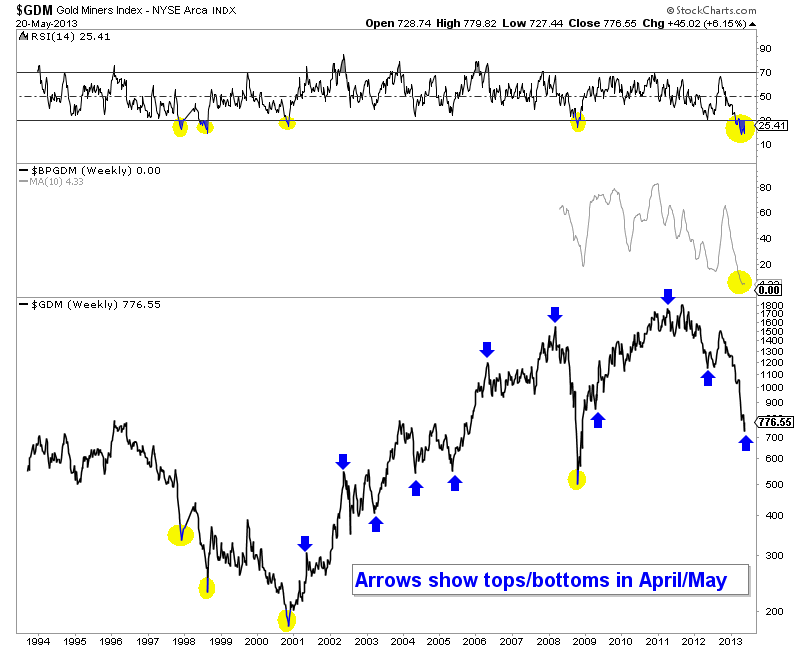
2. Springtime is usually a turning point for gold stocks.
According to seasonal analysis, precious metals usually peak in the late spring. However, a study of the past 12 years shows that its more apt to say that spring is a turning point. In the above chart we mark the tops or bottoms that occurred in April or May. Assuming we are presently at a bottom then spring will have marked a turning point in gold stocks during 11 of the past 13 years.
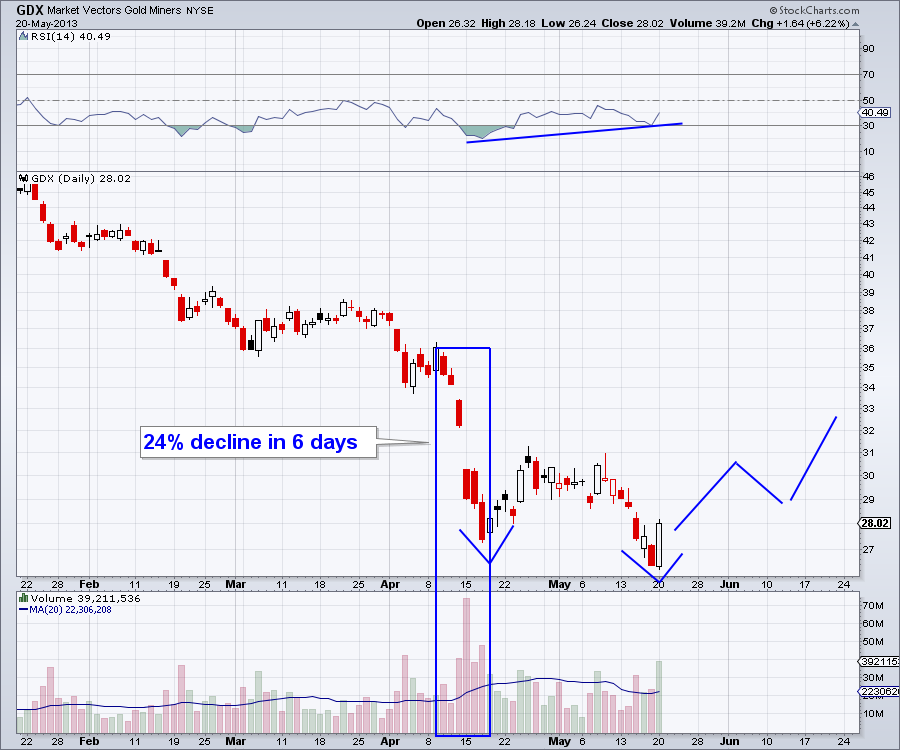
3. A selling climax already occurred and the recent low is a false breakdown.
The selling climax occurred in April when GDX declined 24% in only six days. The 20-day volume average peaked days later at 30 million shares. The previous high was 21.5 million shares in June 2012. GDX has also formed a bullish RSI divergence and Monday reversed on record up volume. Prior to Monday, recent weakness was on average volume which was substantially less than during the selling climax. This is a subjective thought but this potential bear trap and false breakdown could be the retest. When you get a failed retest that is a trap or false move it can result in a V bottom. Look for a potential head and shoulders bottom or a V bottom. Finally, if the RSI pushes above 50 then that is a good sign.
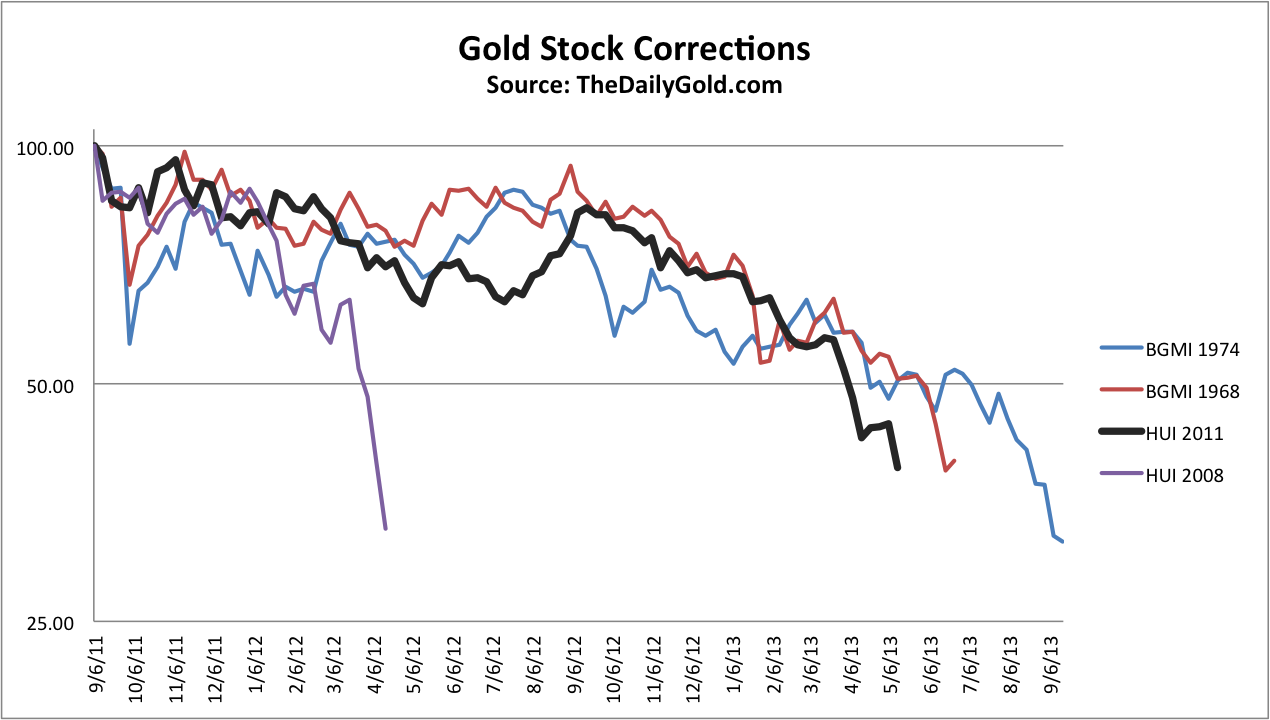
4. History suggests the cyclical bear is just about over
Each secular bull market in gold shares has endured two major cyclical bear markets. The chart below, which uses weekly data shows the four corrections. It is possible this correction could last a bit longer and move a bit deeper but in the big picture, the next big move is higher, not lower.
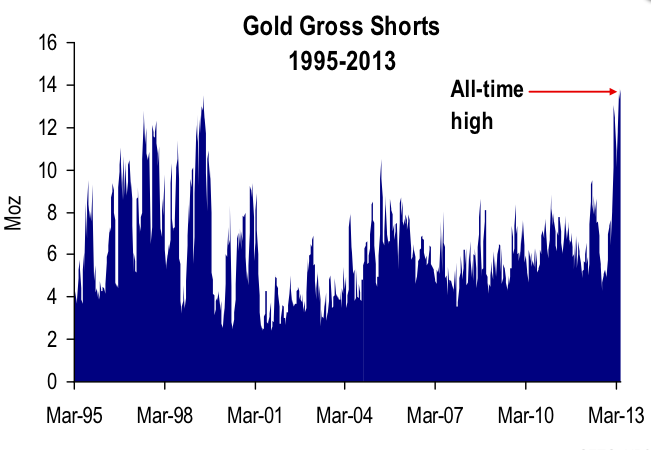
5. There is potential for a huge short squeeze.
Gross short positions are at all-time highs. Some short positions were covered as Gold rebounded from its crash low at $1320. After the rebound fizzled short positions reached an all time high. Gold has formed a short-term double bottom. Without a doubt, short covering contributed to Monday’s huge reversal. If Monday’s rebound is sustained, look for a torrent of short covering to follow.
There you have it. It’s been a tough road for precious metals but the path ahead has strong potential of being significantly profitable compared to these levels. If you’d be interested in our analysis on the companies poised to recover now and lead the next bull market, we invite you to learn more about our service.
Good Luck!
Jordan Roy-Byrne, CMT

-
I know Mike is a very solid investor and respect his opinions very much. So if he says pay attention to this or that - I will.
~ Dale G.
-
I've started managing my own investments so view Michael's site as a one-stop shop from which to get information and perspectives.
~ Dave E.
-
Michael offers easy reading, honest, common sense information that anyone can use in a practical manner.
~ der_al.
-
A sane voice in a scrambled investment world.
~ Ed R.
Inside Edge Pro Contributors

Greg Weldon

Josef Schachter

Tyler Bollhorn

Ryan Irvine

Paul Beattie

Martin Straith

Patrick Ceresna

Mark Leibovit

James Thorne

Victor Adair