
Stocks & Equities
 And How to Invest in 4D Printing….
4D Printing Potential Makes Me Drool
After more than 30 years in the markets, I’ve seen all kinds of new technologies that are supposed to change the world. Most are pumped by little-known companies with overly hyped marketing, aggressive underwriters, and little more than vaporware. To say I’m jaded would be an understatement.
But I ran across something recently that positively made my mouth drop.
We already know about 3D printing. It’s all the rage right now, because you can buy a printer for a few thousand bucks and cook up whatever your computer can plot.
But 4D printing?
…..read all about it and the companies to invest in HERE
Ed Note: Here is the latest remarkable story about 3D printing (scroll down): Need a Hand? Boy Gets Prosthetic Hand Made by 3-D Printer (Cost $5 vs. $30,000 Medical Device)

U.S. stocks rose, with the Standard & Poor’s 500 Index reaching a third straight record, as earnings from Pfizer Inc. to Xylem Inc. beat estimates and data indicating slower growth fueled bets the Federal Reserve will maintain stimulus.
“It still seems that the Fed has created this good news is bad news, bad news is good news scenario,” Randy Bateman, who oversees $15 billion as chief investment officer of Huntington Asset Advisors in Columbus, Ohio, said by telephone. “The anticipation is that the Fed will retain its purchasing of $85 billion in monthly Treasury and mortgage securities, which is going to continue to help the housing market. That will be taken fairly well by the market.”
The S&P 500 climbed in 12 of the past 14 sessions through yesterday, as companies beat estimates in the current earnings reporting season and signs of slower economic growth fueled bets the Fed will maintain stimulus measures after its two-day meeting that started today. The rally has pushed the index up 24 percent this year, leaving it poised for the best annual gain in a decade.

In our previous commentary we discussed the implications that the most recent moves in the USD Index and the general stock market are likely to have on the precious metals market. Today, we will briefly discuss two parts of the PM market: silver and mining stocks (precisely: SLV and GDX ETFs). We summarized the previous essay in the following way:
(…) the impact that the USD Index and the general stock markets are likely to have on the precious metals market is weak and bullish on a short-term basis, but more meaningful and bearish in the medium term.
Since that essay was posted, we have seen a small move higher, which was in perfect tune with the above. Now, however, it seems that it is the medium-term decline that we should focus on as the resistance levels have already been reached in case of silver and mining stocks. That‘s the case with gold as well.
Let’s take a look at the SLV ETF chart (charts courtesy of http://stockcharts.com.
Looking at the above chart we see that the SLV ETF moved above the 50-day moving average and reached the medium-term declining resistance line (based on daily closing prices – February and August highs) in the previous week.
Although silver closed the week slightly above its 50-day moving average, which is a bullish sign, we didn’t see a breakout above the medium-term declining resistance line in the following days. On top of that, we saw a move lower after silver reached it.
From this point of view, it seems that further increases will likely be limited, especially when we take into account the fact that silver’s cyclical turning point is just around the corner. Therefore, it’s quite possible that we will see its impact on silver in the coming days. This can lead to a pause or even stop further increases.
Can we see a confirmation of the above in the chart featuring mining stocks? Let’s have a look at the whole senior mining stocks sector with Market Vectors Gold Miners ETF as a proxy.
On a short-term basis, we have seen strong performance since mid-October. Additionally, in the previous week the GDX ETF broke above the declining resistance line and continued its rally in the following days. In this way, yesterday, it reached a resistance line – the neck level of the previously completed head and shoulders pattern. The 50-day moving average was not successfully broken and the temporary move above the 38.2% Fibonacci retracement level was invalidated. The latter provides us with bearish implications for the short term. In other words, it looks like the rally that was likely to happen, is already behind us or quite close to being over (we wouldn’t rule out another move to the „neck“ level, but we don’t think that we will see a confirmed breakout above it).
Summing up, although we‘ve seen an upward move in silver in recent days, it hasn’t changed much from the medium-term perspective. When we factor in the impact of the USD Index and general stock market that we discussed in the previous essay, silver‘s cyclical turning point, which is just around the corner, and the fact that the short-term resistance lines have already been reached in case of the GDX ETF, we can presume that the top of the recent upward move in the precious metals may be already in (or is very close to being in). In fact, we have suggested closing speculative long positions in yesterday’s Market Alert.
Thank you for reading.
Przemyslaw Radomski, CFA
Founder, Editor-in-chief
Gold Price Prediction Website – SunshineProfits.com
From 80.2 in September, US Consumer confidence collapsed to 71.2 (the largest MoM drop in 2 years) to its lowest in six months.
Drew Zimmerman
Investment & Commodities/Futures Advisor
604-664-2842 – Direct
604 664 2900 – Main
604 664 2666 – Fax
800 810 7022 – Toll Free
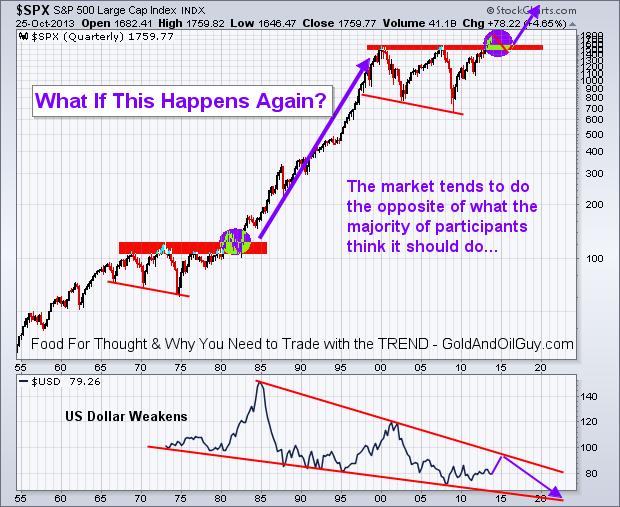
My Stock market trend analysis is likely different from what you think is about to unfold. Keep an open mind as this is just showing you both sides of the coin from a technical stand point. Remember,the market likes to trend in the direction which causes the most investor pain.
Since the stock market bottom in 2009 equities has been rising which is great, but this train could be setting up to do the unthinkable. What do I mean? Well, let’s take a look at the two possible outcomes.
The Bear Market Trend & Investor Negative Credit
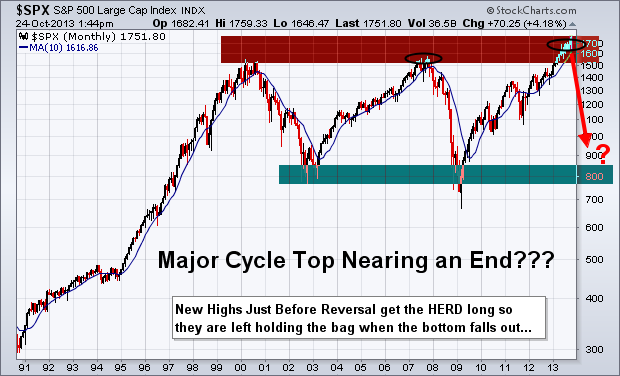
The S&P500 has been forming a large broadening formation over the last 13 years. The recent run to new highs and record amounts of money being borrowed to buy stocks on margin has me skeptical about prices continuing higher.
Take a look at the chart below which I found on the ZeroHedge website last week. This chart shows the SP500 index relative to positive and negative investor credit balances. As you can see we are starting to reach some extreme leverage again on the stock market. I do feel we are close to a strong correction or possible bear market, but we must remember that a correction may be all we get. It does not take much for this type of borrowed money to be washed clean and removed. A simple 2-6 week correction will do this and then stocks will be free to continue higher.
Monthly Bearish Trend Outlook
Below you can see the simple logical move that should occur next for stocks based on the average bull market lasts four years (it has been four years) and the fact the negative credit is so high again.
Also, poor earnings continue to be released for many individual names across all sectors of the market. While corporate profits may be holding up or growing in some of the big name stocks, revenues are not. This means the big guys are simply laying off workers and cutting costs still.
Overall the stock market is entering its strongest period of the year. So things could get choppy here with strong up and down days until Jan. After that stocks could start to top out and eventually confirm a down trend. Keep in mind, major market tops are a process. They take 6-12 months to form so do not think this is a simple short trade. The market will be choppy until a confirmed down trend is in place.
Monthly BULLISH Trend Outlook
This scenario is the least likely one floating around market participant’s minds. It just does not seem possible with the global issues trying to be resolved. With the Federal Reserve continuing to print tens of billions of dollars each month inflating the stocks market this bullish scenario has some legs to stand on and makes for the perfect “Wall of Worry” for stocks to climb.
The US dollar is likely to continue falling in the long run, but I do not think it will collapse. Instead, it will likely grind lower and trade almost in a sideways pattern for years to come.
Major Stock Market Trend Conclusion:
In summary, I remain bullish with the trend, but once price and the technical indicators confirm a down trend I will happily jump ships and take advantage of lower prices.
Remember, this is big picture stuff using Monthly and quarterly charts. So these plays will take some time to unfold and within these larger moves are many shorter term opportunities that we will be trading regardless of which direction the market is trending. As active traders and investors we will profit either way.
Get My Reports Free at: www.GoldAndOilguy.com
Chris Vermeulen

-
I know Mike is a very solid investor and respect his opinions very much. So if he says pay attention to this or that - I will.
~ Dale G.
-
I've started managing my own investments so view Michael's site as a one-stop shop from which to get information and perspectives.
~ Dave E.
-
Michael offers easy reading, honest, common sense information that anyone can use in a practical manner.
~ der_al.
-
A sane voice in a scrambled investment world.
~ Ed R.
Inside Edge Pro Contributors

Greg Weldon

Josef Schachter

Tyler Bollhorn

Ryan Irvine

Paul Beattie

Martin Straith

Patrick Ceresna

Mark Leibovit

James Thorne

Victor Adair