
Stocks & Equities
A subscriber said he had heard a number of talking heads claiming that we are in a secular bull market, and he wondered what I thought. My gut reaction was to say “no way”, but then I got to thinking about it.
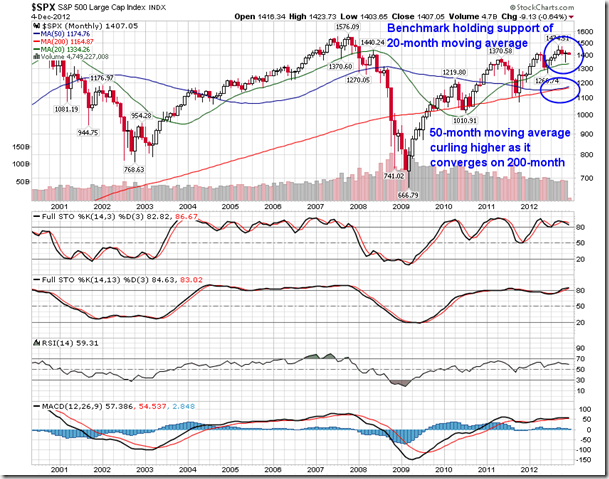
A secular market refers to a market trend that persists over decades. I pulled up a very long-term chart and noted that the last secular bull market began off the bear market low in 1974. The first clue we would have had that something big was brewing was when the S&P 500 Index broke out of the ragged trading range it had been in during the 1960s and 1970s.
Now note that the S&P 500 has recently broken out of a trading range that spans more than a decade.
[Must Listen: One-on-One With Jim Puplava: Are We in a Stock Market Bubble?]

Let’s look at a shorter time frame on a linear chart. The breakout is much more dramatic in this context, and the breakout leg is about one-third the width of the trading range. Pretty convincing, so, yes, I would have to say that, based upon these charts we could be in the early stages of a secular bull market. But so what?

The impression that some secular bull proponents would like to make is that we are in for many, many years of steady price appreciation, but secular bull markets are still vulnerable to cyclical bear markets, some of which can be quite severe — case in point, the 1987 Crash. Also, note that the 1980 breakout was followed by a sharp decline back the the top of the trading range. This is the usual technical expectation after a breakout.
The main thing to remember is that we won’t know if it is a secular bull market until after the fact or at least long after it begins. I must say that the breakout looks promising, but it won’t change my basic strategy, which is to try to avoid significant pullbacks in the intermediate-term.
Conclusion: Trading ranges are referred to as continuation patterns because prices are expected to exit them in the same direction they were in before they entered the consolidation trading range. The long-term breakout we are observing is a very positive sign, and supports the idea that a secular bull market is in progress. But the next technical expectation is for price to pull back toward the point of breakout. Let’s see how that goes.
I will probably get some mail pointing out all the fundamental reasons why my conclusions must be wrong, but what I tried to do is set aside everything but the technicals. I think they are pretty clear.
The above content was an excerpt from the January 17, 2014 blog for Decision Point subscribers. Click here for a free trial.

“You can’t trust the Russians,” was the warning. It came from a Moscow cab driver, delivered to our son Henry. We had sent him to investigate.
From our point of view, it was an unnecessary caution. We never trusted the Russians anyway. Or the Chinese. Or the Democrats. Or wealth managers. Or General Petraeus. Or people from north of Baltimore or west of Hagerstown.
But what the heck?
You need confidence to buy Amazon. Or Google. Or Chipotle. You need confidence to buy a US T-bond, too. Or to let a contractor remodel your house on time and with the right materials.
But Russian corporate earnings are so cheap right now (in terms of the price-earnings ratio) you don’t need to trust Russians to profit from the situation there.
It’s why the Russian stock market is our top recommendation to members of our small family wealth advisory, Bonner & Partners Family Office (of which we have some important news below).
Since 2009, the world’s central banks have put an additional $8 trillion into the global economy. But this flood of liquidity has left Mother Russia high and dry.
The “trailing” P/E (based on 12-month “as reported” earnings) for Russian stocks is 5.7. This is in stark contrast to the S&P 500, which is trading on a trailing P/E of nearly 18.9. (In other words, a dollar of underlying Russian earnings is selling at a nearly 70% discount to a dollar of S&P 500 earnings.)
“It is priced for a crisis,” says Robert Marstrand, the British former investment banker who serves as the chief investment strategist at our little family wealth project. “And there is no crisis.”
Another colleague, Merryn Somerset Webb, editor of British finance magazine MoneyWeek, adds that Russian stocks are:
… cheap relative to everywhere else, and cheap relative to Russia’s own valuation history. Both measures are now much where they were back in 2008, and not far off half their averages over the last 10 to 15 years.
You will say that this makes sense. After all, who wants to pay normal prices for assets which are based in a very abnormal state? Surely anything dependent on a slowing economy, that is in itself dependent on gas and oil, is to be utterly shunned? As is any investment that comes with the appalling corporate governance on offer in Russia.
These are all perfectly good points. But there is cheap and there is cheap.
At current prices, investors are practically pricing in the return of Stalin, says Merryn.
So, we asked Henry to go to Moscow to have a look on behalf of Bonner & Partners Family Office. (We like to put “boots on the ground,” as they say. If those boots belong to a family member, all the better.)
We Owe the Soviets a Great Debt
“Russian companies are very inefficient. And they work in a world that makes it hard to get things done,” Henry reports.
“But you have to understand that Russians lived for 70 years in an economy that didn’t care about getting anything done. Output didn’t really matter.”
Before taking the capitalist road, Russians had an economy where, as one worker put it, “We pretend to work. They pretend to pay us.”
We owe the Soviets a great debt. They continued their experiment with central planning for seven decades. It should have been obvious at the get-go that you can’t increase output by letting bureaucrats run your economy. From the start, real, useful output began falling in the Soviet Union.
But God bless ’em. The Soviets kept up with it until they had proved conclusively that their centrally planned economy wouldn’t work.
Even now, the economy still suffers from serious problems – many of them the residue of the Great Experiment.
In the 1990s, the average Russian man had a life expectancy 20 years shorter than the average American. And according to former Goldman Sachs chief economist Jim O’Neill, who coined the term the BRICs, more than 60% of all Russian males over 40 die drunk.
And after the Berlin Wall fell, the Russian birth rate collapsed. In 2004, fewer than 11 children were born for every 16 Russians who died.
But Russian president Vladimir Putin has made some progress in this regard. A campaign to get rid of low-quality vodka has helped Russian men continue drinking longer. Now, male life expectancy in Russia is only 13 years below that of the US.
The Kremlin is working hard to try to keep their taxpayers from disappearing… and create even more of them. In 2007, for example, the City of Ulyanovsk organized a special “day of conception.” Workers were told to go home and go to bed. Prizes were given to those who had children nine months later.
Russia can be a tough place to do business. Businessmen, politicians and journalists often die under suspicious conditions. In 2003, the richest man in the country, Mikhail Khodorkovsky, was arrested. He spent the next 10 years in jail, on what looked to many like trumped-up charges. (Recently, the Kremlin announced he was being released.)
Even “outsiders” aren’t above reproach. Bob Dudley, the CEO of BP, was forced to flee Russia in 2008 in the wake of a management dispute and trumped-up tax-evasion charges (which were later dropped). Despite these annoyances, money is money. Russian companies may be benighted and labor in a world of woe. But they generate earnings. And you can buy these earnings at some of the lowest multiples in the world.
Henry concludes:
I was skeptical when I first arrived in Russia. But I came away confident that there is a real opportunity in Russia to take advantage of this country as it catches up with the rest of the world. What’s great about Russia is that the earnings are already there – we don’t have to buy “pie in the sky.
Regards,
Bill
Market Insight: Why Russia Is a Contrarian’s Dream Right Now
From the desk of Chris Hunter, Editor-in-Chief, Bonner & Partners
As you can see from the chart below of major market price-earnings ratios (P/Es), the Russian stock market is deeply unloved by investors right now.

That makes Russian stocks a contrarian’s dream right now…
We’ve been pounding the table on this opportunity both here at the Diary and at Bonner & Partners Family Office. We like to think of it as a “bull opportunity in the Russian bear.”
That’s because price-earnings multiples (and stock prices) are mean reverting. They may veer far from their historic average. But over time, they move back toward the average.
This is another way of saying that all things move in cycles. Nothing goes in one direction forever. No tree grows to the sky. And few things go to zero.
A case in point is Russian stocks. The last time P/Es were this low, in 2008, the Russian market rose by 167% over the next three years. And the time before that, in 2001, investors made 328% gains over the following three years.
You may not like Russia. You may not even trust Russians. But our advice is to trust in the power of mean reversion and the outsized returns you can pocket by leveraging this powerful force. Buy a Russian index fund now and hold for the long term. We expect at least 100% gains from this investment.
Ed. Note: This is exactly the sort of setup we look for at Bonner & Partners Family Office. That’s because family wealth investors have one big advantage most ordinary investors do not: time. Over time, you can put Mr. Market’s mood swings to your advantage. Buying when assets are out of favor… holding for the long term… and selling again when they are in vogue.
We believe passionately that this is the single best way to build wealth over time. That’s why, starting today, we’ll be sending you a series of bonus reports on what family wealth investing is all about. And how you can use the strategies developed by Bill and his team to build and protect your own portfolio. Look out for them in your inbox later today.
THE STOCK MARKET OUTLOOK FOR JANUARY 17, 2014
Upcoming US Events for Today:
- Housing Starts for December will be released at 8:30am. The market expects 0.985M versus 1.091M previous. Building Permits are expected to show 1.015M versus 1.007M previous.
- Industrial Production for November will be released at 9:15am. The market expects a month-over-month increase of 0.3% versus an increase of 1.1% previous. Capacity Utilization is expected to tick up to 79.1% versus 79.0% previous.
- Consumer Sentiment for January will be released at 9:55am. The market expects 83.5 versus 82.5 previous.
- Labor Department’s Job Openings and Labor Turnover Survey for November will be released at 10:00am. The market expects Job Openings to show 3.93M versus 3.925M previous.
Upcoming International Events for Today:
- Great Britain Retail Sales for December will be released at 4:30am EST. The market expects a year-over-year increase of 2.6% versus an increase of 2.0% previous.
- China GDP for the Fourth Quarter will be released on Sunday at 9:00pm EST. The market expects a year-over-year increase of 7.6% versus an increase of 7.8% previous. Industrial Production for December is expected to show an year-over-year increase of 9.8% versus an increase of 10.0% previous. Retail Sales for December is expected to show a year-over-year increase of 13.6% versus an increase of 13.7% previous.

The Markets
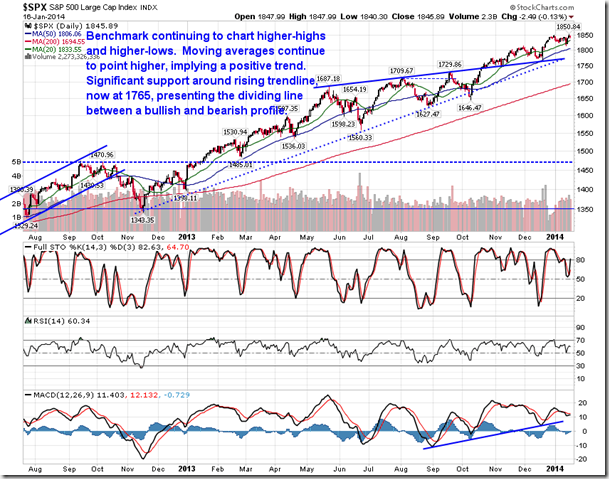
Stocks ended generally lower on Thursday as the financial sector dragged down the major benchmarks following lacklustre earnings results from Goldman Sachs and Citigroup. Shares of Citigroup and Goldman Sachs declined by 4.35% and 2.00%, respectively, falling back towards rising intermediate trendlines. Significant moving averages (20, 50, and 200-day) continue to point higher, implying positive short, intermediate, and long-term trends. Financial stocks, including Goldman Sachs and Citigroup, remain in a period of seasonal strength through to April.


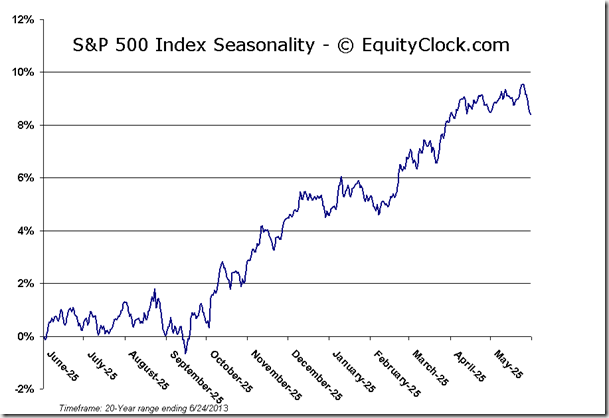

Thursday had all of the traits of a risk-off session: defensive sectors (Utilities, Health Care, and Consumer Staples) all posted gains on the day, gold posted marginally positive returns, and bonds ended higher on the day. One of the risks to the seasonal investing strategy over the next few months is that a period of risk-aversion materializes, whereby bonds, gold, and defensive equities outpace broad equity markets, forcing investor rotation from cyclical assets to alternate allocations. Seasonally, from late January through to the beginning of May, high-beta, cyclical equities typically dominate, posting gains on average and outperforming broad market benchmarks, such as the S&P 500. The iShares 20-Year Treasury Bond Fund (TLT) is giving the appearance of a significant double bottom pattern, suggesting a bounce from support may be underway, potentially drawing equity investors back to the fixed income asset class, perhaps for a brief period of time. Bond prices seasonally decline through to April as riskier assets attract investor demand, however, the path of least resistance for the bond market appears to be higher. A risk-off period doesn’t necessarily mean lower stock prices, but it could imply that some of the drivers of performance of broad market benchmarks may take a backseat role. Significant lag versus the market is already becoming apparent in the consumer discretionary sector, one of the best performing segments of the market for well over a year. The Consumer Discretionary sector remains in a period of seasonal strength that runs through to April.

And with sectors like Consumer Discretionary dragging on the broad market in the US, benchmarks outside of the US are showing signs of outperformance. The MSCI EAFE, which is essentially composed of international equities outside of North America, is starting to show signs of outperformance versus the S&P 500. Looking at a long term chart of the MSCI EAFE ETF (EFA) versus the S&P 500 ETF (SPY), the relative trend of EFA has been charting a significant base-building pattern since mid-2012, ending almost 5 years of relative declines that saw US stocks outpace the rest of the world. Opportunities outside of the US are starting to become apparent. The MSCI EAFE seasonally outperforms the S&P 500 from February through to April/May.

Seasonal charts of companies reporting earnings today:


Sentiment on Thursday, as gauged by the put-call ratio, ended bullish at 0.78.
S&P 500 Index

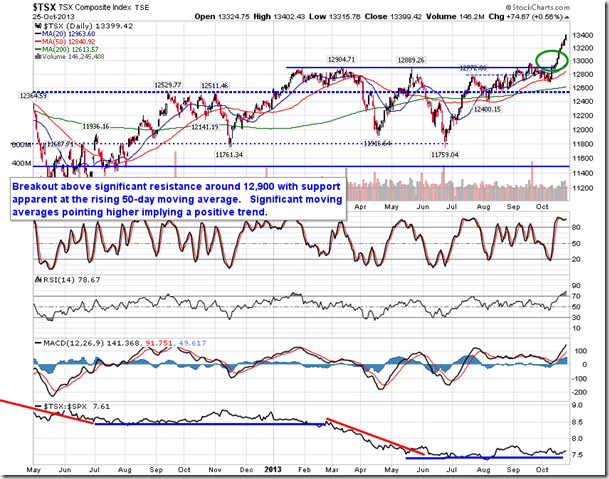
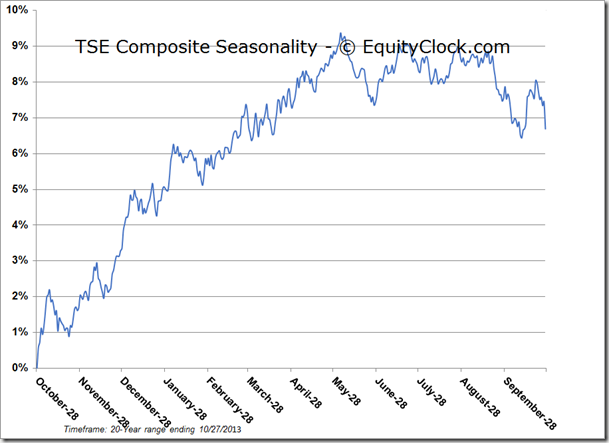
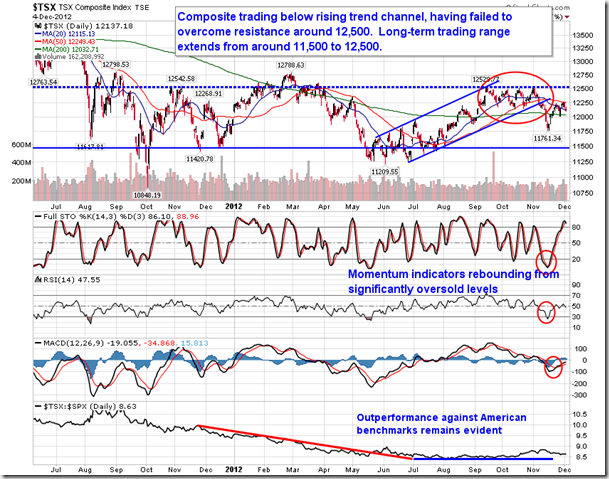
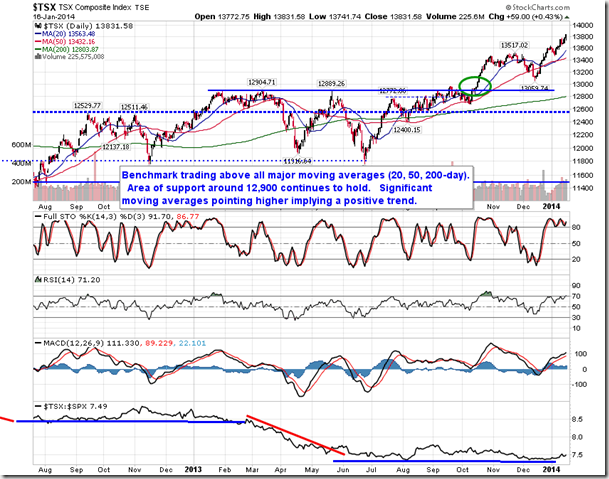
TSE Composite

Horizons Seasonal Rotation ETF (TSX:HAC)
- Closing Market Value: $14.32 (down 0.14%)
- Closing NAV/Unit: $14.33 (down 0.06%)
Click Here to learn more about the proprietary, seasonal rotation investment strategy developed by research analysts Don Vialoux, Brooke Thackray, and Jon Vialoux.

| Sponsored By… |
www.scotiabank.com/MutualFunds

U.S. stocks fell, with the Standard & Poor’s 500 Index retreating from a record as bank earnings disappointed investors. Treasuries climbed and nickel advanced a fifth day while Turkey led declines in emerging-market shares.
The S&P 500 lost 0.1 percent to 1,845.89 by 4:30 p.m. in New York, leaving the gauge down 0.1 percent this year. Ten-year Treasury yields fell for the first time in three days. Turkey’s benchmark gauge slid almost 2 percent after the lira weakened to a record low and the Stoxx Europe 600 Index slipped from a six-year high. Nickel capped the biggest five-day rally since 2011 and U.S. natural gas rose to a three-week high while gasoline, Brent crude oil and copper led commodity decliners.
….for more details on Earnings Analysis, U.S. Inflation, Emerging Bonds, Commodity Markets, European Moves & specific stocks go HERE
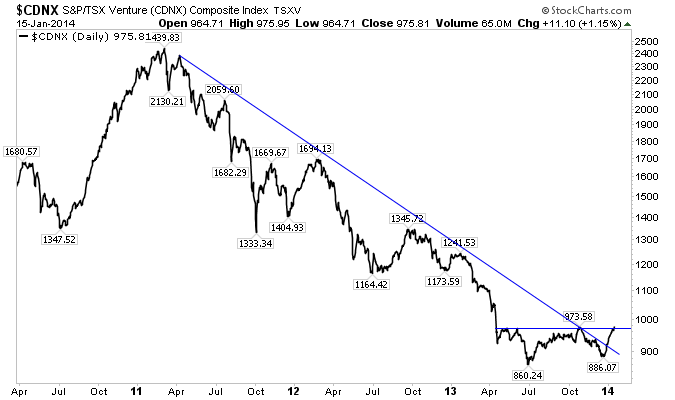
There is no need to beat around the bush. Junior mining stocks have bottomed. The bear market is over. Sure we could be wrong. We’ve been wrong before and will be again. However, the evidence is too compelling and is growing by the day.
The TSX Venture (CDNX) is the market for juniors in Canada. The market consists of exploration companies focused on precious metals and other minerals, energy companies and some technology companies. It’s not a perfect indicator for the junior mining industry but it’s good enough for the experts. On Thursday the CDNX closed at a nine month high. No, that is not a misprint. The junior market reached a nine month high. It bottomed in late June, made a higher low in December and has surged 10% since.
Click HERE or on chart for larger view:
For an American, GDXJ is the proxy for junior gold stocks or junior miners. I like to think of GDXJ as the “senior” or established juniors. The CDNX consists of many stocks trading under $1 and a $100M market cap while GDXJ is mostly comprised of companies in the $100M to $500M market cap range.
GDXJ declined 81% from its April 2011 peak to its December 2013 bottom. As we noted several weeks ago, GDXJ tried to penetrate its December low three times and failed. The market has since rallied back above the previous (June) low. Given the severity of the bear in terms of price and time, extreme negative sentiment and recent bullish price action I believe it is highly likely that the bottom is in.

Our frame of reference for the bear, the gold stock bear analogs chart continues to suggest that the bear market in senior gold stocks is all but over.
Click HERE or on chart for larger view:
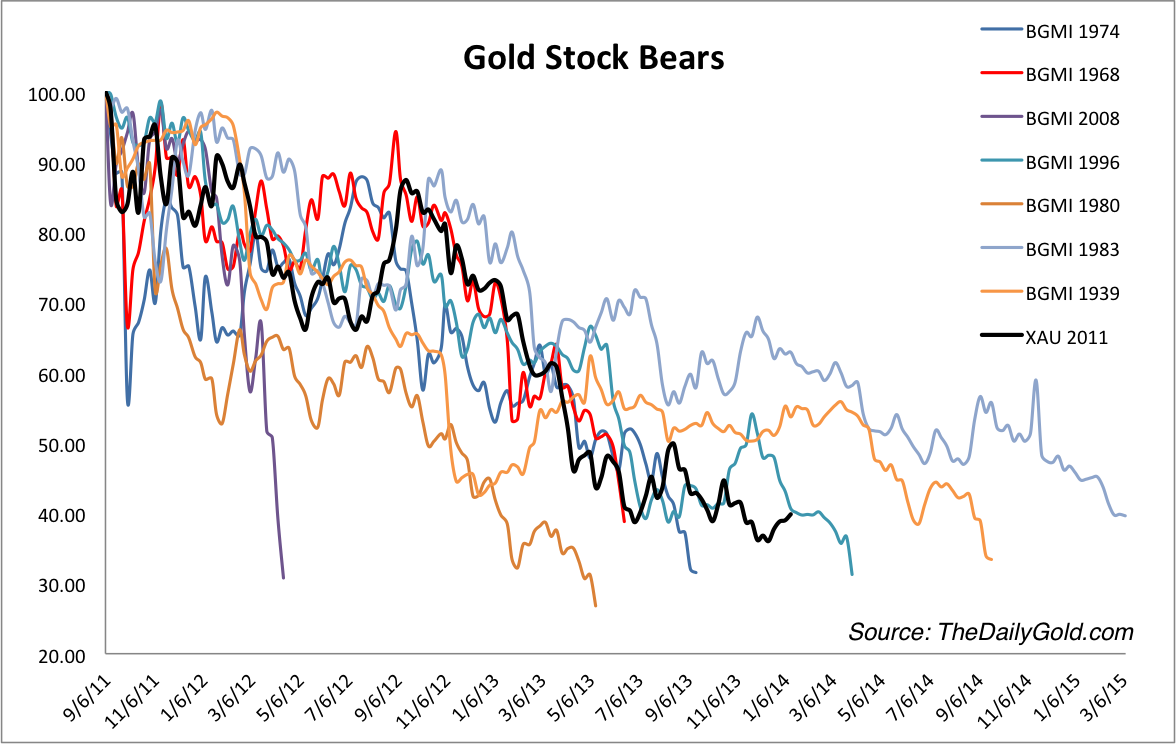
The juniors (both CDNX and GDXJ) peaked in April or five months before the senior gold producers. Hence, it makes sense that the juniors would bottom first. The assertion from the analogs chart (that the seniors may have bottomed or are very close) gives us further confidence that the juniors have bottomed.
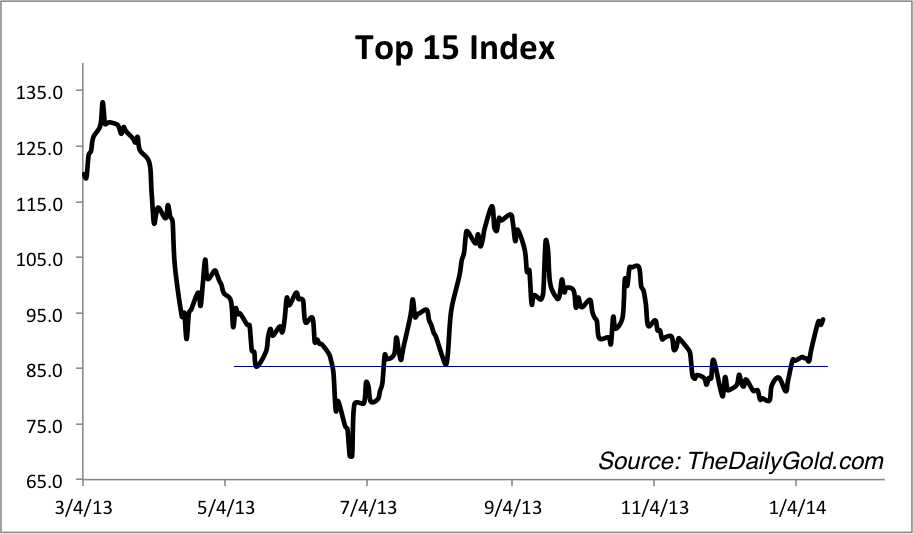
Most of the stocks that we follow bottomed in June. The following chart, which was sent to premium subscribers is an equal weighted index of 15 of our favorite gold and silver stocks. The index bottomed in late June 2013 and made a strong higher low in December. It would have to decline 26% to test the June low.
Click HERE or chart for larger view:
Extreme bearish sentiment, compelling valuations and an extreme oversold condition can create a compelling contrarian opportunity. However, that opportunity can remain far fetched without some positive price action. We now have the positive price action that allows us to call a bottom in the mining stocks and strongly so in the junior gold stocks. The CDNX looks to have made a real double bottom and closed at a nine month high. GDXJ reversed course after failing to continue a breakdown when the time was ripe. Moreover, as evidenced by our top 15 index, the stronger and higher quality companies are showing leadership. The risk has shifted from getting caught in a final plunge to missing out on the rebound. If you’d be interested in learning about the companies poised to rocket out of this bottom then we invite you to learn more about our service.
Good Luck!
Jordan Roy-Byrne, CMT

-
I know Mike is a very solid investor and respect his opinions very much. So if he says pay attention to this or that - I will.
~ Dale G.
-
I've started managing my own investments so view Michael's site as a one-stop shop from which to get information and perspectives.
~ Dave E.
-
Michael offers easy reading, honest, common sense information that anyone can use in a practical manner.
~ der_al.
-
A sane voice in a scrambled investment world.
~ Ed R.
Inside Edge Pro Contributors

Greg Weldon

Josef Schachter

Tyler Bollhorn

Ryan Irvine

Paul Beattie

Martin Straith

Patrick Ceresna

Mark Leibovit

James Thorne

Victor Adair