
Stocks & Equities
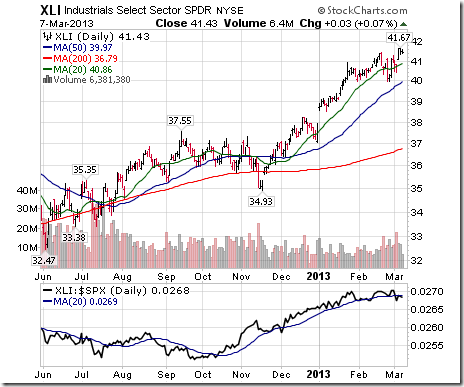
Short term weakness provided a trader’s buying opportunity last week. Preferred strategy is be selective with a focus on sectors that have a history of outperformance at this time of year.
Equity Trends
The S&P 500 Index added 14.43 points (0.81%) last week. Trend changed from neutral to negative on a move below 1,767.99. The Index remains below its 20 and 50 day moving averages. Short term momentum indicators are oversold and showing signs of recovery.

Percent of S&P 500 stocks trading above their 50 day moving average rose last week to 44.60% from 40.00% after bottoming at 25.20%.

Percent of S&P 500 stocks trading above their 200 day moving average increased last week to 74.40% from 71.80% after bottoming at 61.60%.
Bullish Percent Index for S&P 500 stocks fell last week to 63.60% from 69.00% and remained below its 15 day moving average. The Index remains in an intermediate downtrend.
Bullish Percent Index for TSX Composite stocks was unchanged last week at 70.71% and remained below its 15 day moving average. The Index remains intermediate overbought.

The TSX Composite Index added 91.56 points (0.67%) last week. Trend remains up (Score: 1.0). The Index moved above its 20 day moving average on Friday (Score: 1.0). The Index continues to outperform the S&P 500 Index (Score: 1.0). Technical score based on the above indicators is 3.0 out of 3.0. Short term momentum indicators are neutral.
Percent of TSX stocks trading above their 50 day moving average increased last week to 64.20% from 60.08%. Percent remains intermediate overbought.

Percent of TSX stocks trading above their 200 day moving average increased last week to 72.69% from 71.43%. Percent remains intermediate overbought.
….continue reading the Economic News This Week & viewing another 40 charts HERE

Our Blog started to recommend short positions on select stock market sectors starting on Jan 16 through Jan 23, because we believed that a shift was taking place that would reverse existing trends that have been in place since 2011, and possibly even 2009. Our premise finally starts being acknowledged by a few at the beginning of February, although a lot of analysts are still suggesting the bull market will continue after a required period of correction. We beg to differ and we will use the three popular Dow charts – Industrials, Transports and Utilities – to demonstrate our thoughts on this matter.
First, the Dow Jones Industrials in the weekly chart below has developed a large bearish wedge pattern (as have most other market indexes) beginning back in 2009 from where this cyclical bull market began. You will note that the trendline from that 2009 bottom has been broken during the recent decline, as well as a minor horizontal support level at 15,800, that now becomes resistance. More importantly, the underlying momentum in the second panel of the chart failed to confirm the Dec 2013 new high, and it formed a head and shoulders top pattern that has now broken below the red dotted signal neckline. This implies that the Dow Industrials will move down to the next support neckline on the price chart, which currently sits around the 14,700 level. After that, I would expect at least 3~4 months of consolidation as we develop a right shoulder of what looks like will be another head and shoulders pattern that takes us even lower.
(Click on images to enlarge)
….two more charts & commentary HERE

“Watch history unfold”
“Old timers remember the terrible Dust Bowl of the 1930s. Now we have the “Dry Bowl” of the 2000s. The West is now suffering from the longest period of no rain and aridity in memory. It’s going to drive up the price of all agriculturals. For years I’ve been telling fellow San Diegans to plant cacti instead of grass. These people used to laugh at me. They no longer laugh.
Since infancy I’ve always been ultra-sensitive to danger. For this reason I have never been caught in a primary bear market — my sensitivity to impending danger (and Dow Theory) has always saved me and my subscribers. But this time my unconscious fear is unrelenting, and it won’t leave me alone.
 Finally, I’ve admitted it to myself. I’m afraid we’re in a primary bear market in the economy and the stock market. I believe it’s going to be an absolute “brute.” And I’m afraid of what might lie ahead.
And the worst of it is that we’re being deliberately lied to by the Fed and by our government. The markets (which normally tell us the truth) are being controlled and manipulated by the government and the Federal Reserve.
Ben Bernanke is reputed to be an “expert” on the Great Depression of the 1930s. I don’t know about his expertise regarding the Depression, but I’m damn sure Bernanke doesn’t understand markets.
I’ve asked myself why Bernanke got himself into this predicament? I believe his problem is that he studied the Great Depression strictly from the standpoint of economics and the Fed’s role in the Depression. But Bernanke never studied nor understood the role of the stock market during the 1930s.
I had the fortunate experience of studying the events of the 1930s under the tutelage of the great Dow Theory genius, E. George Schaefer. George understood the power and essence of the primary trend more thoroughly than any analyst I have ever known. I consider a thorough knowledge and understanding of the primary trend the single most important and least understood area of stock market analysis.
I sincerely doubt whether Yellen will realize that we are now in a resumption of the primary bear market that started in 2000. I liken the whole current picture to a ship that has sprung a terrible leak and the captain is waving an empty bottle while singing, “Happy days are here again.”
Ironically and tragically, Bernanke continues to believe that his Fed stimulus will render the US economy so healthy that by the end of this year, Fed stimulus will no longer be needed. Bernanke’s reign at the Fed is over, and the job now falls to Janet Yellen. I doubt if Yellen’s knowledge of markets is any better than Bernanke’s. If so, I wish her well, but I don’t envy her. As the situation becomes progressively more bearish, my best guess is that Yellen will continue to fight the primary bear trend with all the ammunition at the Fed’s command.”
Russell added: “Tuesday’s weak action was a continuation of the “dead cat bounce” correction of the recent crash. Although the Dow ended weakly, losing about five points, it seems to me the Transports, down 59 points as I write, are leading the way for this market. GLD and CEF closed a bit higher. And Treasuries closed lower, pushing rates higher. I’ll remind subscribers that the economy continues to slide in this bear market, regardless of minor stock fluctuations.
Interestingly, big box retailers are losing their middle class buyers, and it’s only the wealthy that are brightening their favorite retail stores, such as Tiffany and Nordstrom. The battered middle class are frequenting their favorite discounters, leaving their previous favorites such as Target, JC Penney and Best Buy wondering why their same store sales are fading. Again I advise subscribers to stay on the side and watch history unfold.”
Russell began publishing Dow Theory Letters in 1958, and he has been writing the Letters ever since (never once having skipped a Letter). Dow Theory Letters is the oldest service continuously written by one person in the business.
Russell gained wide recognition via a series of over 30 Dow Theory and technical articles that he wrote for Barron’s during the late-’50s through the ’90s. Through Barron’s and via word of mouth, he gained a wide following. Russell was the first (in 1960) to recommend gold stocks. He called the top of the 1949-’66 bull market. And almost to the day he called the bottom of the great 1972-’74 bear market, and the beginning of the great bull market which started in December 1974.
Letters are published and mailed every three weeks. We offer a TRIAL (two consecutive up-to-date issues) for $1.00 (same price that was originally charged in 1958). Trials, please one time only. Mail your $1.00 check to: Dow Theory Letters, PO Box 1759, La Jolla, CA 92038 (annual cost of a subscription is $300, tax deductible if ordered through your business).
Twitter Inc’s shares fell almost 25 percent on Thursday, wiping out about $9.8 billion in market value, after the company reported a sharp slowdown in user growth.
The stock, which debuted at $26 in November, hit a low of $50 in early trading. The shares hit a peak of $74.73 in late December as investors bet that the social media platform could become as ubiquitous as Facebook.
Analysts, unlike investors, were divided on the company’s outlook a day after it reported fourth-quarter results. – full article HERE
Figure 1 is a weekly chart of the SP500 with the $VIX data hidden. The indicator in the lower panel assesses the current value of the $VIX relative to pass swing points in that data. There are two points worth making.
TACTICAL BETA is 100% FREE — QUANTITATIVE STRATEGIES on GOLD, BONDS, EQUITIES — GO NOW!
WEEKLY
Since April, 2013 the indicator has been diverging negatively from the price action. (I have been making this point since September, 2013; see this video.) The failure of the $VIX to break below a value of 12 and the failure of the indicator to confirm the highs in price are noteworthy. These distortions are now being corrected. The indicator is rolling over, and a bottom in prices won’t be achieved until the indicator hits bottom as well. This is several weeks away. Thus the trend in prices is down.
(For the record this is what I said on January 14: “The $VIX has failed to break 12 or rather more importantly, a level of 12 continues to be where selling in the equity markets takes place. I have contended that the inability of the $VIX to break below the 12 level is a sign that the current market rise is not sustainable, and this divergence has been going on for over 6 months now. In essence, the $VIX has failed to confirm the price action. More importantly, it appears that the rocky start by the equity markets this week will see the $VIX close above a prior key pivot point. This always suggests caution as the possibility of a trend change in the equity markets is very real.”)

DAILY
But there is hope!!
Figure 2 is a daily chart of the SPY with the $VIX data in the lower panel. The $VIX is sitting at a level where 4 out of the 6 short term/ intermediate term bottoms took hold in 2013. Will 2014 be the same? This is the test for the $VIX and the markets. Look for the markets to put up a fight, but from this perspective, the tide has already turned.
TACTICAL BETA is 100% FREE — QUANTITATIVE STRATEGIES on GOLD, BONDS, EQUITIES — GO NOW!

-
I know Mike is a very solid investor and respect his opinions very much. So if he says pay attention to this or that - I will.
~ Dale G.
-
I've started managing my own investments so view Michael's site as a one-stop shop from which to get information and perspectives.
~ Dave E.
-
Michael offers easy reading, honest, common sense information that anyone can use in a practical manner.
~ der_al.
-
A sane voice in a scrambled investment world.
~ Ed R.
Inside Edge Pro Contributors

Greg Weldon

Josef Schachter

Tyler Bollhorn

Ryan Irvine

Paul Beattie

Martin Straith

Patrick Ceresna

Mark Leibovit

James Thorne

Victor Adair