
Stocks & Equities
You are lucky. Below stock picking ace Ryan Irvine reiterates the case that Buffett makes that investment returns like Ryan’s Boyd Group which moved from his pick at $2.30 to its recent close at $23.00 is something that you can do, but Buffett can’t. In short, Buffett’s $280 Billion under managment means he cannot buy small cap stocks like you can.
Ryan outlines below the 10 criteria that a small cap stock that has big potential has to make. Small caps that can gain 9 fold like Boyd, or the 50% that Ryan’s pick from March of 2013 has already gained. A stock that still ranks as one of the cheapest stocks in Canada based on cash flow multiples. Yes, Buffett’s picks are rock solid, but Ryan’s great small-cap stocks carry the big potential for profits that as Buffett spells out below wishes he could pursue. – Editor Money Talks.
 Market Buzz – Buffett Wishes He Could Buy These Stocks
Do you know why Warren Buffett recently added to his position in Wal-Mart Stores Inc. (WMT:NYSE)? It’s not because the world’s largest retailer is an untold secret, or growing earnings at 35% annually (it’s not), or because Buffett got a sweetheart deal (he didn’t). It’s simple; Buffett bought more shares in Wal-Mart because the company is really, really big.
Yes, Wall-Mart is a solid company. But the law of large numbers tells us it is far more difficult to double profits from $17 billion than from a base of $1, $5, or even $17 million.
For Buffett, Bigger is Better
Towards the beginning of Buffett’s investing career, it wasn’t uncommon for the Oracle of Omaha to post 30% or 40% annual returns in Berkshire Hathaway’s (BRK-B NYSE) equity portfolio. But as the size of the capital base at Buffett’s disposal grew larger, those stock returns began to shrink. “We do need to deploy cash, but we can’t put many billions to work every year in spectacular businesses,” Buffett said. “To move the needle at Berkshire, they have to be big transactions.”
In the aftermath of the 2009 and 2011, Buffett’s biggest investments were in blue-chip behemoths like Johnson & Johnson (NYSE: JNJ), Wal-Mart (WMT:NYSE), and Wells Fargo (WFC:NYSE).
Those are all great companies, to be sure, but it is unlikely they will propel Buffett’s portfolio to those 30% and 40% annual returns he generated in the past. And they certainly won’t help Buffett realize the 50% annual returns he famously stated he could achieve if he had less money to invest – and could invest in great small-cap stocks.
“Anyone who says that size does not hurt investment performance is selling. The highest rates of return I’ve ever achieved were in the 1950s. I killed the Dow. You ought to see the numbers. But I was investing peanuts then. It’s a huge structural advantage not to have a lot of money. I think I could make you 50% a year on $1 million. No, I know I could. I guarantee that.”
– Warren Buffet
Unfortunately, Buffett understands his predicament all too well. “Size is always a problem,” Buffett told The Wall Street Journal’s Jason Zweig. “With tiny sums [to invest], it’s extraordinary what you can find. Most of the time, big sums are one hell of an anchor.”
Anchors aweigh!
So what would Buffett buy if he weren’t relegated to the realm of blue chips? We think he’d be scooping up shares of great small-cap stocks. After all, they have historically outperformed large-cap stocks — a gap that has widened over the past 35 years:
![]()
Undoubtedly, Buffett could get these higher returns – and better. Unfortunately, it’s impossible for him to buy small-cap stocks. But before we get to why Buffett can’t buy small caps, let’s look at why small caps outperform in the first place.
Massive Potential Returns
By definition, smaller companies have much more room to grow. With annual revenue of about $470 billion, Wal-Mart probably won’t be tripling that number anytime soon. The relatively tiny independent auto repair shop operator, Boyd Group Income Fund (BYD-UN:TSX) on the other hand, one of the longest standing stocks on KeyStone’s Focus BUY List, has more than tripled its revenue over the past 4.5 years, increased earnings by more than 4.5 times, and its stock price skyrocketed as a result.
For comparison purposes, below we see that Wal-Mart was a decent buy in 2008 as the financial crisis hit and its shares traded in the $55 range. Over the past 5 years, the stock has returned around 48% including dividends.

But the Small-Cap’s gains are astonishing over the same period. The Boyd Group and its simple car repair business which was recommended to KeyStone’s Premium Small-Cap Research clients in November of 2008 at $2.30 has seen it shares rocket to recently close at $23.00. In fact, over that period, the company has created such strong cash flow it has distributed over $1.60 per share in distributions (dividends) to shareholders on top of the tremendous share price gains. Again it has paid us $1.60 in cash and we bought the shares for $2.30!
On top of their room to grow, small caps don’t attract much attention from Wall & Bay Street analysts. In fact, in 2008, KeyStone was the only research firm covering the Boyd Group. This means savvy investors are more likely to find mispriced stocks when fishing in small-cap waters. It appears that Bay Street is finally beginning to catch on to the Boyd Group story, but there are still dozens of compelling small-cap companies monitored by just one or two analysts or zero — and many more that receive no analyst coverage at all!
Size Matters
So why doesn’t Buffett buy underfollowed small-cap stocks that could very well triple? It’s simple: He can’t.
Let’s revisit Buffett’s quote from earlier in the article: “We can’t put many billions to work every year in spectacular businesses,” Buffett said. “To move the needle at Berkshire, they have to be big transactions.”
Even after the Boyd Group had seen its’ share price rocket over 9 fold over the past five years, its market cap is just $295 million. Only about $800,000 worth of stock trades hands each day. Buffett couldn’t buy a stake in the company without driving the share price up significantly. And even if he were to buy the company outright, that $295 million purchase would barely register in Berkshire’ $280 billion investment portfolio.
In other words, researching a small-cap company like the Boyd Group, no matter how promising its prospects, simply isn’t worth Buffett’s time.
But it’s Definitely Worth Our Time
Individuals who invest dollar amounts in the thousands, however, should be scouring the markets every day for the next Boyd Group. It’s the only way to even approach those 30% or 40% annual returns.
But be forewarned: Just because a company is small and underfollowed does not guarantee Boyd Group like returns. Consider the case of Canadian frac water tanks provider Poseidon Concepts Corp., a former high-flying small cap that traded to $15 but crashed to zero when the market discovered its business was more than flawed with limited barriers to entry. Thankfully, the company never met our criteria, which has grown stronger overtime.
That’s why in addition to great growth prospects and limited (or no!) analyst coverage, our team of experts at KeyStone’s Small-Cap Research seeks out small caps that have:
- A strong balance sheet
- Positive cash flow
- Attractive Valuations
- Potential for a dividend (or dividend increase)
- A management team with a significant share ownership.
- A business we can understand.
- Operations in relatively safe jurisdictions.
- A positive industry outlook or niche outlook.
- Potential for hidden assets
- Market-beating potential over the next three to five years.
Our top pick from March of this year (2013) has already gained over 50% and still ranks as one of the cheapest stocks in Canada based on cash flow multiples. The company is servicing the energy sector in both the U.S. and Western Canada, in particular, where a coming LNG boom should provide an excellent stream of infrastructure growth for the next decade. Sign-up and find out about this undervalued, growing small-cap today – KeyStone is currently the only independent coverage on the stock.
Over the upcoming weeks, we will introduce two new buys to our Focus BUY list – solid businesses, producing strong free cash flow, trading at low valuations with strong growth prospects – not unlike Boyd just a few years ago.
Sign-up today to our Special Offer below to ensure you will be one of the first investors to get in on these cash producing, potential small-cap gems today!
Special VIP Small-Cap Membership Offer – 1 Year Platinum Level 3 Research Service – Click Here to see what the SCR Platinum Membership Includes!
Regular Price: $799
You Save: $300
Your Price: $499 (plus applicable taxes)
SPECIAL RATE CODE: SCR4
Sincere regards,

Ryan Irvine
President & CEO,
KeyStone Financial

How he did it is explained below. It is an interesting technique, as well as pretty simple and easy to replicate as described in full below. There is an offer at the bottom that invites you to sign up for a free week of usage to test it out as a stock selector. I have to assume anyone who signs up for a Free Week of usage will be followed by an automatic charge should you select to make no attempt to cancel your Free Week on time. The do offer a money back guarantee however and thus interesting to anyone who is genuinely interested in a proven stock picking technique that is easy to do – Editor Money Talks
How Peter Lynch Earned 29% a Year for 13 years
When it comes to true investing legends, Peter Lynch is in a league of his own.
The former head of Fidelity’s flagship Magellan Fund produced an annualized rate of return of 29.2% over his 13-year stint at the helm. This track record secured his place as the best mutual fund manager of all time.
So how did he do it? It’s not as complicated as you think…
In his best selling book, One Up On Wall Street, Lynch revealed a powerful charting tool that greatly simplified his investment decisions.
Deemed the “Peter Lynch chart”, this simple graph plots the stock price against its “earnings line” – a theoretical price equal to 15 times the earnings per share.
When a stock traded well below it, he would buy. When it rose above it, he would sell.
Not exactly rocket science, is it?
The idea behind this technique is simple. Lynch (and most other successful money managers) believe that mature, stable companies are worth roughly 15 times their annual earnings. And over the last 135 years, this has proven to be the mean valuation of the S&P 500 index.
This is known as a the P/E ratio. It is merely the price of the stock divided by its earnings per share. The resulting multiple represents how many times you are paying for last year’s earnings at today’s stock price.
All things being equal, the lower the number the better. Low P/E ratios mean that you are getting more earnings for your investment dollar. And since most large cap stocks eventually trade for at least 15 times earnings, you are more likely to see your shares appreciate as they return to the 15 P/E level.
This simple idea was the basis of Lynch’s investment approach and the reason he created his now famous chart.
The chart consists of only two lines. The first is the stock price. The second is the hypothetical stock price if it were to trade at a P/E of 15 (the earnings line). As Peter Lynch explained,
“A quick was to tell if a stock is overpriced is to compare the price line to the earnings line. If you bought familiar growth companies – such as Shoney’s, The Limited, or Marriott – when the stock price fell well below the earnings line, and sold them when the stock price rose dramatically above it, the chances are you’d do pretty well.”
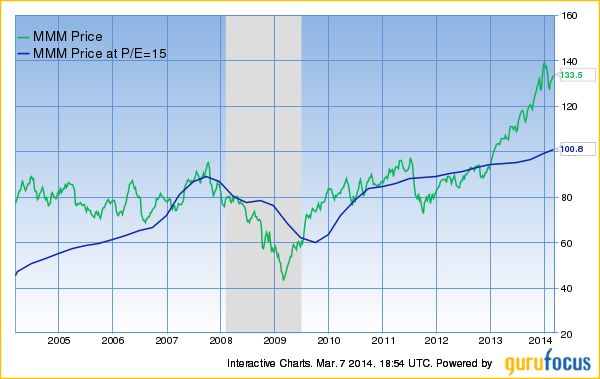
Take Walgreens (WAG) for example. The Peter Lynch chart below shows a 10-year history of the stock price and the earnings line.
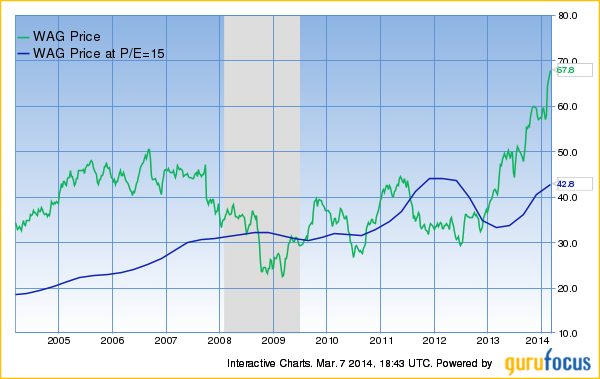
Most nvestors who bought the stock when it was trading above its earnings line experienced very small gains or even losses. However, buying Walgreens at any price below the earnings line led to sizable gains.
The same pattern can be found with almost any familiar US stock. Oracle (ORCL) and Wal-Mart (WMT) are all shown below:
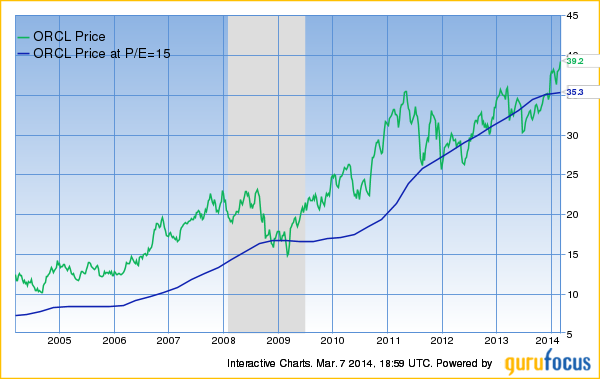
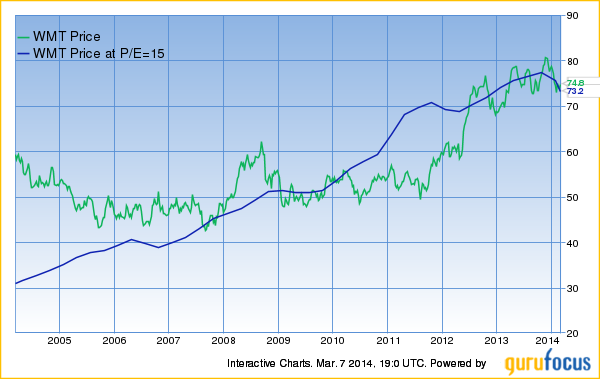
It is a well-known fact among investors that price follows earnings. Over multi-year periods, stock prices move in sync with changing company earnings.
But over the short term, stock prices are unpredictable. This creates valuable oportunities for savvy investors and turns the Peter Lynch Chart into PURE GOLD! Using the chart on any of the stocks above would have produced some very impressive gains.
GuruFocus is one of the only places to access this powerful tool.
Try it for FREE:
- Input a stock symbol in the search bar in the top left corner of the homepage.
- Select ‘Interactive Chart’ from the dropdown list.
- Just below the Interactive Chart tab is a ‘User Defined Chart’ menu.
- Select ‘Peter Lynch Chart’ and the rest is done automatically.
We encourage you to give it a try. Check your own stocks or look for new opportunities. Free members can chart up to 5 stocks at no charge.
Premium members receive UNLIMITED access to this tool along with countless other alerts, scanners, rankings and investment newsletters.
Given the potential cost of buying stocks at the wrong time, our $297 annual membership might be the safest investment you ever make.
CLICK HERE to Learn More about GuruFocus Premium Membership
GuruFocus.com Membership Services
Not a Member Yet?
Take a 7-day Free Trial of Premium Membership. It is risk FREE.
Satisfaction Guaranteed!
If you’re not 100% delighted with the Premium Membership, just let us know. There’s a money-back guarantee with this purchase!
GuruFocus.com Membership Services.

Eddy’s Buy List containing 20 stocks contains Blue Chips like McDonalds & Ford Motor Company thru to red hot Tech Stocks like Ebay & Oracle. The list is still up on the year despite a the overall market being down at this time. Eddy’s Buy List is pretty simple, outlining Buy ranges, Current Prices and a description of each Stock. A short and sweet list of Stocks to Buy for the investor interested in adding to his or her portfolio. Editor Money Talks
Crossing Wall St. – Buy List Updates
“Don’t look for the needle in the haystack. Just buy the haystack!” – John C. Bogle
 This was a quiet week on Wall Street up until Thursday when renewed worries over Ukraine sent the S&P 500 down 1.2%. The index is once again in the red for the year, however, our trusty Buy List remains in the black.
Despite the dearth of news this week, things will get a lot more interesting next week when the Federal Reserve meets on Tuesday and Wednesday. This will be Janet Yellen’s first meeting as Fed Chair. This will also be her first post-meeting press conference. But the most important news is that there’s a very good chance the Fed will officially drop the Evans Rule.
The Evans Rule, named after Chicago Fed President Charles Evans, states that the Fed won’t raise short-term interest rates until the unemployment rate drops below 6.5%. The problem is that the jobless rate is 6.7% at last count and nearly everyone agrees that the economy is nowhere near ready for higher interest rates. The Evans Rule has been in effect since December 2012, and the Fed has been very careful to say that it’s a threshold and not a trigger.
I first talked about the Fed ditching the Evans Rule in CWS Market Review from January 10. I didn’t think it would happen at the time, but I considered the possibility of it happening later this year. Apparently, later is now.
What does the ditching of the Evans Rule mean for us? It’s very good news for investors. I’ll explain more in a bit, but it’s a clear message from the Fed that they’re going to be on the side of investors. Also in this newsletter, I’ll highlight some of the recent news from our Buy List. Plus, I’ll preview next week’s earnings report from Oracle. Larry Ellison’s firm has turned a corner and I expect more good news. I’ll also talk about the recent earnings warning from Bed Bath & Beyond. But first, let’s look at what’s on the Fed’s mind.
It’s Time to Ditch the Evans Rule
In last week’s CWS Market Review, I talked about the debate on Wall Street regarding how much of the soggy economic news was due to the soggy weather. I explained that most of the incoming data confirmed that the cold weather was in fact keeping shoppers at home.
We recently got two more important pieces of evidence that underscored the bad weather hypotheses. Last Friday, shortly after I sent out last week’s newsletter, the Labor Department reported that the economy created 175,000 new jobs in February, which beat expectations. More importantly, it snapped a two-month streak of pretty bad jobs reports. Bear in mind that the jobs report is by far the most important monthly economic report.
The other encouraging news was that retail sales showed its first increase in three months. Retail sales for February rose by 0.3%, which was 0.1% better than expectations. The numbers for December and January were pretty bad. I should add that Thursday’s initial jobless claims report was especially strong; 315,000 Americans filed first-time unemployment claims. That’s the lowest number since November, and the sixth-lowest in six-and-a-half years.
Last Friday’s jobs report showed us that the pre-weather trend of mediocre jobs growth is still in tact. When the bad data came out, some folks started to wonder if the Fed may have started tapering their bond purchases too early. But most Fed officials stuck to their guns and made it clear that unless something really dramatic happened, they were going to continue paring back their monthly bond purchases.
The plan with Quantitative Easing was that the Fed would purchase each month, $85 billion in bonds. That’s $40 billion in mortgage-backed securities and $45 billion in Treasuries. Twice now, the Fed has lowered the monthly number by $10 billion ($5 billion for each group), and they’re almost certainly going to do it again next week.
Is the Labor Market Really Getting Tight?
There are some concerns that the labor market may be getting “tight” right now, meaning there aren’t enough folks out there to fill up the job needs. As a result, wages are starting to rise. I don’t buy this argument. At least not yet. While it’s true that wage growth is starting to creep up, that’s working off a very low base.
The trouble is that the current labor market is in uncharted territory. The workforce participation rate is near its lowest level in more than 35 years. Many folks have simply walked away from the job market. Some of that is due to demographics, most specifically retiring Baby Boomers, but we don’t know exactly how much.
The unsettling aspect of the current jobs market isn’t the high level of unemployed people, but it may be the high level of unemployable people. I hate to sound so negative, but why would the economy rather pay existing employees higher wages than take on new recruits? Like I said, I’m not on board with the tight labor market idea, but the change in workforce participation has been quite startling.
Here’s the bottom line: The Fed will continue to taper. They seem pretty set on that. The Fed wants to get QE out of the way before they start raising interest rates. Right now, most folks expect the first rate increase will come around the middle of next year. The best early warning sign to watch is rising wages. Of course, that’s good news for workers, but at some point that will turn into higher inflation.
We also want to keep an eye on commodity prices which have risen very sharply in the past few months. Coffee prices, for example, have surge dramatically. For now, your local Starbucks can absorb the blow, but at some point, those commodity prices will take a bit out of consumers’ wallets.
The risk/reward ratio is still very much on the side of stocks. Consider that a Buy List stock such as McDonald’s (MCD) currently yields 3.33%. That’s 68 basis points more than a 10-year Treasury bond. In other words, investors are still vastly over-paying for safety. Until interest rise, the math is clearly on the side of stocks. Now let’s look at some of our Buy List stocks.
Oracle Is a Buy Up to $41 per Share
Oracle (ORCL), the enterprise software king, will report fiscal Q3 earnings next Tuesday, March 18. Three months ago, the company told us to expect Q3 earnings to range between 68 and 72 cents per share. That sounds about right to me. They see revenues rising between 2% and 6%.
I’m pleased to say that reports of Oracle’s demise have been greatly exaggerated. The company is far more “cloudy” than a lot of folks realize. Safra Catz, Oracle’s President and CFO, recently said, “We decided that we were really going to lean in to the cloud to get market share.” That they have.
In December, Oracle reported Q2 earnings of 69 cents per share which was at the top their range. Bookings for Oracle’s cloud enterprise offerings jumped an impressive 35%. The weak spot is new software license subscriptions; revenue there fell by 1%.
I’m in the optimistic camp on Oracle for a few reasons. One is I never go against Larry Ellison. I’ve also been impressed by their headway into the cloud sector. The company has reorganized its sales staff and strategy. I also like how Oracle has been buying back its shares. While I’m not normally a fan of buybacks, Oracle is truly reducing share count and thereby raising EPS.
I’m very curious to see what guidance Oracle offers for Q4, which ends in May. The Street expects 96 cents per share which may be a bit too high. I’ll warn you that the bears love to pounce on ORCL. Either way, Oracle continues to be a very good buy up to $41 per share.
Bed Bath & Beyond Shakes Off the Bad Weather Blues
After the closing bell last Friday, Bed Bath & Beyond (BBBY) released a statement saying that the lousy weather had zapped six or seven cents per share off their fiscal Q4 earnings. Their fourth quarter ended on March 1, and the earnings report will come out on April 9.
Let’s look at some math. The home furnishings store now says it sees Q4 coming in between $1.57 and $1.61 per share. The previous guidance has been for $1.60 to $1.67 per share. If you recall, the stock gotten beaten up in January when they lowered their initial guidance of $1.70 to $1.77 per share.
Here’s what’s interesting: I was almost convinced that the market was going to punish the shares at Monday’s open. Didn’t happen. Instead, BBBY was one of the top performers on ourBuy List. It looks like the bad-weather message finally got thru to traders.
The company said that during Q4, a store had to be closed for the entire day due to the bad weather 464 times. On top of that, there were 1,923 partial closings. Obviously people can’t shop at closed stores. There may be good news for BBBY in the future. Williams Sonoma, a close competitor, just reported earnings above expectations thanks to new home construction. That could be a lift for the industry. In fact, the entire retail sector has snapped back recently. For now, Bed Bath & Beyond remains a good buy up to $71 per share.
More Buy List Updates
I wanted to add a few quick notes on some of our other Buy List stocks. Cognizant Technology Solutions (CTSH) split 2-for-1 on Monday. The stock has been weak lately after Infosys, a competitor, gave poor guidance. For the most part, CTSH has been executing much better than Infosys so I don’t know if this is such a bad omen. CTSH is a solid buy up to $56 per share.
The Icahn Vs. eBay (EBAY) battle got even louder, if you can imagine that. This week, eBay (are you sitting down?) rejected both of Carl Icahn’s nominees for eBay’s board. eBay said they’re unqualified and urged shareholder to vote against them. This feud is getting tiresome. eBay has made it clear that they’re not going to sell PayPal. Carl, if you’re reading this, move on. eBay continues to be a good buy up to $62 per share.
McDonald’s (MCD) has made an embarrassing amount of errors recently. That’s why the stock has lagged, and partly why I like it. At BusinessWeek, Vanessa Wong takes a look at how MickeyD’s is working to right the ship. McDonald’s is a good buy up to $102 per share.
That’s all for now. In addition to next week’s Fed meeting, the government will release the industrial production report for February on Monday. Then on Tuesday, we’ll get reports on inflation and housing starts. It will be interesting to see if any of the rise in commodities shows up in consumer prices. I suspect that it’s too early. Be sure to keep checking the blog for daily updates. I’ll have more market analysis for you in the next issue of CWS Market Review!
– Eddy
Named by CNN/Money as the best buy-and-hold blogger, Eddy Elfenbein is the editor of Crossing Wall Street. His free Buy List has beaten the S&P 500 for the last seven years in a row. This email was sent by Eddy Elfenbein through Crossing Wall Street.
The market is speaking to us and it is nervous. Beware the Ides of March, eh, Brute? Perhaps we can still get our ‘Sell May (maybe April) and Go Away’ peak, but models are bearish for 2014, despite Janet Yellen and despite Jeremy Siegel. And, what does Alan Greenspan have to say? While some financial commentators argue that the stock market has turned into a bubble, former Federal Reserve Chairman Alan Greenspan disagrees. “That’s not to say we may not be near highs, but you don’t get the buoyancy, the type of movements – what I would call the equity premium that characterizes a bubble or euphoria,” he told CNBC. Recall, I compared Greenspan to a New York City Taxicab driver who repeatedly slammed on the accelerator, the breaks and then the accelerator during his tenure. Remember, ‘irrational exhuberance’ from the mid 1990s – way, way ahead of the market peak? He was dead wrong. The fact he has now take the opposite position should be warning enough to all of us.
The major averages finished the Tuesday session near their lows with the Russell 2000 (-1.0%) leading the slide. The S&P 500 lost 0.5% with nine sectors ending in the red. Equities indices started the day with modest gains and spent the first two hours of action in the neighborhood of their flat lines.

The DJ was down 67.43 at 16351.43. The record high was posted on December 31 at 16588.25. Downside potential is 14720 when and if the correction resumes under the February 5 low. If I’m wrong and we breakout, the potential toward DJ 18000 emerges.
The S&P 500 was 9.54 at 1867.63, touching 1883.57, a new bull market high on March 7. Upside potential is now ultimately toward 2000. Downside potential is 1627 and then 1480 if we break under 1737.92.
The Dow Transports were down 20.18 at 7560.07, touching 7627.44, a new record high on March 7.
The Russell 2000 was down 13.49 at 1187.05. On March 4 we touched a new bull market high of 1212.82.
The Nasdaq Composite was off 27.26 at 4307.19, touching 4362.50, a new bull market high on March 6. The Nasdaq Composite is being ‘engineered’ higher back up to its record high of 5132.52 from 13 years on March 12, 2000!
Wednesday’s economic data was limited to the Wholesale Inventories report:
Wholesale inventories increased 0.6% in January after increasing an upwardly revised 0.4% (from 0.3%) in December. The Briefing.comconsensus pegged inventory growth at 0.4%. Inventory growth in the durables sector slowed, increasing 0.4% in January after a 1.2% gain in December. Nondurable inventories rose 0.8% in January after falling 0.9% in December. Unfortunately, the strong gain in inventories was likely not planned. Sales, which edged up a slight 0.1% in December, crashed in January and fell 1.9%.
Today, the weekly MBA Mortgage Index will be released at 7:00 ET while the Treasury Budget for February will be reported at 14:00 ET.
Do you subscribe to the Leibovit VR Gold Letter?
It can be purchased at www.vrgoldletter.com. The Leibovit VR Gold Letter tracks precious metals, guns, and energy.
Greenspan: Stocks Aren’t in Bubble Territory
“That’s not to say we may not be near highs, but you don’t get the buoyancy, the type of movements – what I would call the equity premium that characterizes a bubble or euphoria,” he tells CNBC.
“Two or three years ago, we were at the highest level of equity premium, a rate of return on equity that the markets require. We had had the highest equity premium in 50 years. It’s come down a bit.”
Greenspan says the Fed can’t prevent bubbles. “You can try to defuse it. You’ll fail, as we did in 1994,” he explains. “Unless you break the back of the actual euphoria that generates the bubbles, you’re bound to fail. And the result of that is something that is outside the hands of the Fed.”
Asked if there’s a bubble in Silicon Valley acquisitions, Greenspan answers, “Bubbles are not the problem. Bubbles, by definition, will deflate. It’s the institution which holds toxic assets which is a critical issue.”
For example, when the dot-com stock bubble burst in 2000, huge losses resulted. “But it was essentially in those types of institutions which were not leveraged,” he notes.
“At the time, households, they weren’t. Other pension funds, mutual funds, they took a huge hit. But to get a crisis, you need serial default.”
And, of course, no serial default occurred then. “If you look at the effect on the GDP, it was virtually negligible,” Greenspan argues.
He is very concerned about banks being adequately capitalized. “There’s nothing superior to that.” But he’s not too impressed with the Dodd-Frank financial reform law.
“Coming from what’s in Dodd-Frank, the diagnosis is basically wrong,” he maintains.
“We’re getting into a situation where the problem is wholly in the capital area. We went into the Lehman Brothers [crisis] with Lehman holding 3 percent tangible capital. You can’t function that way.”
Dodd-Frank is holding back the economy. “The difficulty is when I was at the Fed we had a few rulings a year,” Greenspan says.
“Those rulings were extended because you had to go through all sorts of loops and circles of discussing with your colleagues and regulatory areas. And we managed to do that.”
But Dodd-Frank includes a huge number of requirements, he adds. “I don’t think there’s enough time to do it,” he said. “And I don’t think it’s going to work. In fact, I wrote an op-ed piece immediately after Dodd-Frank carried on. I said this isn’t going to work, and it hasn’t.”
Don’t hesitate! Sign up today for the 2014 AFM Model!
MARKET SIGN UP TODAY!
MENTORING – ONE ON ONE:
Would you be interested in personal stock market trading mentoring services personally with internationally recognized market guru and former Louis Rukeyser ‘Wall Street Week’ ELF, Mark Leibovit? The answer is personal mentoring services and they are coming soon! Learn the secrets of the Leibovit Volume Reversal (VR) – learn techniques never before published or revealed for the past 40 years! Learn how to interpret and profit from the use of the Leibovit VR ‘Add-on’ indicator whether you are a Metastock user or an ESignal user! Please email us to get on the waiting list at mark.vrtrader@gmail.com.
VR signals are currently available through Metastock and a launch on eSignal is scheduled in the Spring.
Here is an introduction to the eSignal platform with the VR ‘Add-on’ tool coming in the next few weeks:
In the meantime use the following link to sign up for Metastock:
The Volume Reversal ™ is a registered trademark and can only be used or quoted after receiving express written permission fromVRTrader.com and Mark Leibovit.
A fall in copper to near four-year lows combined with increasing concern about China’s economic slowdown sent a wave of unease on Wednesday through world financial markets.
Global stocks fell for a fourth day and copper, often regarded as a proxy for China’s economic fortunes, hit its lowest level since 2010 after Shanghai futures had again fallen by their 5 percent daily limit.
U.S. stock futures prices pointed to another negative start for Wall Street later, with little in the way of U.S. data to drag attention away from the China anxiety.
In Europe, bourses from London to Lisbon tumbled .FTEU3 and safe-haven German government bonds were in demand as the jitters added to the effects of the tug-of-war over Crimea, which has pitted Russia against Ukraine and the West.
“Markets are watching what is happening in copper with awe and trepidation,” said Societe Generale head of currency strategy Kit Juckes. “It’s partly ongoing concern about Chinese growth (or lack thereof) and nagging worries about the Ukraine. And partly it is just that the commodity bubble burst last year and not everyone noticed.”
Copper’s fall follows China’s first domestic bond default which has raised concerns about a possible unraveling of the many loan deals which have used the metal as collateral.
CHINA CHILL
Economists are concerned that recent moves by Beijing to stamp out speculation on its rising currency and overly easy lending may have overshot and will damage the world’s second largest economy.
This is adding to broader strains on emerging markets as they try to cope with shifts in global attitudes while recovering economies such as the United States begin to phase out the cheap money churned out in recent years.

-
I know Mike is a very solid investor and respect his opinions very much. So if he says pay attention to this or that - I will.
~ Dale G.
-
I've started managing my own investments so view Michael's site as a one-stop shop from which to get information and perspectives.
~ Dave E.
-
Michael offers easy reading, honest, common sense information that anyone can use in a practical manner.
~ der_al.
-
A sane voice in a scrambled investment world.
~ Ed R.
Inside Edge Pro Contributors

Greg Weldon

Josef Schachter

Tyler Bollhorn

Ryan Irvine

Paul Beattie

Martin Straith

Patrick Ceresna

Mark Leibovit

James Thorne

Victor Adair