
Stocks & Equities
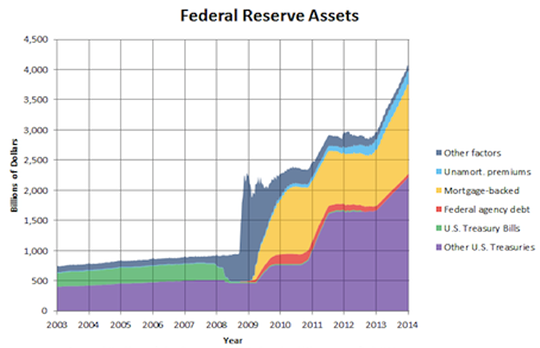
The response by central banks to the 2008 crash has been unprecedented.
As you can see from the chart below, the Fed’s balance sheet has ballooned to more than $4 trillion – or about one-quarter of annual GDP.
Legendary investment manager Jeff Gundlach, of DoubleLine Capital, has an investment rule that every prudent investor should be aware of.
He calls it Gundlach’s Rule of Investment Risk.
It holds that efforts to limit economic volatility in the near-term don’t eliminate risk. Ultimately, the “fixes” end up causing much larger problems further down the line. As he explains:
If you run things and you try to get them very smooth, without ever any downside, you’re trying essentially to eliminate the frequency of problems. I believe the frequency of problems times the severity of problems when they occur equals a constant. Frequency times severity equals a constant. That is Gundlach’s Rule of Investment Risk. When you try unnaturally to push into the future problems, and quantitative easing is designed to do that, you end up increasing the severity of the problem.
In other words, you can have two scenarios: (1) frequent, yet shallow recessions or (2) infrequent, yet deeper recessions.
The Fed, the Bank of England, the Bank of Japan and the European Central Bank have all gone for option No. 1.
If Gundlach is right, that means a much more severe problem down the line.
Further Reading: Bonner & Partners senior analyst Braden Copeland has prepared a special report for investors worried about the next crash… and what to do when it comes. Braden details six stocks to buy and hold in the next panic. Find out what they are here.

The chart below shows the S&P TSX Real Estate, Gold, Energy and Financial Services Indices as well as the Bank of Canada Commodities Index (CCI) all valued in CA$.
In April 2014 the Canadian commodities index (CCI – blue line) continued to tick up above the April-May 2011 ceiling that was set up with the May 2011 oil spike. As they say, “on a breakout, resistance becomes support” but if this support does not hold then as with the prior peaks of May 2011 and July 2008, a “hard” correction could ensue.
Gold continues to base well below the three rising comparative indexes of energy, real estate and financials that have been revived on the weak CA$.
In the past 12 years, the CCI has rallied 8 times out of the fall and in 2013-14 the boost came from the Polar Vortex.

Catch the US Housing Update HERE

This MARKET BREAKS OUT X-factor Report also includes
- 3 Phases Of A Bull Market
- Sector Analysis (vital areas including interest rates)
- Measuring The Potential For Reversion
- S&P 500 Sectors
- Allocation Model
…also some SUGGESTED READING
- 5 Things To Ponder: Yogi-Isms
- CNBC Confused As To Why Interest Rates Are Falling
- Market Breaks Out – Is This The Mania Phase?
- Signs Of An Aging Bull Market
- 5 Things To Ponder: Hookers, Bubbles & Memorial Day
Over the last couple of months, I have been running a consistent analysis of the market consolidation that began in early February. During the last two weeks in particular, I began discussing two possibilities which included a market breakout or another market failure. This week, the market did the former by breaking out of the consolidation and continuing its current bull market cycle.

Two other things have also occurred in the past week coincident with the breakout. The “good news” is that an“initial buy” signal has finally been triggered after the “sell signal” was issued in early January.
We choose to remain allocated in our models due to the fact that despite the “sell signal” being in place the markets had technically done nothing wrong. However, even if you did observe the “sell signal” and raise cash it did little harm and certainly would have reduced the emotional “seesaw” that occurred thereafter.
This is an important point. The “buy” and “sell” indicators really aren’t so much designed to capture every percentage point advance in the market. Nor are they designed to keep you from losing money. The real value of the signals is to reduce portfolio volatility to a point to where you don’t make emotional mistakes. Acting emotionally rarely works out well in the markets, or in life. This is why I focus so heavily on price movement to dictate portfolio actions. I am a believer that we must invest for the long term; however, I also understand that not managing short-term risks can have detrimental consequences.
The chart below shows a longer term picture of the market. This is where the “bad news” is contained. If you look at the bottom part of the chart, you will see a short term MACD which acts as the initial “buy/sell” indicator. While it has turned positive, it has done so in a declining trend. I have drawn red lines over the previous periods where the same set up has occurred.

The declining trend of the indicator is a “divergence” from market price action. Such divergences are typically associated with near term market tops both large and small. But this isn’t the only such divergence that are concerning at the present time.
The next chart shows the “volume” of the market relative to the recent advance.

The decline in volume is very suggestive of a rally that is unlikely to be maintained in the short term. This analysis is also confirmed by another divergence in the “participation” of the overall market as shown by the number of stocks on “bullish buy signals.”

The same is true with the net number of stocks making new highs.

All of these signs are suggestive of a very tired market.
These divergences tied together with extremely high levels of bullish exuberance and complacency make for a perfect breeding ground for a rather nasty market correction. (These charts are extracted from “Signs Of An Aging Bull Market” if you want to see the rest.)
 ‘
‘

The point here is simple. The “breakout” of the markets this past week confirms the continuation of the recent bull trend. Therefore, our portfolio allocation model remains unchanged at current levels (fully allocated) for the time being.
However, the internal deterioration of the markets does suggest that “risk” of a correction is rising. This is particularly the case as the Federal Reserve continues to extract liquidity support from the markets. (The recent release of the Federal Reserves Permanent Open Market Operation schedule confirms only $25 billion in purchases in June with NO buys on Fridays.)
Lastly, the breakout of the markets above 1900 this past week, at a time when the Fed is extracting liquidity, is also something that we saw in 2011.

I am NOT suggesting that the current market cycle will exactly replicate the 2011 experience as there have been enough market period chart comparisons as of late. However, what I am suggesting is that a similar “set up” had a negative consequence and the current market cycle should not be taken for granted. Markets don’t repeat, but they do rhyme quite often.
Therefore, it is important that you remain keenly aware of the internal weightings of your portfolio and overall allocation model.
……read more beginning at Three Phases of a Bull Market HERE
….followed by;
…also some SUGGESTED READING
you buy a stock and it goes down does not mean you are wrong.” – Peter Lynch
We’re back! I’m pleased to report that the bull market keeps on charging. On Thursday, the S&P 500 closed at 1,920.03. That makes the 13th time this year the index has set an all-time record high. (Perhaps I should go on vacation more often.)
I’ve also been surprised by how tame this market has been. We haven’t had a 1% drop in seven weeks. The Volatility Index (VIX) recently dropped to a nine-month low, and it’s close to hitting a seven-year low.

One of the concerns I have with this market is the narrowness of it. In plainer terms, fewer and fewer stocks are doing the heavy lifting. With each successive peak in the S&P 500, the number of stocks hitting new highs decreases. That’s not a good sign.
That’s not all. This week, the government reported that for the first time in three years, the economy got smaller. For Q1, real GDP fell by 1%. Fortunately, that’s almost certainly a temporary blip. I’ll have more details in a bit. I’ll also look at the recent deal between AT&T and DirecTV, and later on, I’ll highlight some recent Buy List earnings, looking at what stocks look especially good right now. But first, let’s take a closer look at this amazingly resilient bull market.
Bull Markets Get Sloppy as They Get Older
One of the basic facts about bull markets is that they get sloppy as they get older. It’s always been that way, and I suspect it always will be. Consider that since the end of 2011, stocks with the worst balance sheets on Wall Street have done the best. In fact, they’ve done nearly twice as well as the S&P 500.
With Janet and friends inside the Fed keeping interest rates on the floor, it’s not such a burden having lousy finances. Companies that have issued junk debt in the past year have seen their stocks rise by an average of 26%. That compares with 15% for the rest of the market. There’s such a strong demand for higher-yielding debt that investors are willing to gobble up anything.
We’re still early in this game, but this is the type of behavior that leads to trouble. Fortunately for us, our Buy List stocks are fundamentally strong. The downside is that in a market like this, they can sit outside the rally. As always, patience is our best friend.
But what’s been even more impressive than the stock market rally has been the relentless rally in Treasury bonds. Bond guru Jeffrey Gundlach was one of the few people who said that bonds would rally this year, and he was bang-on right. On Thursday, the 10-year Treasury yield got down to 2.4%. That’s the lowest yield in close to a year.
Sheesh…anyone else remember when the end of QE was supposed to lead to a rotation out of bonds? That hasn’t happened, and it doesn’t look to start anytime soon.
So what’s going on with the bond market? Some people think bonds are reacting to bad economic numbers. That’s possible, but I’m a doubter. It’s true that Thursday’s GDP report was ugly. The Commerce Department said that for the first time in three years, the U.S. economy actually contracted. Real GDP fell at a 1% annualized rate during the first three months of this year.
Unpleasant, I know, but let’s remember that Q1 started five months ago and ended two months ago. In fact, it looks like the numbers for Q2 and Q3 will be pretty good. We’re also seeing a lot of strength in economically sensitive areas like transportation stocks. So the bond market has everyone perplexed.
Bill Dudley, the top dog at the New York Fed, gave an interesting speech last week which may explain what’s going on. The crucial point of Dudley’s speech came when he said he doesn’t expect real short-term interest rates to return to their historical level.
Let me explain. Here’s a very, very, very oversimplified explanation of what the Fed does. When the economy’s humming along, the Fed keeps real interest rates pinned at 2.5%. Anything above that is too tight. But when the economy’s in the dumps, the Fed lowers real rates to 0%. So the Fed’s job is to oscillate between 0% and 2.5%.
Please understand, this is a big generalization, but it works well for our purposes. Now Mr. Dudley said he thinks the 2.5% level no longer works. In fact, he expects real rates to stay “well below” that for a long time.
Dudley cites three reasons. First, he says, “economic headwinds seem likely to persist for several more years.” He may be right on that. Second, he notes the slowing growth of the labor force. Well, that’s certainly been the case. Third, he mentions changes in bank regulation and higher capital requirements.
Add these up, and we’re living in a low-rate world. If Dudley is right, and I’m not convinced he is, then it’s a major deal. It’s almost as if football suddenly changed from using 10 yards for a first down to only using seven, but no one told the players.
I can’t picture all the ramifications, but for certain, it’s a major change to the cost of capital. I would think lower “equilibrium” rates would depress dividend-payout ratios, since stocks wouldn’t have very strong competition from the short end of the bond market. It would also justify lower long-term rates, which is exactly what we’ve been seeing, so I’m not ready to dismiss Dudley just yet.
The AT&T Deal for DirecTV
In the last CWS Market Review I sent you, I said a deal between DirecTV (DTV) and AT&T (T) could come within two weeks. Well…my time horizon was way too long! The deal came a few hours later. It’s now official: AT&T and DirecTV are getting hitched. Here’s the Flash Alert I sent out on Sunday, May 18:
The merger deal calls for AT&T to buy DirecTV for $95 per share. The deal is a mix of cash and stock. The cash portion is $28.50 per share, and the stock portion is $66.50 worth of AT&T. They added a “collar” to the deal so no one is overly punished by a big swing in AT&T’s share price.
Here’s how it works: DTV shareholders will get 1.905 shares of AT&T if it’s below $34.90 when the deal closes. If AT&T is above $38.58 at closing, then they’ll get 1.724 shares of AT&T. If it’s between those two, they’ll get whatever ratio works out to $66.50 per share.
I expected shares of DTV to bounce up on the news, but it hasn’t happened. I think Wall Street suspects there are still some big obstacles to overcome. For one, there are regulatory concerns. AT&T will probably ditch some of their holdings to appease the government. That’s to be expected. They’ll need to convince the Federales that this is in the best interest of consumers.
There’s also the Sunday Ticket, which is DTV’s very lucrative deal with the NFL. In fact, AT&T is allowed to back out if DTV can’t extend their relationship with the NFL. For their part, AT&T said they expect an agreement to be reached, and I think they’re right about that.
I raised my buy below price on DTV to $95 per share. I expect this deal to close, but it will most likely take several months, perhaps more than one year. There’s no need for anyone to sell DTV, but you’re up side, at this point, is rather limited.
Medtronic Is a Buy up to $65 per Share
Now let’s look at two Buy List earnings reports we had last week. Last Tuesday, Medtronic(MDT) reported Q4 earnings of $1.12 per share. That matched expectations, although I expected a little more.
“In our fourth quarter, our overall organization once again delivered balanced growth, with strong performances in some areas more than offsetting challenges in other parts of our business,” said Omar Ishrak, Medtronic’s chairman and chief executive officer. “We remain focused on delivering consistent and dependable growth across all of our businesses through our three growth vectors: new therapies, emerging markets, and independent services and solutions.”
Some good news is that the company finally settled its dispute with Edwards Lifesciences(EW) over their CoreValve heart valve. Medtronic has agreed to pay EW $750 million plus royalty payments over the next eight years. As part of the settlement, both companies have agreed to stop suing the pants off each other. It’s time to move on.
Now for guidance. For this fiscal year, Medtronic sees earnings ranging between $4 and $4.10 per share. The Street had been expecting $4.09 per share. They expect revenue growth of 3% to 5% on a constant-currency basis.
The shares initially reacted poorly to the earnings news. But within a few days, the stock made back everything it had lost. It’s amazing what waiting a few days can do. Next month, I expect another dividend increase. I think Medtronic will raise their quarterly dividend from 28 cents to about 30 cents per share. Medtronic continues to be a very good buy up to $65 per share.
Ross Stores Reports Inline, Raises Guidance
A week ago Thursday, Ross Stores (ROST) reported Q1 earnings of $1.15 per share, which matched the Street’s estimates. These are decent results, and they could have been a lot worse. Many other retailers put up some bad numbers. Frankly, I had been expecting more, but I hold Ross to a high standard. For Ross, revenue was up 5.6% last quarter to $2.68 billion, which was just shy of consensus. Comparable-store sales, which is the key metric for retailers, were up 1% for the quarter.
For Q2, Ross sees earnings of $1.05 to $1.09 per share and comparable-store sales growth of 1% to 2%. The Street had been expecting $1.08 per share. Bear in mind that Ross had a range of $1.11 to $1.15 per share for Q1, so they tended to be modest with their expectations.
For the entire year, Ross projects earnings of $4.09 to $4.21 per share. That’s an increase of four cents per share to the low end. The consensus on the Street is for $4.21 per share.
CEO Michael Balmuth said, “First-quarter earnings per share performed at the high end of our guidance as strict inventory and expense controls offset the impact from unfavorable weather and a more challenging retail environment. Sales trends improved in April, with more seasonal spring weather that coincided with the later Easter shopping period. Operating margin for the quarter was better than forecasted, declining 25 basis points to 14.6%. A 35 basis-point increase in cost of goods sold was partially offset by a 10 basis-point improvement in selling, general and administrative costs.”
I’m keeping our Buy Below at $76 per share, which is fairly wide, but I think Ross is underpriced here. Ross Stores remains a solid buy.
Buy List Updates
I wanted to add a few comments about some of our other Buy List stocks. Shares of Stryker(SYK) got a nice lift this week after the company said it won’t be bidding for Smith & Nephew. That’s a smart move. I’m raising our Buy Below to $87 per share. I like Stryker a lot.
If you’re looking to start new positions, two of the best bargains on our Buy List are Bed, Bath & Beyond (BBBY) and AFLAC (AFL). My only caution is that it may take a while for the value to appear. AFLAC now yields 2.4%, and I expect to see a dividend increase later this year. BBBY is a buy up to $66 per share, and AFL is a buy up to $68 per share.
Express Scripts (ESRX) got clobbered after its last earnings report. But as we often see with our Buy List, high-quality stocks prove to be sturdy. Shares of ESRX have rallied every since. This week, I’m raising our Buy Below on Express Scripts to $74 per share.
CR Bard (BCR) is another stock that’s been looking strong lately. The last earnings report was decent, in my view, even though it had a delayed reaction on Wall Street. Look for another dividend increase soon. CR Bard has raised their dividend every year since 1972. I’m raising our Buy Below to $151 per share.
Moog (MOG-A) continues its surprising rally. The stock is up close to 20% in the last seven weeks. I don’t think a lot of folks saw that coming. I’m raising my Buy Below on Moog to $76 per share.
That’s all for now. Next week is a big week for economic reports. On Monday, the May ISM report comes out. Then on Tuesday, we’ll get a look at factory orders. On Wednesday, the Fed releases its Beige Book report. We’ll also see the latest reports on productivity, plus ADP releases its jobs report. Then on Friday comes the big May jobs report from the government. The last payroll report was a shocker (+288,000). It’s also very likely that the economy will finally surpass the payroll employment peak from 2008. Be sure to keep checking the blog for daily updates. I’ll have more market analysis for you in the next issue of CWS Market Review!
– Eddy
 |
Greg Weldon has produced, for the first time ever, a complete mid-year update to his 2014 forecasts exclusively for Michael Campbell’s listeners – available for only for 48 hours.
A remarkable 10 of the 14 recommendations have made money so far – find out which ones Greg expects to continue to make money, which have run their course, AND maybe most importantly, the big moves that are yet to come. Each brand-new report includes analysis, charts and recommendations.
And even more amazing, Michael has arranged for you to be able to get all 14 reports, which regularly sells for US$500, for only $29.99! That’s right, a 94% discount – but only until Sunday at midnight.
Not convinced this is for real? Click on the image below to read one of Greg’s reports – absolutely FREE. This trade has already made money and Greg projects there is still significant upside. All the reports includes analysis, specific price entry points PLUS different ways to trade each market including EFTs, futures and specific stocks.You won’t believe the quality of this work.
And if you want to read the other 13 right now – CLICK HERE to get immediate access.

CLICK HERE to get the other 13 trades right now.

-
I know Mike is a very solid investor and respect his opinions very much. So if he says pay attention to this or that - I will.
~ Dale G.
-
I've started managing my own investments so view Michael's site as a one-stop shop from which to get information and perspectives.
~ Dave E.
-
Michael offers easy reading, honest, common sense information that anyone can use in a practical manner.
~ der_al.
-
A sane voice in a scrambled investment world.
~ Ed R.
Inside Edge Pro Contributors

Greg Weldon

Josef Schachter

Tyler Bollhorn

Ryan Irvine

Paul Beattie

Martin Straith

Patrick Ceresna

Mark Leibovit

James Thorne

Victor Adair