
Stocks & Equities
For some perspective on the post-financial crisis rally, today’s chart illustrates how much of the downturn that occurred as a result of the financial crisis has been retraced by several major international stock market indices. For example, the S&P 500 peaked at 1,565.15 back in October 9, 2007 and troughed at 676.53 back on March 9, 2009. The most recent close for the S&P 500 is 1,950.79 — it has retraced 143.4% of its financial crisis bear market decline.
As today’s chart illustrates, China (Shanghai Composite), Japan (Nikkei 225), India (S&P BSE Sensex), Germany (DAX), France (CAC 40) and the UK (FTSE 100) are all above their financial crisis lows (i.e. above 0% on today’s chart) and three of the aforementioned countries (Germany, India and the UK) are currently trading above their respective pre-financial crisis peak (i.e. are above 100% on today’s chart).
It is interesting to note that the US (epicenter of the financial crisis) has outperformed the other major stock market indices (* keep in mind that the German DAX is unique in that it includes for the reinvestment of dividends) while China has lagged to the point where it only trades 7.9% above its financial crisis lows — not that impressive of a performance considering that the financial crisis occurred well over five years ago.

Notes:
Where’s the Dow headed? The answer may surprise you. Find out right now with the exclusive & Barron’s recommended charts of Chart of the Day Plus
Quote of the Day
“America has believed that in differentiation, not in uniformity, lies the path of progress. It acted on this belief; it has advanced human happiness, and it has prospered.” – Louis D. Brandeis
Events of the Day
June 14, 2014 – Flag Day
June 15, 2014 – Father’s Day
June 19, 2014 – US Women’s Open golf tournament begins (ends June 22nd)
June 21, 2014 – First Day of Summer (North America)
June 23, 2014 – Wimbledon tennis tournament begins (ends July 6th)
Stocks of the Day
— Find out which stocks investors are focused on with the most active stocks today.
— Which stocks are making big money? Find out with the biggest stock gainers today.
— What are the largest companies? Find out with the largest companies by market cap.
— Which stocks are the biggest dividend payers? Find out with the highest dividend paying stocks.
— You can also quickly review the performance, dividend yield and market capitalization for each of the Dow Jones Industrial Average Companies as well as for each of the S&P 500 Companies.
Mailing List Info
Chart of the Day is FREE to anyone who subscribes

After nearly six years of unprecedented intervention by the world’s top central banks, the world’s financial markets are hopelessly broken. What used to be accepted as market gospel and guided investors’ decisions in the marketplace, before the 2008 financial crisis, – no longer seems to apply in today’s marketplace. Wall Street is no longer the bastion of free and open markets, where the prices of bonds and stocks are determined by the collective judgment of millions of investors. Instead, market prices are determined by a handful of political appointees, called central bankers, who pull the levers and intervene from behind the scenes, in an effort to influence the direction of the markets.
Playing by the older and more traditional set of rules of investing (prior to 2008) has caused many astute investors to miss out on some of the biggest gains in Wall Street’s history. The “Least Loved” Bull market is now 63-months old, and it’s the fourth longest money minting rally in history. It’s still running on steroids, with the S&P-500 index having nearly tripled from its Great Recession nadir, and is now zeroing in on the once unthinkable 2,000-level. The Dow Jones Industrials are clawing their way higher, and are within spitting distance of the psychological 17,000-level. The faithful Buy-and-Hold – and dollar cost averaging investor, is enjoying the ride, having cast aside the frightful memories of six years ago.
Strangely though, even as the US-stock market indexes soar to new stratospheric heights, the trading volume in the most actively traded exchange traded fund – based on the S&P-500 index, (ticker symbol; SPY) has plunged by roughly -60% compared with a year ago. Investors are more content to let their Bullish bets ride rather than to add to their exposure to the market. Who is the biggest buyer in the marketplace today, with an unrelenting bid, that buys on all dips? The answer is: Corporate America. Amid such thin market conditions, the S&P-500 companies can buoy the market, with a few big blocks of buybacks. And further dispelling investors’ fear of heights, there’s the safety net of the secretive “Plunge Protection Team” (PPT) that rescues the index funds when risky bets go sour.
The aging Bull market on Wall Street is dubbed the “Least Loved” Bull, because it’s been accompanied by the weakest economic recovery from a recession since the 1930’s. Since the recovery officially began in June 2009, the US-economy has been crawling ahead at an anemic +2% growth rate, or less than half the vigor of the typical rebound from a recession since 1946. The rapidly expanding wealth on Wall Street, mostly flowing to the Richest-10% of US-households, hasn’t trickled down to the average household – take home pay of $839 a week in April ’14, was only +$20 higher than in January 2008, when adjusted for inflation.
What skeptics of the “Least Loved” Bull market have failed to realize over the past 5-years is that the Federal Reserve has turned the stock market upside down, making bad economic news a reason to buy stocks, and good economic news a reason to sell them. The distortion keeps the real value of assets obscure and stuck in the “Twilight Zone.” The answer to this bizarre market behavior is simple: the stock market is being ruled by the Fed, not by fundamentals. In simple terms, what matters to the stock market is the easy money from the Fed, not the performance of the companies whose stocks they are buying and selling.
Indeed, the Bank of International Settlements (BIS) warned a year ago, on June 6th, 2013, “the equity markets are under the spell of monetary easing policies that have enabled market participants to “tune out signs of a global growth slowdown.” Investors are able to shrug off weak economic data and instead, continue to bid stock prices higher, “amid the prospect of further central bank stimulus. Abundant liquidity and low volatility fostered an environment favoring risk-taking and carry trade activity,” the BIS observed.
As recently as May 20th, 2014, Philly Fed chief Charles Plosser lamented, “It’s the Fed’s fault that the markets are ignoring the fundamentals.” “Since the onset of the financial crisis, central banks have become highly interventionist in their effor ts to manipulate asset prices and financial markets in general, as they attempt to fine-tune economic outcomes. This approach has continued well past the end of the financial crisis. While the motivations may be noble, we have created an environment in which “it is all about the Fed.” Market participants focus on how the central bank may tweak its policy, and central bankers have become too desirous of managing prices in the financial world,” he said.
“I do not see this as a healthy symbiotic relationship for the long term. If financial market participants believe that their success depends primarily on the next decisions of monetary policymakers rather than on economic fundamentals, our capital markets will not deliver the economic benefits they are capable of providing (ie; accurate price discovery). And if central banks do not limit their interventionist strategies and focus on returning to more normal policymaking aimed at promoting price stability and long-term growth, then they will simply encourage the financial markets to ignore fundamentals and to focus instead on the next actions of the central bank,” Mr Plosser said.

It’s all about the Fed – During the tenure of the Bernanke Fed – the US-central bank shifted its focus from central banking to central planning, from smoothing the business cycle to micro-managing the markets and financial engineering. The trading desk that controls the formerly free capital markets is situated on the ninth floor of 33 Liberty Street, also known as the home New York Fed. From a glass-enclosed conference room situated next to a small cluster of trading desks the uber-secretive “Plunge Protection Team” (PPT) controls the money flows that determine the daily fate of credit, equity and virtually all other markets, that have now been hijacked by the central planners at the White House and the US Treasury. As the number of shares traded each day in stock market dwindles to a six year low, the PPT has become an even more influential price setter in the stock market. The PPT concentrates its firepower in the Dow Jones Industrials futures market, which in turn, can move the S&P-500 index several points, with trading volumes as pathetically low as they are today.
The biggest winners in the financial markets last year were traders that respected the old axiom, “Don’t Fight the Fed.” They rode the QE gravy train, and kept their bets focused on the increasing size of the Fed’s portfolio of bonds. Under the cloak of “Infinity QE” – the Fed injected $1.5-trillion into the coffers of its agents on Wall Street, which in turn, was funneled into the stock market, and inflated the market value of NYSE and Nasdaq listed stocks by $6.5-trillion to a record $25-trillion today. Since the Fed fist launched QE in Sept ’08, the central bank has increased its portfolio of bonds by $3.45-trillion, while the value of US-listed shares has increased $15-trillion. In other words, for every $1 of QE, the Fed increased the wealth of shareholders by $4.35. The Fed’s propaganda artists say the QE injections didn’t fuel market bubbles, because the monies were bottled up at the Fed itself, in special reserves accounts, which have captured most of the QE monies.
However, the chart above tells a different tale. It shows a +87% degree of correlation between the growing size of the Fed’s bond portfolio and the increasing value of the S&P-500 index. There has a been few periodic pullbacks in the S&P-500 index along the way to the 2,000-level, but they were all very brief, and only served as better buying opportunities for Bullish traders that kept their focus squarely on the size of the Fed’s portfolio. Last year, every bit of news that did not fit the Bullish narrative was downplayed and soon forgotten.
Even after racking up a stellar +28% gain for all of 2013, the biggest annual gain in 16-years, the “Least Loved” Bull market was easily able to shrug-off news of a -1% contraction in the US-economy in Q’1 of 2014. Proving for the umpteenth time that a weak economy does NOT translate into a weaker stock market, when all the smoke had cleared, the S&P-500 index ended the first quarter with a +1.2% gain, despite the lousy economy. The old adage, “Sell in May and Go Away,” was tossed into the trash heap and the “Least Loved” Bull continued to show its agility as it climbed to new stratospheric highs.

“Least Loved” Bull market running on 2 Cylinders, – Corporate America, – flush with $2-trillion of cash stashed away in their US-banking accounts, has decided there’s nothing more attractive than itself. So, the S&P-500 companies are spending big bucks to buy back their own shares. Last year, they plowed about 80% of their profits into the hands of shareholders, through buybacks and dividend payments. Over the past 3 ½ years, the number of shares of stock available to be bought or sold on the US-stock exchanges has dwindled by -10%. Shareholders like buybacks because they automatically increase earnings per share (EPS). And most often, though not always, a higher EPS leads to rising stock prices. It’s also made it more treacherous for short sellers to maintain bearish bets.
Some notable examples are; Northrup Grumman (ticker NOC), the military contractor expects to reduce its shares outstanding by -25% by the end of 2015, with buybacks. Last year, Home Depot (ticker HD), announced a $17-billion buyback program, that will remove -18% of the shares outstanding at current prices . On June 9th, Home Depot issued $2-billion in five and 30-year bonds, with the intention to use the monies to buyback shares. The demand for HD’s debt exceeded the supply by a ratio of more than 3-to-1. Shares of FedEx (FDX) the operator of the world’s largest cargo airline, – soared to above $140 /share, after it authorized a buyback plan equivalent to -10% of its shares outstanding.
The powerful impact of Corporate QE can be seen with the outsized performance of the Power-Shares Buyback Achievers fund (ticker; PKW) compared with the benchmark S&P-500 index. PKW buys shares of companies that have already purchased at least 5% of their shares outstanding over the past 12 months. The goal is to avoid companies whose buybacks go solely toward offsetting stock option grants and don’t shrink the share count. Since January 1st, 2009, PKW has increased in market value by +176%, compared to a gain of +113% for the S&P-500 index fund, ticker: SPY. Analysts estimate that 40% of the increase in the earnings per share of S&P-500 companies in the past 12-months was due to the “financial engineering” of corporate treasurers. In other words, corporate buybacks has scared the daylights out of short sellers – and is conceivably responsible for about one third of the stellar gains of the “Least Loved” Bull market.
Financial Engineering at Apple – Everyone knows Apple Inc (AAPL) employs many of the best high-tech engineers in the world. But who knew some were also on the financial-engineering side? In a deal that was greeted so eagerly by salivating investors hungry for a piece of Apple’s debt pie, the Cupertino, California – based iPhone maker issued $12 billion of bonds on April 29th, designed to reward shareholders with a leveraged buyback of shares. The world’s most valuable technology company has $151-billion in cash, but only $18-billion of that stash is readily available in the US – meaning Apple needed to issue additional debt to help fund its $130-billion shareholder capital return plan.
The resurgence of Apple’s stock has as much to do with financial engineering as the company’s technological wizardry. For years, AAPL has shifted billions in profits out of the US and into affiliates based in Ireland, where it negotiated a tax rate of less than 2%. Its offshore entities have paid little or no tax in recent years, on $40-billion of earnings generated outside the US. Luca Maestri, – Apple’s chief financial officer, explained on the latest earnings call, “To repatriate our foreign cash under current US-tax law, we would incur significant tax consequences and we don’t believe this would be in the best interest of our shareholders.”
The sharp rebound in AAPL’s share price to near its all-time high has a lot to do with the wizardry of Carl Icahn who has repeatedly argued that AAPL’s shares were undervalued, and Icahn did provide a blow-by-blow update on Twitter of every new investment he’s made in the company since June ’13, when he first disclosed his buying spree in AAPL.
On October 1st, 2013, Icahn said in a tweet that he had pushed Apple CEO Tim Cook for a $150 billion share buyback, ” Had a cordial dinner with Tim last night. Pushed hard for a $150-billion buyback. We decided to continue dialogue in about three weeks,” Icahn tweeted. In a CNBC interview, Icahn emphasized how strongly he felt about an increased buyback. “It’s a no-brainer and it makes no sense for this company with their multiple being so low not to do a major buyback. And there’s another reason that I mention, that I think might go forgotten, the fact that you can borrow money so cheaply today. I don’t think we are going to see this again,” Icahn said on CNBC’s “Halftime Report.”

“They have a golden opportunity to go borrow money. With Apple trading at about $482 per share, a repurchase of this kind would mean buying more than 300-million shares. Apple currently only has about 900 million shares outstanding, so a buyback of this size would be a reduction of more than one-third,” Mr Icahn explained. On April 23rd, 2014, Apple put Icahn’s advice into motion, it issued $12-billion of debt, boosted its dividend +8%, and said it would spend an additional $30-billion to buy back shares, taking to $130-billion the total amount it plans to spend on repurchases and dividends by the end of 2015.
Even before the ramped up buybacks, Apple had already reduced the amount of its floating shares by -8.5% to 860-million shares, and by shrinking the float, helped to catapult AAPL’s share price to $665 today, (pre-split basis) up from as low as $390 in April ’13.
AAPL’s most brilliant maneuver was voting to authorize a 7-for-1 stock split. Since the split was announced in late April, Apple’s stock has climbed +25%, creating more than $100-billion in shareholder wealth while the benchmark S&P-500 index edged up +4%. The lower price also clears the way for AAPL to be included among the 30 stocks in the Dow Jones Industrial average. Meanwhile, the mastermind of AAPL’s resurgence, – Carl Icahn, the “King of Wall Street” can celebrate since his hedge fund (IEP) is holding 7.5-million shares of AAPL.
Even as stock prices continue to spiral higher, the S&P-500 companies are trying to keep pace by raising their dividend payouts . 421 of the S&P blue-chips are expected to pay a combined $348-billion of dividends this year . That equals a dividend yield of 2.3%, or about 30-basis points less than the yield on the US Treasury’s 10-year note.

Dow Blue-Chips Unfazed by Shakeout in Small Caps, Nasdaq high flyers, – There hasn’t been a correction of -10% in the benchmark S&P-500 index for 34-months. Historically, a correction rocks the market about 18-months apart, on average. Yet there was a stealth correction within the US-stock market from the beginning of March through the middle of May that went undetected by the unsuspecting US-public. For instance, the small-cap Russell-2,000 index recently tumbled -10% from its all-time highs, skidding to the 1,100-level. Other segments of the high flying Nasdaq index, such as the social media, bio-tech, and internet retailers stocks were hit even harder, plunging -20% or more. Even Nasdaq kingpins such as Amazon, (AMZN) lost more than a quarter of its market value from its peak levels, and the heavyweight champion Google (GOOGL) stumbled -15% from its highs. As of May 17th, roughly one-third of all US-listed stocks were trading -20% or more below their 52-week highs, (a bear market), with the average Russell-2,000 member down -24%!
At its peak levels in early March, the Russell-2,000 index was priced at a whopping 103-times its 12-month Trailing earnings. Historically, its P/E has averaged 35-time earnings. If there is a bubble to be found anywhere in the marketplace, the most obvious place to look is the Russell-2,000 index, which is home to two thirds of all listed US-companies. It’s a homegrown collection of companies that earn about 85% of their revenue within the US’s borders, and is often seen as a proxy for the US-economy. The sudden -10% correction through the middle of May shaved the Russell-2,000 index’s trailing P/E ratio to 73-times.
Typically, when small-caps get in trouble, a sell-off in the big names is next. However, on May 7th, the new Fed chief Janet Yellen sought to prevent the large cap S&P-500 Oligarchs from suffering the same fate, by assuring Wall Street traders in testimony before Congress that “valuations for the broad stock market remain within historical norms. O verall, broad metrics don’t suggest we are in obviously bubble territory,” she said. And with those magical words, Yellen put a floor under the Dow Jones Industrials at the 16,350-level. As the Dow Industrials and Transports quickly regained their footing and climbed to new heights, the small-caps breathed a sigh of relief. The Russell-2,000 index built a base of support at the 1,100-level, and recovered most of its recent losses to close at the 1,165-level today. When the PPT does intervene in the stock index futures market, it concentrates its firepower in the Dow Industrials contract, where it can get the biggest bang for its buck.

Fear Gauge at 7-year Low, Euphoria sets in, – Nowadays, the higher the S&P-500 index climbs, the less investors seem to worry. Thanks to the hallucinogenic effects of the Fed’s QE-injections, corporate QE (buybacks), and Mergers & Acquisitions, risk is no longer priced into anything. Everyone has been brainwashed to interpret and spin all economic news as Bullish for the stock market. There is no need to hedge and no need to lighten up on positions carrying huge paper profits. It’s enough to just sit back and enjoy the fireworks. As such, the trading volume on the US-stock exchanges has shriveled up. For example, in the week ended June 6th, only 353-million shares traded in S&P-500 index fund (ticker; SPY) that’s -62% less than a year ago . In the previous week, only 279-shares traded.
When the S&P-500 index hit an all-time high on May 23rd, only 24 of its 500-members reached new 52-week highs. That’s the lowest participation in a year. Since 1990, there have been four other times when the SPX set a 52-week high with fewer than 10% of its members peaking and the overall volume trailing the average. In 3-of-4 occasions, the SPX fell at least -5% in the next two or three months. When volume and breadth are weak, and stock indexes surge, it’s often served as a warning sign that has preceded losses in the past.
However, what used to be true in the past is no longer relevant in the hallucinogenic world of QE, and the Zero Interest Rate Policy (ZIRP). The Fed has made sure that markets are a one-way bet, risks are eliminated, and by stimulating investors’ animal spirits – the omnipotent Fed can create a virtuous cycle that will support economic expansion.
The sharp drop in the number of shares changing hands is not necessarily a sign of danger, because a certain amount of money will buy fewer shares the higher the stock price goes. Most companies have chosen no to split their shares, despite the higher prices. As such, corporate buybacks would lose some of their potency, since treasurers can buy fewer shares as prices become more expensive, through their own rigging activities. But for now, most traders are reluctant to jump off the Fed’s QE-gravy train, and the safety net of buybacks.

Serene Sense of Tranquility among Buy-and-Hold Investors, On March 4th, Warren Buffett told CNBC that investors should not to pay much attention to short-term moves. “M ost investors are blinded by the markets’ gyrations and spend far too much time trying to form macro opinions or listen to market predictions, rather than investing simply and prudently for the long-term. Games are won by players who focus on the playing field, not by those whose eyes are glued to the scoreboard,” Buffet said. And there is no need for investing expertise. Buffett recommends a low-cost S&P-500 index fund for nonprofessionals. “Forming macro opinions or listening to the macro or market predictions of others is a waste of time,” he adds. His bottom line fundamental advice: “Ignore the chatter, keep your costs minimal, and invest in stocks as you would in a farm.” (In other words, just Buy-and-Hold, and relax).
After 5-years of monetary sedation, traders don’t see the need to buy ultra-cheap insurance against the possibility of a nasty market correction. The CBOE Volatility Index (VIX), also known as fear gauge, can be bought as a hedge against falling markets . Yet the VIX plunged to its lowest level in 7-years last week, reflecting the lack of fear of even the slightest pullback. Instead, investors on Wall Street are mesmerized by the Fed and are comfortable living in a calm and predictable universe, where there is no fear of turbulence. In the past, contrarians used to view such complacency as a major warning sign of a bubble top.
Outlook; The “Least Loved” Bull market is still running on steroids, even at 63-months old. The median lifetime of the Top-12 Bull markets is 55-months. So it’s lasted 8-months beyond its mid-life. A -10% correction hasn’t happened for the past 34-months, far beyond the average of 18-months between corrections. Yet it looks as though the S&P-500 index has entered the Euphoria stage, – the fourth and final phase of the Bull market. It wouldn’t be surprising to see the Madness of Crowds, – where frustrated investors jump off the sidelines to buy equities, alongside the indiscriminate buyers, (ie; corporate treasurers), in what’s called a “Melt-Up.” The Euphoria stage could see the S&P-500 index surge another +5% to +10% higher from today’s close of 1,950. Even as the Fed winds down its QE injection scheme by October, its comrades at the Bank of Japan and the European Central Bank will be running the printing presses in its absence, and keeping the liquor flowing for the late night partiers.
This article is just the Tip of the Iceberg of what’s available in the Global Money Trends newsletter. Subscribe to the Global Money Trends newsletter, for insightful analysis and future predictions about the (1) top stock markets around the world, (2) Commodities such as crude oil, Gold, copper and base metals, (3) Foreign currencies, such as the Australian and Canadian dollars, Brazil real, the Euro and Japanese yen, (4) Central bank interest rates and global bond markets, (5) Central bank Intervention techniques (6) and key Credit Default Swap markets.
GMT filters important news and information into (1) bullet-point, easy to understand reports, (2) featuring “Inter-Market Technical Analysis,” with lots of charts displaying the dynamic inter-relationships between foreign currencies, commodities, interest rates, and the stock markets from a dozen key countries around the world, (3) charts of key economic statistics of foreign countries that move markets.
Subscribers can also listen to bi-weekly Audio Broadcasts, posted Monday and Wednesday evenings, with the latest news and analysis on global markets. To order a subscription to Global Money Trends, click on the hyperlink below,
http://www.sirchartsalot.com/newsletters.php
or call toll free to order, Sunday thru Thursday, 8-am to 9-pm EST, and on Friday 8-am to 5-pm, at 888-808-7978. Outside the US call 561-391-8008.
DOW + 3 on 550 net declines
NASDAQ COMP +2 on 400 net declines
SHORT TERM TREND Bullish
INTERMEDIATE TERM TREND Bearish
STOCKS: We finally had a decline of sorts. The Dow was down almost 50 points, but the tendency to buy every two hour decline is still prevalent. This is the type of psychology that happens before more serious tops.
One of these days investors are going to buy a decline and it won’t rebound. I don’t think it’s going to be all that far off. Be sure to examine the chart.
GOLD: Gold was up $7.
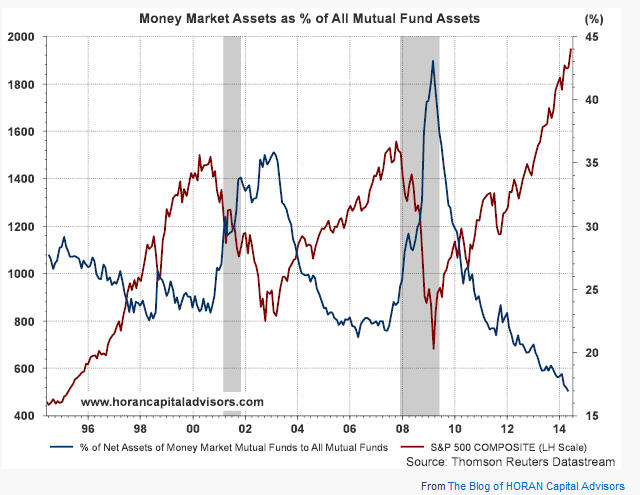
CHART: We keep hearing that there is a lot of cash on the sidelines and that this is one reason for the rally. Not if you look at money markets assets as a percentage of all mutual fund assets. This chart tells us that we are in danger of running out of money. Note how high it was when the market was at a bottom.
TORONTO EXCHANGE: Toronto was up 33.
S&P\TSX Venture Comp. The Venture Comp. was down 1.
BONDS: Bonds moved lower again.
THE REST: The dollar was higher as was silver, copper and crude oil.
BOTTOM LINE: Short Term Bullish – Intermediate Term Bearish
NEWS AND FUNDAMENTALS:
There were no important economic releases on Tuesday and there will be none on Wednesday.
Monetary conditions (+2 means the Fed is actively dropping rates; +1 means a bias toward easing. 0 means neutral, -1 means a bias toward tightening, -2 means actively raising rates). RSI (30 or below is oversold, 80 or above is overbought). McClellan Oscillator ( minus 100 is oversold. Plus 100 is overbought). Composite Gauge (5 or below is negative, 13 or above is positive). Composite Gauge five day m.a. (8.0 or below is overbought. 13.0 or above is oversold). CBOE Put Call Ratio ( .80 or below is a negative. 1.00 or above is a positive). Volatility Index, VIX (low teens bearish, high twenties bullish), VIX % single day change. + 5 or greater bullish. -5 or less, bearish. VIX % change 5 day m.a. +3.0 or above bullish, -3.0 or below, bearish. Advances minus declines three day m.a.( +500 is bearish. – 500 is bullish). Supply Demand 5 day m.a. (.45 or below is a positive. .80 or above is a negative).
No guarantees are made. Traders can and do lose money. The publisher may take positions in recommended securities.

Stocks blitzed to new highs again in the past few days, capping a remarkable three-week melt-up that’s been sparked by a growing sense that nothing can shake this market. Sentiment is quietly confident, rather than ebullient, as expectations are high among professionals that both GDP growth and earnings growth are set to rebound from anemic levels.
Yet the public is still not buying in, which means the advance is sustainable as more people are encouraged to come off the sidelines.The New York Times reported on Saturday on new research on investors in 16 countries by State Street’s Center for Applied Research that showed retail investors globally were holding an average of 40 percent of their assets in cash, up from 31 percent two years ago.
The lowest levels of cash holdings were in India, at 26 percent, and China, at 30 percent; the highest was 57 percent in Japan. The U.S. was in the middle at 36 percent, but that was an increase of 10 percentage points in just two years.

Despite the run-up in equity markets, the Times reported, people have resisted rushing into stocks and have instead added to cash. They have done this regardless of their age or amount of wealth. The study found that millennials who are under 33 and have the longest time to invest their money were increasing their cash positions at the same rate as baby boomers, who will need to draw on their investments soon.
Why is this happening? The Times asked Suzanne Duncan, global head of research at State Street’s Center for Applied Research, and she chalked it all up to fear; even though it has been more than five years since the S&P 500 hit its low. Amazing.
A low-volatility grind higher in prices such as we have seen in the past two weeks is just the climate that can make people comfortable again. In short, these cash hoarders can be persuaded to invest, and will help add fuel to the fire.
I have been saying for five years that the ultimate destination for the S&P 500 in the bull market that started in March 2009 is around 3,330, which is 53 percent higher than the current perch. This is not a wild guess; it’s 5x the benchmark index’s bear market low of 666, which has been typical for bull markets fueled by the intense capital infusion by central banks. It takes a long time for the medicine to work its magic.
Looking around, there’s plenty of optimism in the air. The IPO market is warming up, with the share of no-profit companies coming to market not seen since the dot-com mania. Look at Uber — the ride sharing/limo app, which just got a financing-round valuation of $18 billion. With a B.

Emotion is a powerful thing. So far, it’s overpowering a stretch of the calendar that is traditionally weak for stocks, as well as a lukewarm Q1 earnings season, and a disappointing -1 percent annualized contraction in the economy in the first three months of the year.
How long will it last? For the answer, keep an eye on Apple (AAPL). Much of the S&P 500′s vertical launch over the past three weeks has been due to the rise in AAPL on excitement over upcoming product announcements, share buybacks and today’s 7:1 stock split. AAPL has a huge influence on the S&P 500 (and the Nasdaq) because of its massive market capitalization.

One way to think about the situation is that as long as investors keep having an AAPL a day, they’ll keep the bears away. Another is to observe that Apple has a whole lot of catching-up to do to chase down the S&P 500, as shown in the chart above. You know I am not a fan of the company’s products or services, but it has probably been punished enough for several years of shameful product management.
Shares are cheap with a forward price/earnings multiple of 13.4x and price/sales of 3x while a comparable firm, Google (GOOGL), goes for 18x and 6x and Netflix goes for 6x and 5.5x. The Parallax Financial model, which is very conservative, has pegged the shares with an intrinsic value of $1,095. That would amount to a 68 percent move up from here.
Could a revitalized Apple be just the rocket fuel the S&P 500 needs to get to 3,300? I’m going to say yes, though with a list of caveats as long as the line outside an Apple store when a new phone goes on sale.
Best wishes,
Jon Markman
P.S. My recent picks are already posting huge gains — with my favorite stock doubling … tripling … and even quadrupling. Now I have 5 red-hot technology stocks for you to check out. Just click here for your FREE copy of my report, New Technology Superstars for 2014.
Stocks wasted no time pushing to new highs late last week… thanks to the bears.
Yes, The S&P 500 closed at a new all-time high on Friday. Stocks are up more than 5% on the year now. But a lot of traders are sold on the market’s strength right now…
“[Short sellers] are loading up again, sending bearish wagers in the SPDR exchange-traded fund tracking the Standard & Poor’s 500 Index (VIX) to almost 11 percent of its shares, the highest proportion since 2012,” Bloomberg reports.
No worries. You can make these bearish bets work in your favor. It’s worked before—and it could work again this year.
How?
After bearish bets peaked in 2011 and 2012, Bloomberg notes that the S&P rallied more than 14% in six months.

“One of the best things you could do in the stock market over the last three years has been to buy shares from short sellers,” Bloomberg declares, “who borrow stock with the aim of replacing it once the price falls.”
But it isn’t just the bears who hate stocks. The average investor isn’t down with this rally, either.
“According to a new study published in the Financial Analysts Journal, investors (that’s both individual investors an institutional investors) currently have the lowest percentage of their portfolios invested in stocks since they began collecting data in 1959,” reportsJonas Elmerraji from our trading desk. “Just 37.7% of portfolios are stock positions at last count.”
“How many years of blockbuster returns can investors sit out on before they start acting impulsively and we get a return to a buying frenzy market?” Jonas asks. “My guess is not many more. Even though stocks are hitting new high notes this month, we’re far from being in an irrationally exuberant market.”
Regards,
Greg Guenthner
for The Daily Reckoning
P.S. Jonas sees this fact as yet another reason to believe there’s a lot more upside room for stocks to run in 2014. What for additional short-covering to potentially push stocks even higher in the coming weeks. Sign up for the Rude Awakening for FREE today to see how you can trade these trends for huge gains…

-
I know Mike is a very solid investor and respect his opinions very much. So if he says pay attention to this or that - I will.
~ Dale G.
-
I've started managing my own investments so view Michael's site as a one-stop shop from which to get information and perspectives.
~ Dave E.
-
Michael offers easy reading, honest, common sense information that anyone can use in a practical manner.
~ der_al.
-
A sane voice in a scrambled investment world.
~ Ed R.
Inside Edge Pro Contributors

Greg Weldon

Josef Schachter

Tyler Bollhorn

Ryan Irvine

Paul Beattie

Martin Straith

Patrick Ceresna

Mark Leibovit

James Thorne

Victor Adair