
Stocks & Equities
 Mr. Market is a phony. He advertises himself as a mechanism for buying and selling securities.
He sells his wares as price discovery when it’s only sport speculation.
Mr. Market really is a great arena for self-discovery; or conversely, an opium den whose denizens are addicted to ticks — the almighty distraction for those self-medicating through the gleam on the screen… or the the glean on the scream.
They say markets hate uncertainty.
‘They’ are liars…. CLICK HERE for the complete article

BIG PICTURE – The world’s prominent central banks are pursuing an accommodative monetary policy and this bodes well for the stock market. Remember, when it comes to investing, monetary policy trumps everything else and the risk free rate of return determines the value of every asset. When interest rates are low and credit is cheap and plentiful, asset prices tend to inflate. Conversely, when interest rates are high and credit is tight, asset prices tend to deflate.
At present, the world’s largest economy is healing and its central bank is maintaining the Fed Funds Rate at a historic low. After several years of deleveraging, American households are borrowing again (Figure 1) and this is stimulating business activity. Although the US unemployment rate has fallen significantly over the past year, inflationary pressures are well contained and this implies that the Federal Reserve will not raise interest rates anytime soon.
If our assessment is correct, the US economy is currently in a sweet spot (just enough growth and lack of inflationary pressures) and if its housing market continues to appreciate, it will unleash tremendous pent-up demand. After all, American households have deleveraged for several years and by doing so, they have postponed the purchase of big ticket items. However, it appears as though they are now beginning to open up their wallets again and this shift in sentiment is benefiting the cyclical industries. For instance, it was recently reported that America’s auto sales have now jumped to levels not seen since 2003! In addition to buying new vehicles, Americans are refurbishing their homes, upgrading their properties, travelling more and spending more money on discretionary items.
Figure 1: US Households are borrowing again!

This shift in sentiment and perception is very bullish for business activity and over the following 2-3 years, it is probable that credit growth in the US will accelerate. If that happens, it will bring about an unprecedented economic boom which will not only benefit the US but the entire world economy.
Make no mistake, when Americans consume more, it will benefit many producing/exporting nations in the developing world and also help European exporters. So, the ongoing economic recovery in the US can only be positive for global growth.
Over in Europe, the situation is still unsatisfactory but even here; we believe that the continent has already passed the point of no return. If anything, we suspect that the European economic recovery is still in its infancy and additional monetary ‘stimulus’ from the European Central Bank (ECB) should bring about a shift in sentiment.
In any event, the ECB has already stated that it wants higher inflation in the Eurozone and it has recently started purchasing assets. Although anything can happen, we believe that if needed, the ECB will commence a full-scale QE program of buying sovereign bonds.
Over in Asia, the Bank of Japan (BOJ) is aggressively easing and the recent negative GDP-print will only bring about more ‘stimulus’. Although additional easing may not benefit the real economy, it will certainly devalue the Japanese Yen and boost the stock market.
If you review Figure 2, you will observe that over the past year, the Japanese currency has depreciated significantly against the US Dollar. At present, the Japanese Yen is trading beneath the key moving averages and it appears as though the path of least resistance remains down.
Figure 2: Japanese Yen – heading south?

Elsewhere in Asia, the Chinese authorities have recently cut interest rates; consequently, the Shanghai Composite Index has staged an impressive rally! Furthermore, it is rumoured that the People’s Bank of China (PBOC) may also unveil a cut in the banks’ minimum reserve requirements, so this may provide more fuel to the raging fire!
It is notable that unlike the other stock markets, Chinese equities have been in a relentless downtrend for 7 years, which is a very long time for any bear market. Moreover, due to the lengthy bear market, Chinese stocks are currently trading at depressed valuations; so the stage is now set for a powerful primary bull market.
Veteran investors may recall that before the bust in late 2007, the Shanghai Composite Index appreciated by approximately 600% in just over 2 years! So, given this history, it is conceivable that after a 7-year bear market, we may get an epic primary uptrend.
If you review Figure 3, you will note that after a huge consolidation phase, the Shanghai Composite Index has just broken out to a multi-year high. Although nothing is set in stone, these sorts of breakouts from lengthy base formations are usually followed by powerful moves and it appears as though the bear market low is now in the rear view mirror.
Bearing in mind the above, we have recently allocated some capital to China’s A-shares and it is our belief that this position will provide good returns over the following year.
Look. There can be no doubt that China’s housing market remains grossly overvalued and undoubtedly, mean reversion will occur at some point in the future. However, in the meantime, if the Chinese authorities embark on a massive easing program, then it is probable that the housing bubble will get even bigger! More importantly, monetary easing will surely have a positive impact on China’s stock market.
Figure 3: Shanghai Composite Index (daily chart)

Looking back at Wall Street, it is noteworthy that the major indices have climbed to all-time highs and this is good news for global equities. Remember, Wall Street is the most influential stock market in the entire world and its primary trend sets the tone for the other regions.
In terms of technical data, we are pleased to report that all the major data points that we monitor are aligned in a bullish manner and even the NYSE Advance/Decline Line has recently climbed to a new high; implying that the stock market breadth remains strong. Historically, the NYSE Advance/Decline Line has always peaked several months before the end of the bull market so this recent strength bodes well for the primary uptrend in common stocks.
As far as the favourable sectors are concerned, it is interesting to note that the cyclical sectors are performing well and doing better than the broad market. For instance, airlines, asset managers, auto dealers and parts manufacturers, credit cards, home builders, home improvement retailers, industrials, railways, restaurants, retailers and travel related counters are showing impressive strength! Elsewhere, biotechnology, consumer staples and healthcare stocks are also showing strength and we recommend exposure to these industry groups.
Conversely, energy, materials and precious metals stocks are underperforming the broad market by a wide margin and until the trend reverses, they should be avoided.
In the context of the broad stock market, you will recall that we had recently highlighted the weakness in the small-cap counters and the growth stocks. Despite the fact that the major indices were climbing to new highs, the growth stocks were not confirming the bull-run and this was an area of concern.
If you review Figure 4, you will note that the Russell 2000 Growth Index had fallen sharply during autumn and it had briefly dipped below its spring low. Fortunately, this index has staged an impressive rebound and it is now sitting comfortably above the key moving averages; thereby opening up the possibility of additional gains.
If the ongoing primary uptrend is strong and sustainable, then over the following weeks, the Russell 2000 Growth Index must appreciate further and take out its spring high. If that happens, new life will be injected into the stock market and the last bearish divergence will also disappear. So, this is one area we will continue to monitor closely.
Figure 4: Russell 2000 Growth Index (daily chart)

Bearing in mind the above, we have allocated our equity portfolio to some of the leading stocks in the strong sectors and this strategy is well positioned to profit from the primary uptrend.
Looking at geographical exposure, we continue to overweight and recommend the developed world (Europe, Japan and the US); although we also see potential in China’s and India’s stock markets. Accordingly, we have invested our fund portfolio in our preferred investment themes (geographical areas and sectors).
PRECIOUS METALS – Whether you like it or not, precious metals are in a multi-year bear market and the path of least resistance remains down.
You will recall that the prices of both gold and silver peaked in 2011 and over the past 3½ years, they have drifted lower. For sure, the southbound journey has been punctuated by consolidations and the periodic relief rallies, but the primary trend has been down.
From a fundamental perspective, the macro-economic environment (recovery in the West and low inflation) is no longer conducive towards the metals and the strengthening US Dollar is an additional problem for the gold bugs. Similar to commodities, precious metals are also denominated in US Dollars and they are inversely correlated to the price fluctuations in the greenback. So, if the US Dollar continues to appreciate over the following months, then it is conceivable that the prices of precious metals will weaken further.
If you review Figure 5, you will note that during autumn, the price of gold sliced through last summer’s low and by doing so, it reasserted its primary downtrend. Recently, the price of gold has firmed a bit but we suspect this is a counter-trend rally which will soon fizzle out.
Figure 5: Gold (weekly chart)

Turning to silver, it is noteworthy that its price has also sliced through last summer’s low and it is still trading beneath that level. Although the price of silver has already fallen significantly from the bull market top of US$50 per ounce, we suspect that the white metal will eventually trade below US$10 per ounce. After all, silver is merely a high-beta play on gold and the ongoing bear market in the yellow metal should weigh heavily on this volatile beast.
If our assessment proves to be correct, then the mining industry will have to endure a chilling, deflationary winter which will bring about the bankruptcy of many junior outfits. Already, the Gold Bugs Index has fallen to a 6-year low and additional strength in the US Dollar will probably bring about another smash.
Bearing in mind the above prognosis, we currently have no exposure to the physical metals or the related mining stocks. The trend in the precious metals remains down and our readers are advised to stay out of harm’s way.
About the Author: Puru Saxena
An investment adviser based in Hong Kong, he is a regular guest on CNBC, BBC, Bloomberg, NDTV Profit and writes for several newspapers and financial journals.

*Update: While this analyst remained short this morning after initiating a successful short position on the S&P 500 from 2,038 (November 12th). You can see that after the index traded in the low 1960’s tuesday/wednesday showing substantial profits, and the analyst reduced his stop from 2085 to 2025 which allowed the position to have been stopped out with a profit today. – Editor Money Talks
Briefly: In our opinion, speculative short positions are favored (with stop-loss at 2,025 and profit target at 1,950, S&P 500 index).
Our intraday outlook remains bearish, and our short-term outlook is bearish:
Intraday (next 24 hours) outlook: bearish
Short-term (next 1-2 weeks) outlook: bearish
Medium-term (next 1-3 months) outlook: neutral
Long-term outlook (next year): bullish
The U.S. stock market indexes gained between 1.7% and 2.0% on Wednesday, retracing some of their recent move down, as investors reacted to FOMC Rate Decision release, among others. The S&P 500 index bounced off support level at around 1,970-1,975, marked by Tuesday’s daily low. It has returned above the level of 2,000, which is positive. The nearest important level of resistance is at around 2,025-2,035, marked by some previous local lows, as we can see on the daily chart:

Expectations before the opening of today’s trading session are positive, with index futures currently up 1.1-1.3%.
The main European stock market indexes have gained 1.0-2.5% so far. Investors will now wait for some economic data announcements: Initial Claims at 8:30 a.m., Philadelphia Fed number, Leading Indicators at 10:00 a.m. The S&P 500 futures contract (CFD) is in an intraday uptrend, as it trades considerably higher this morning. The nearest important level of support remains at around 2,000-2,010. On the other hand, possible resistance level is at around 2,050, marked by some previous local extremes, as the 15-minute chart shows:

The technology Nasdaq 100 futures contract (CFD) follows a similar path, as it remains in an intraday uptrend. The nearest important support level is at 4,180-4,200. For now, it looks like a correction within a short-term downtrend, however a positive downtrend reversal scenario cannot be excluded here:

Concluding, the broad stock market bounced off support level, as the S&P 500 index continued to fluctuate along the level of 2,000 yesterday. Expectations before the opening of today’s trading session are very positive, however, we still continue to maintain our short position with entry point at 2,038 (November 12th opening price of the S&P 500 index). Stop-loss is at 2,025 and potential profit target remains at 1,950 (S&P 500 index). It is always important to set some exit price level in case some events cause the price to move in the unlikely direction. Having safety measures in place helps limit potential losses while letting the gains grow.
Thank you.
The Chart of the Day from two weeks ago illustrated which sectors have performed best since the June 2014 peak in crude oil prices. Today’s chart presents the long-term trend of the best performing sector on the aforementioned chart — the biotechnology sector (i.e. iShares Nasdaq Biotechnology — IBB). As today’s chart illustrates, biotech stocks began to rally in early 2009 as the financial crisis induced bear market concluded. Then in August 2011 the rally in biotech stocks picked up and has traded within the confines of a relatively steep upward sloping trend channel ever since. In fact, IBB is up over 240% since its 2011 lows — quite a healthy return for a 40 month timeframe.

Quote of the Day
“There is a tendency for things to right themselves.” – Ralph Waldo Emerson
Events of the Day
December 21, 2014 – First day of Winter (Northern Hemisphere)
December 25, 2014 – Christmas Day
December 26, 2014 – Kwanzaa (1st day)
Stocks of the Day
— Find out which stocks investors are focused on with the most active stocks today.
— Which stocks are making big money? Find out with the biggest stock gainers today.
— What are the largest companies? Find out with the largest companies by market cap.
— Which stocks are the biggest dividend payers? Find out with the highest dividend paying stocks.
— You can also quickly review the performance, dividend yield and market capitalization for each of the Dow Jones Industrial Average Companies as well as the performance of the Dogs of the Dow.
Mailing List Info
Chart of the Day is FREE to anyone who subscribes. Just go HERE
Notes:
Where should you invest? The answer may surprise you. Find out right now with the exclusive & Barron’s recommended charts of Chart of the Day Plus.
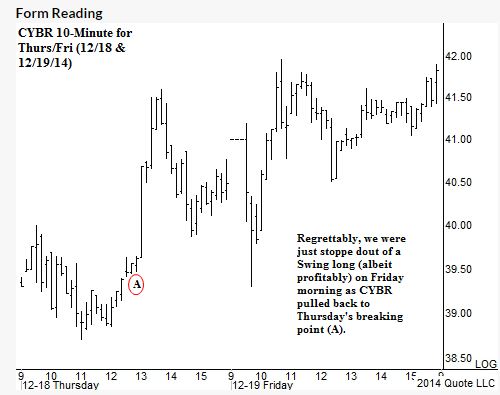
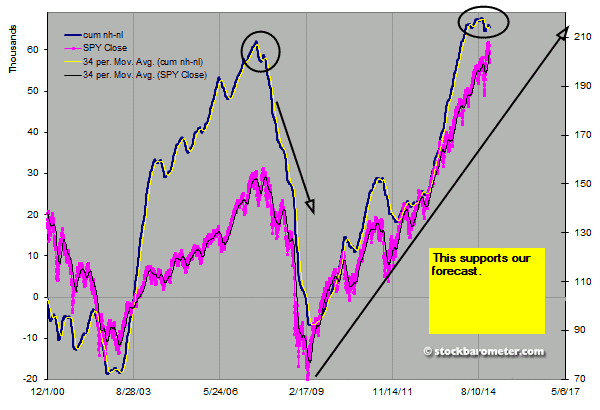
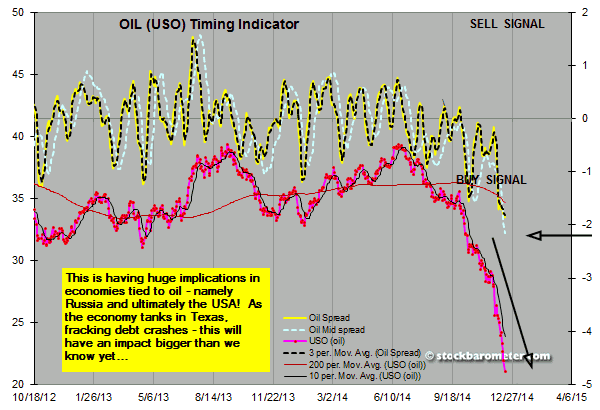
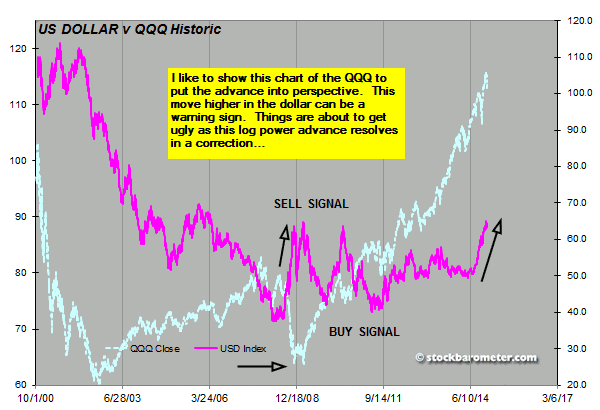
As the oil drop plays out in global economies – Russia’s push to 17% interest rates is an ominous sign worldwide. Let’s start with our forecast:
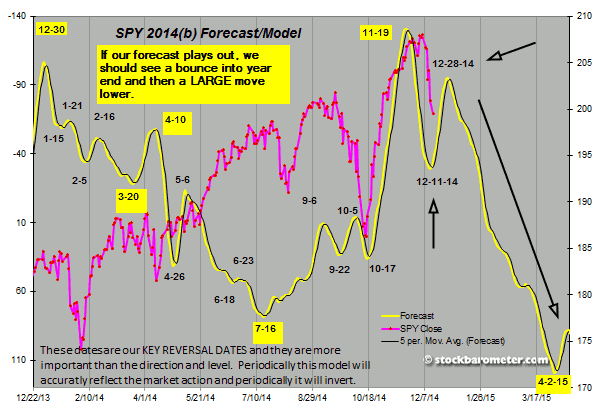
To support the potential of a large move lower:
It’s all about this move in oil:
In the short term:
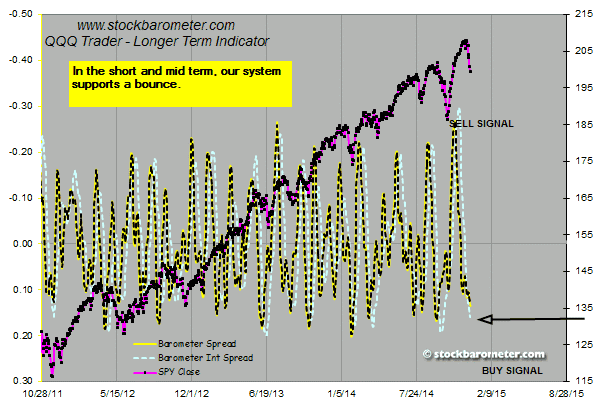
Unless the crash initiates now, which is less likely but not impossible, I expect a bounce into year end. The mid term line above will bounce to just below the zero level where a larger move lower will begin.
The move from the 2009 lows has been historic and while it can go higher, it’s culminating in a sell off at some point. Even 20% would be a significant move. So while we can play short term bounces, I would be very cautious entering 2015.
The Fed meeting and options expiration are playing into where the market is right now. I would expect the bounce to initiate in the next couple of days. During the bounce, I expect to see more evidence of distribution setting up the next move lower.
You can’t control markets, you have to let them play out. And all markets are related – so I expect this move to filter through other markets eventually…
Regards,

-
I know Mike is a very solid investor and respect his opinions very much. So if he says pay attention to this or that - I will.
~ Dale G.
-
I've started managing my own investments so view Michael's site as a one-stop shop from which to get information and perspectives.
~ Dave E.
-
Michael offers easy reading, honest, common sense information that anyone can use in a practical manner.
~ der_al.
-
A sane voice in a scrambled investment world.
~ Ed R.
Inside Edge Pro Contributors

Greg Weldon

Josef Schachter

Tyler Bollhorn

Ryan Irvine

Paul Beattie

Martin Straith

Patrick Ceresna

Mark Leibovit

James Thorne

Victor Adair