
Real Estate
(1) Northern Property Real Estate Investment Trust (TSE:NPR.UN.CA) — 5.5% YIELD
Northern Property Real Estate Investment Trust is an unincorporated open-ended real estate investment trust that manages and owns a portfolio of residential and commercial income producing properties. NorSerCo’s operates execusuite hotel properties and real estate-related services. The Trust’s residential properties are comprised of three components: apartments, townhomes and single family rental units; execusuite apartment rental units; and seniors’ properties. The Trust’s commercial properties are comprised of office, industrial and retail properties in areas where it has residential operations. As of Dec 31 2010, Co. owned 8,419 residential units and 903,352 sq. ft. of commercial space.

![]()

 1. Job Growth – we look for trends in job creation, type of employment, and unemployment trends
2. Population Growth – we look for trends in growth, demographics, and forecasts that mitigate growth
3. Economic Growth – we look at what is driving the economy, is it diversified and economic trends
4. Healthy Real Estate Fundamentals – are we too late or early? Is the market stable with positive growth trends? Is the market affordable?
5. Business Friendly Government – understanding municipal and provincial / state attitudes towards development (taxation, levies, growth plans)
What Real Estate Markets do we like and what particular sectors in that market?
Canada
Calgary – arguably not only the best market in Canada but in the world to invest. According to the June 2013 IPD Global Cities Report puts Calgary as the leader in overall performance as to real estate returns in the world for the last 2 years.
What we like: concrete tower apartment buildings, inner city development in residential, retail and commercial.
Edmonton – Alberta continues to add over 100,000 new people a year driven by the energy sector and Edmonton as the capital and the “blue collar” side of the energy will continue to grow.
What we like: apartment buildings, medical, light industrial, and raw land development.
United States
Texas – Texas leads the nation in job growth, low unemployment, affordable, projected to double in size by 2040 (over 50 million people), low taxes, pro-business government, energy, etc.
What we like: we love the Texas Triangle (Houston, San Antonio, Dallas). We like raw land for residential and retail.
Arizona – real estate trends around the Greater Phoenix area show growth trends of 30% over the next 3 years that are still well below the peak of 2008. Phoenix is in the Top 10 of fastest growing cities in the US, Top 5 in Job Growth, and #1 in real estate recovery.
What we like: we like apartment buildings in and around the Phoenix area
Craig Burows is the President of TriView Capital, an Exempt Market Dealer specializing in private equity offerings
Interest Rate Spread Between BoC Bank Rate Less the Posted
5yr Fixed Mortgage and CPI, Real Bank Rate & TSX RE Index
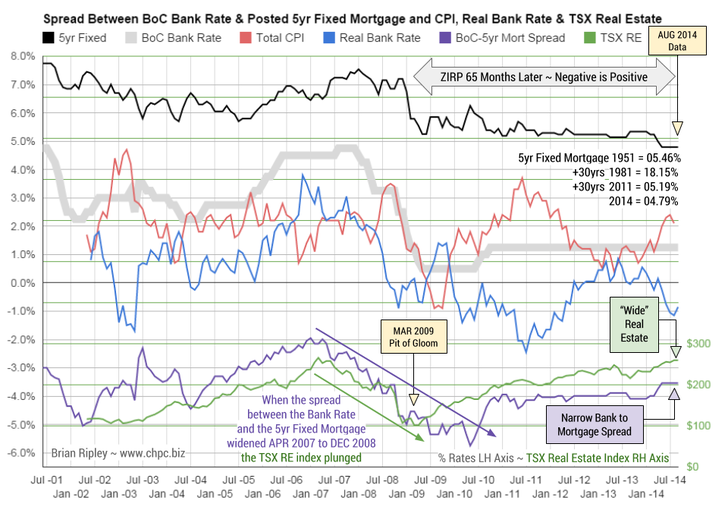
The chart above shows that in Augusst 2014 the spread between the Canadian Bank Rate (1.25%) and the posted residential 5 year fixed mortgage (4.79%) remained at its narrowest (3.54%) since the Aug-Sept 2008 spread of 3.6% which did not augur well that fateful autumn.
The continuing zoom in CPI (now 2.1%) is pushing the real Bank Rate deeper into a negative return. The trend is egging on the search for yield while promoting excessive margin debt as preferred lenders tout their lowest rates sweeping risk perceptions under the rug and governors finger wag the consumer class to spend more without increasing leverage.
The top 10% of earners need little incentive to chase capital gains, and the big national Canadian banks don’t need much in the way of a vigorish on high ratio tax payer insured loans; they can unload the narrow spread “conventional” paper to the securitized derivative markets, (CMBs, REITs) to avoid the risk of holding to term when comparative rates could be higher; or the collateral value lower.
A mortgage interest rate “sale” gets new customers and their deposits, accounts, investments and insurance business AND 80%+ customer retention into the subsequent term renewals on a slam dunk bet that rates will be higher off of current fire sale lows (my branch advertises sub 3% for a 5 year fixed). If there was a 30 year cycle of mortgage rates, it’s broken now with the current leg extending into 33 years.
When the spread between the BoC Bank Rate and the 5 year retail mortgage rate widened from April 2007 to Dec 2008, the TSX Real Estate Index rolled over and plunged into the March 2009 pit of gloom.
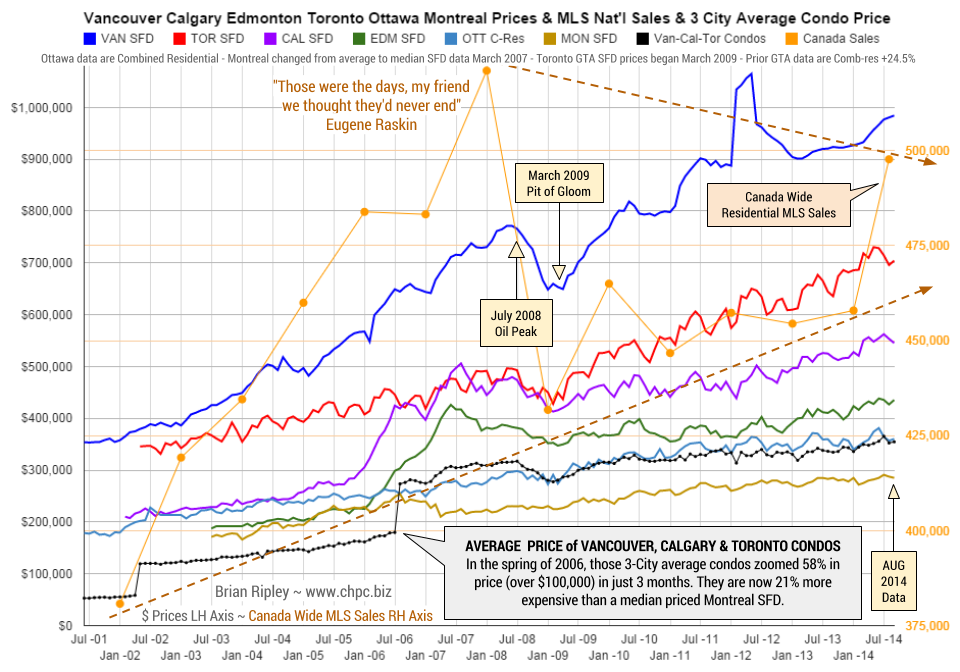
My case study of what a Vancouver investor is facing when contemplating the purchase of an average condo for the purpose of rental revenue demonstrates that although interest rates may be low, the capital cost according to my case study is 25% too high. If borrowing costs rise even fractionally the incentive to hold is irrational.
“Real Interest Rates” (BoC Bank Rate & 30yr Bond Rate less
CPI) and TSX Real Estate Index
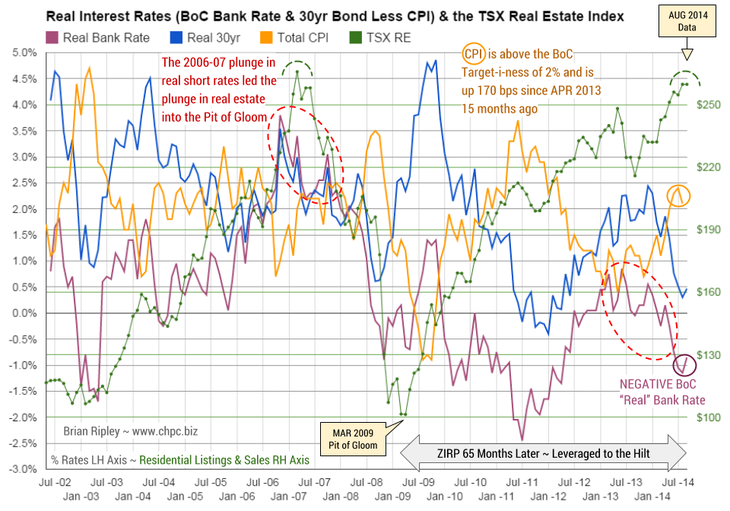
Real Rates of return fall with the rise in CPI or the drop in nominal yields.
The chart above shows that in August 2014 real interest rates as defined by the nominal rate less CPI took a rest from plunging with the CPI ticking back down to 2.1%. It was 2.5% in Jan-2012 and 2.3% in April 2012 which was the peak in averageVancouver SFD prices.
The CPI inflation stoked by a weak CAD/USD is increasing the cost of stuff we import which is showing up in the CAD Canadian Commodities Index that is recently returning back down to trend. The cost of stuff is still dampening real investment returns by increasing the holding cost of the asset. But cash buyers of the TSX real estate index have only been targeting the 2007 peak and the current spike is hitting a late season ceiling.
The Real Prices Chart shows the “real” price of real estate (Vancouver, Calgary, Toronto average SFD prices) held in check below the 2012 highs despite the aggressive bidding up of nominal prices and the fire sale peddling of credit.
CPI is now 170 beeps off the April 2013 low and at 2.1% qualifies as over reaching the Bank of Canada’s target-i-ness.
The renewed erosion of yield may produce a hike in the Bank of Canada rate and mortgage rates sooner rather than later although BoC head Mr Poloz says there is no rush to raise the Bank Rate; he sees “…too many economic risks, including low inflation, sputtering exports, a shaky housing market and a raft of global uncertainties from Ukraine to China” (Globe & Mail April 16, 2014).
Ah shucks, maybe he is just talking global central bankerese about employing negative interest rates to combat hoarding (CBC News June 5, 2014).
The Canadian Real Estate
PLUNGE-O-METER
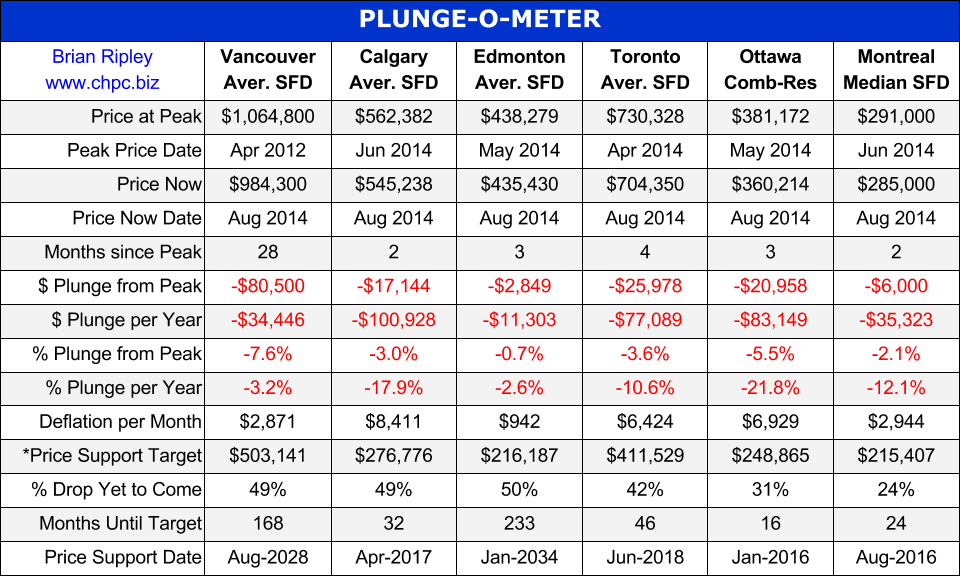
Plunge-O-Nomics
- ’07-’08 Average Vancouver SFD lost $122,900, or 15.9% in 8 months (2%/mo drop)
- ’07-’08 Average Calgary SFD lost $92,499, or 18.3% in 18 months (1%/mo drop)
- ’07-’08 Average Edmonton SFD lost $78,719, or 18.5% in 21 months (0.9%/mo drop)
- ’07-’08 Average Toronto SFD lost $63,867, or 13% in 13 months (1%/mo drop)
- ’07-’08 Average Ottawa Residence lost $25,664, or 8.6% in 6 months (1.4%/mo drop)
- ’07-’08 Median Montreal SFD lost $6,000, down 2.6% in 6 months (0.4%/mo drop)
Another Observation: oil spikes and real estate (TSX Chart)
- 2008 Vancouver down 16% in 8 mos
- 2008 Calgary down 14% in 8 mos
- 2008 Toronto down 14% in 9 mos
- 2008 TSX RE down 51% in 10 mos
- 2011 Vancouver down 2% in 6 mos
- 2011 Calgary down 10% in 8 mos
- 2011 Toronto down 7% in 3 mos
- 2011 TSX RE down 6% in 4 mos
The Tech Bubble Blowout…
Real estate has boomed and plunged in select markets with awesome volatility since the early 2000’s atop a huge edifice of debt that is only being propped up by the willingness of fewer and fewer buyers who think that prices will never collapse despite recent history being full of examples of the opposite (California, Florida, Detroit, Japan, Dubai, Greece, Ireland, Spain, etal).
Rising prices allow both the private and public sectors to over-leverage and with it comes speculative fervor that leads to prices rising further. But when prices decline then market sentiment changes and real estate becomes a slow moving asset class as debt revulsion sets in and fundamental illiquidity leads to asset re-pricing. At that point there is only one viable solution and that is for debt to be transformed into equity, and that occurs either by the debt being repaid slowly, or written off quickly.
In the sell-off phase, governments (who do not issue their own non-convertible currency eg: Greece, Spain and Italy, ie: members of the Eurozone) and corporations and individuals who defer repayment with more leverage (bailouts, bond issuance, secondary financing) are simply delaying the date of foreclosure, increasing the amount of potential asset destruction or lengthening the time and amount of repayment with valuable income streams that could have been used for productive investment (Canadians are producing more weapony and less infrastructure). Increasing debt leverage only works when prices are rising.
With respect to housing, there are much better mortgage models to follow than CMHC’s tax payer “insurance”. See the Danish Mortgage Finance Model where the combined loss ratio for all Danish mortgage credit institutions (MCIs) has never exceeded 1% in any one year – a number most other countries can only dream of.
A change in taxation policy is also needed. The way that government collects tax is highly inequitable. For an elegant solution see the APT (Automatic Payment Transaction) which would eliminate the tax complex. Gone would be personal, corporate, property, estate, capital gain, income, sales, excise and all manner of taxes or levies disguised as fees as well as the elimination of tax returns, deductions and special interest exemptions.
Implementation of this simple idea in Canada would allow Canadians to create an original, authentic social organization that would eventually be copied by all other nations. Let’s apply the power of the internet to build better housing, financing and taxation institutions. Canadians, write your Member of Parliament.

‘Canadians are buying everywhere’
Investors are putting money into real estate companies outside the U.S. at a record pace as interest rates recede, economies expand and opportunities remain to buy assets at discounts amid lingering distress from the global financial crisis.
The SPDR Dow Jones International Real Estate Exchange– Traded Fund, the largest ETF for non-U.S. real estate, attracted net inflows of $304-million in August, the most of any property ETF, driving its shares outstanding – a proxy for demand – to a record, according to data compiled by Bloomberg. Last month’s surge catapulted property ahead of energy for the first time in industry fund flows year to date, the data show. ETFs are passively managed funds that aim to replicate the performance of benchmark indexes for various industry groups.
Real estate has emerged as the asset of choice following the global financial meltdown because of its relatively high yields. While the U.S. has claimed a large share of interest for its perceived stability and enduring appeal of gateway markets such as New York and Los Angeles, investors also have increased purchases in Europe, Asia-Pacific and Latin America.
“Many investors that have moved to have real estate allocations in the U.S. are now looking to do so internationally,” said David Mazza, head of ETF investment strategy at State Street Global Advisors. “Investors are looking ahead to greater cyclical recovery and taking advantage of some pockets of distress” outside the U.S.

Japan, U.K.
Japan has the largest weighting in the SPDR Dow Jones International Real Estate ETF, at 21 per cent, followed by the U.K. at 14.1 per cent, Australia at 13.6 per cent, Hong Kong at 10.5 per cent, Canada at 10 per cent, France at 9.2 per cent and Singapore at 7.7 per cent. The Netherlands, Switzerland and South Africa round out the top 10.
A Bloomberg index of U.S. real estate investment trusts fell 2.3 per cent in the fourth quarter amid concern the prolonged period of suppressed interest rates would cease, then rallied 21 per cent this year as the yield on the 10-year Treasury note fell to 2.3 per cent from 3 per cent at the end of 2013. That meant borrowing costs would stay low for the time being.
Whether it’s private-equity firms and foreign pensions flush with cash chasing commercial and housing distress in Europe and Australia and economic growth in South America, or Russian billionaires and wealthy Chinese buying homes in London, Canada and the U.S., cross-border real estate flows are increasing.
GIC, Manulife Singapore’s GIC Pte Ltd., barred from investing in Singapore itself, bought a half stake in London’s Broadgate office complex last year for more than 1.7 billion pounds ($2.8-billion), a record for a central London property.
In June, Citigroup Inc. paid a record HK$5.4-billion ($697-million) for a Hong Kong office tower that will bring most of its 5,000 employees under one roof. Canada’s Manulife Financial Corp. last year paid HK$4.5-billion for a similar-size tower and development in the city’s Kowloon district.
“Canadians are buying everywhere,” said Ross Moore, director of Canada research at CBRE Group Inc., the biggest commercial broker. “They are shopping the world. What’s happened in the last five to 10 years is the big pension funds pretty well own everything of quality in Canada. They love real estate and have all this money coming in and they have to put it somewhere.”
Toronto-based Brookfield Asset Management Inc. has started investing in European warehouse properties and Indian offices after accumulating the biggest holdings of office buildings in both the U.S. and Canada. The real estate unit of Ontario Teachers’ Pension Plan has been investing in Brazil as well as the U.K. and Australia. Canadian Pension Plan Investment Board has bought London residential, retail and office properties.
Easy targets
Markets such as the U.K. and Australia are easy targets for North American investors, Moore said.
“The ownership structures are familiar, the legal structures are very similar, they understand what they’re getting into and the transparency is good,” he said.
In Japan, where interest rates are near zero thanks to central bank stimulus, investors can borrow cheaply to buy buildings whose rents translate into an investment yield that’s three or more percentage points higher, said Sonny Kalsi, co– founder of GreenOak Real Estate, who previously led Morgan Stanley’s real estate investment unit.
Investment yields on properties are measured in terms of capitalization rate, a building’s net operating income divided by purchase price. A property valued at $100-million with income of $5-million a year would translate to a cap rate of 5 per cent.
Liquidity, stability
“Liquidity, stability and the view that rents have a lot of upside” are driving real estate investment in Japan, said Kalsi. “You can buy for a 4 to 6 per cent cap rate, and borrow at 1 to 2 per cent so there’s significant positive spread with real potential upside.”
By company, the international property ETF’s biggest holdings are Mitsui Fudosan Co., Japan’s second-largest developer; Brookfield Asset Management; Paris-based Unibail– Rodamco SE, the biggest developer in Europe; Scentre Group, the Westfield Group spinoff that owns shopping malls in Australia and New Zealand; and Land Securities Group Plc, the largest developer in the U.K.
ETF Gains
The SPDR International Real Estate ETF had a record 117.8 million shares outstanding as of Aug. 29 – a proxy for fund flows since more shares are created to meet demand – up from 400,000 shares when the fund was formed in December 2006. The ETF has gained 10.3 per cent year to date with dividends reinvested, compared with 9.8 per cent for the Standard & Poor’s 500 Index, the U.S. equity benchmark gauge.
Also paving the way for more real estate deals are the early stages of a rebound in the commercial mortgage-backed securities market in Europe and new REIT legislation in India.
Some investors say the heightened liquidity is a warning sign. Hyper-liquidity in 2007 was a prelude to the real estate crash, as the flood of debt made available through the CMBS market encouraged borrowers to pay ever higher prices.
Additionally, overbuilding in China on the residential and commercial side have kept some investors wary of putting money in Chinese properties.
“Asia’s tough,” said Moore. “You think everybody should go there but that’s also where a lot of the construction is occurring. No sooner do you buy something than a new building competing for your tenants goes up.”
Real estate companies’ earnings are rising faster than interest rates and as long as that remains the case, demand and asset values will likely hold up, said State Street’s Mazza.
“If we get to a place where leverage because of the excess liquidity is increasing faster than revenue growth and earnings, that is a sign there is some overheating,” he said. “We don’t see that at present.”

-
I know Mike is a very solid investor and respect his opinions very much. So if he says pay attention to this or that - I will.
~ Dale G.
-
I've started managing my own investments so view Michael's site as a one-stop shop from which to get information and perspectives.
~ Dave E.
-
Michael offers easy reading, honest, common sense information that anyone can use in a practical manner.
~ der_al.
-
A sane voice in a scrambled investment world.
~ Ed R.
Inside Edge Pro Contributors

Greg Weldon

Josef Schachter

Tyler Bollhorn

Ryan Irvine

Paul Beattie

Martin Straith

Patrick Ceresna

Mark Leibovit

James Thorne

Victor Adair