

The Canadian Real Estate
PLUNGE-O-METER
Plunge-O-Nomics
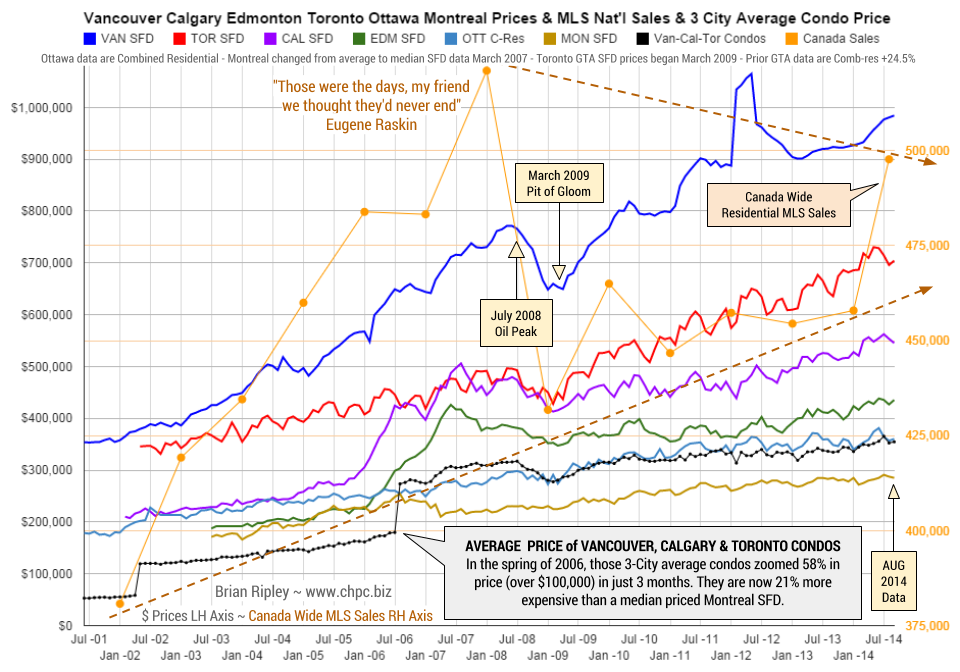
- ’07-’08 Average Vancouver SFD lost $122,900, or 15.9% in 8 months (2%/mo drop)
- ’07-’08 Average Calgary SFD lost $92,499, or 18.3% in 18 months (1%/mo drop)
- ’07-’08 Average Edmonton SFD lost $78,719, or 18.5% in 21 months (0.9%/mo drop)
- ’07-’08 Average Toronto SFD lost $63,867, or 13% in 13 months (1%/mo drop)
- ’07-’08 Average Ottawa Residence lost $25,664, or 8.6% in 6 months (1.4%/mo drop)
- ’07-’08 Median Montreal SFD lost $6,000, down 2.6% in 6 months (0.4%/mo drop)
Another Observation: oil spikes and real estate (TSX Chart)
- 2008 Vancouver down 16% in 8 mos
- 2008 Calgary down 14% in 8 mos
- 2008 Toronto down 14% in 9 mos
- 2008 TSX RE down 51% in 10 mos
- 2011 Vancouver down 2% in 6 mos
- 2011 Calgary down 10% in 8 mos
- 2011 Toronto down 7% in 3 mos
- 2011 TSX RE down 6% in 4 mos
The Tech Bubble Blowout…
Real estate has boomed and plunged in select markets with awesome volatility since the early 2000’s atop a huge edifice of debt that is only being propped up by the willingness of fewer and fewer buyers who think that prices will never collapse despite recent history being full of examples of the opposite (California, Florida, Detroit, Japan, Dubai, Greece, Ireland, Spain, etal).
Rising prices allow both the private and public sectors to over-leverage and with it comes speculative fervor that leads to prices rising further. But when prices decline then market sentiment changes and real estate becomes a slow moving asset class as debt revulsion sets in and fundamental illiquidity leads to asset re-pricing. At that point there is only one viable solution and that is for debt to be transformed into equity, and that occurs either by the debt being repaid slowly, or written off quickly.
In the sell-off phase, governments (who do not issue their own non-convertible currency eg: Greece, Spain and Italy, ie: members of the Eurozone) and corporations and individuals who defer repayment with more leverage (bailouts, bond issuance, secondary financing) are simply delaying the date of foreclosure, increasing the amount of potential asset destruction or lengthening the time and amount of repayment with valuable income streams that could have been used for productive investment (Canadians are producing more weapony and less infrastructure). Increasing debt leverage only works when prices are rising.
With respect to housing, there are much better mortgage models to follow than CMHC’s tax payer “insurance”. See the Danish Mortgage Finance Model where the combined loss ratio for all Danish mortgage credit institutions (MCIs) has never exceeded 1% in any one year – a number most other countries can only dream of.
A change in taxation policy is also needed. The way that government collects tax is highly inequitable. For an elegant solution see the APT (Automatic Payment Transaction) which would eliminate the tax complex. Gone would be personal, corporate, property, estate, capital gain, income, sales, excise and all manner of taxes or levies disguised as fees as well as the elimination of tax returns, deductions and special interest exemptions.
Implementation of this simple idea in Canada would allow Canadians to create an original, authentic social organization that would eventually be copied by all other nations. Let’s apply the power of the internet to build better housing, financing and taxation institutions. Canadians, write your Member of Parliament.


