
Real Estate
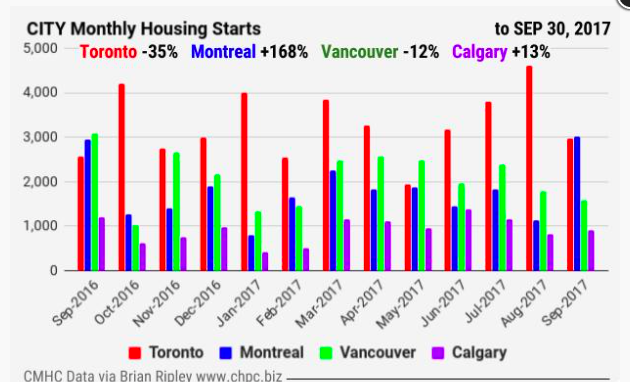
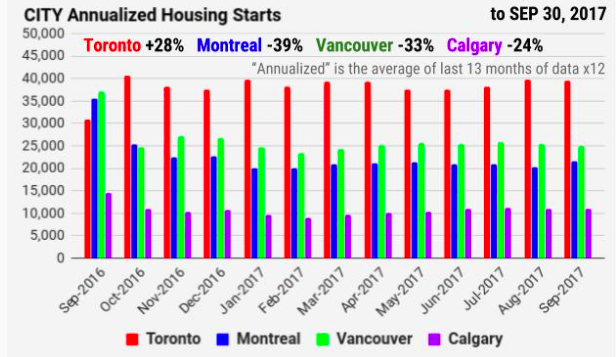
“So far this year, all regions are on pace to surpass construction levels from 2016 except for British Columbia, where starts have declined year-to-date after reaching near-record levels last summer.” “The trend in housing starts for Canada reached its highest level in almost five years”, said Bob Dugan, CMHC’s chief economist.
ANNUAL COUNT of CANADIAN HOUSING STARTS
|
|
Projected Year End 2017 Totals
Canada = 195,269(-1% Y/Y) ON = 74,999 (0% Y/Y) QC = 37,581 (-4% Y/Y) BC = 38,792 (-7% Y/Y) AB = 26,970 (+10% Y/Y) |
NOTE: The chart below shows the actual annual totals count from 1956 through 2016.

CLICK CHART TO ENLARGE
The 2017 data points on the chart are derived from the “annualized” provincial data set in the charts above and are therefor a projection of what year end 2017 might look like.

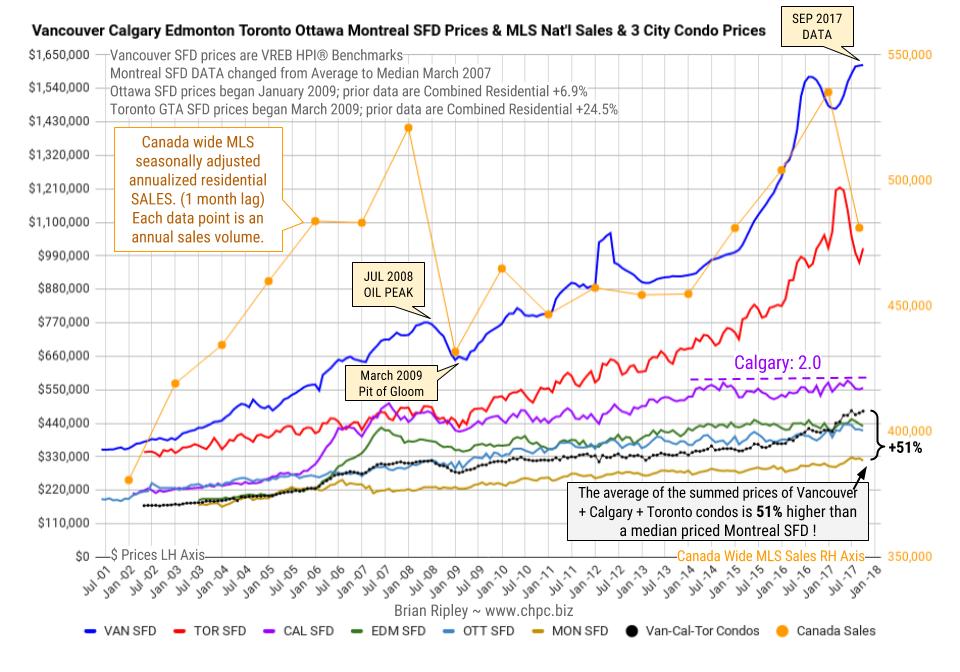
In September 2017 Toronto metro SFD prices found support after 5 months of selling below the March 2017 spike and peak price. The 2017 price gains have vanished. Vancouver prices defy gravity in all residential sectors with another HPI hat trick; FOMO and speculative pricing is still on.
also:
Brian Ripley’s Plunge-o-meter which tracks the dollar and percentage losses from the peak and projects when prices might find support. HERE
The last Gold Market update almost a month ago called the intermediate top within a day, as you may recall, and the subsequent Gold and US Dollar Interim update called the rally in the dollar the day before it started. Having seen a significant reaction back by gold, the question now is “Has it run its course?” The short answer to that is yes, although calling a bottom here is complicated by the fact that gold’s COTs have not eased as much on the reaction as we might have expected, and the dollar Hedgers’ chart is still flat out bullish for the dollar. What this means is that we may need to see some bottoming action by gold, even if it soon breaks out of its rather steep short-term downtrend, and another possibility that we will examine is that the dollar and gold rally in tandem, a rare circumstance that could be occasioned by an extreme development such as an attack on North Korea, although if this happens the peoples of Seoul and Tokyo will doubtless have more important things to think about than the price of gold.
On gold’s latest 6-month chart we can see how the reaction of recent weeks has retraced about 50% of the prior rally, as tensions with N Korea have temporarily eased. This reaction has more than fully corrected the overbought condition resulting from the rally, and has brought gold back into a zone of significant support just above its rising 200-day moving average, and with moving averages in bullish alignment, conditions generally favor a reversal and rally. The “spinning top” candlestick that occurred on Friday on increased volume may mark the turn, although the candlesticks that occurred on the charts for silver and silver proxies look like more convincing reversals.
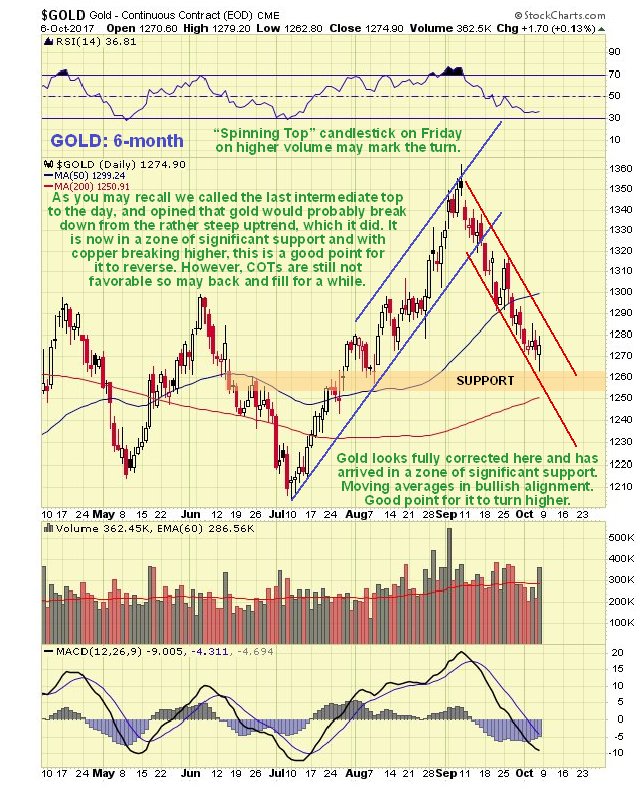
An important factor having a bearing on the outlook for the Precious Metals was the nice reversal in copper on Thursday after a significant reaction, with it gaining nearly 3%…
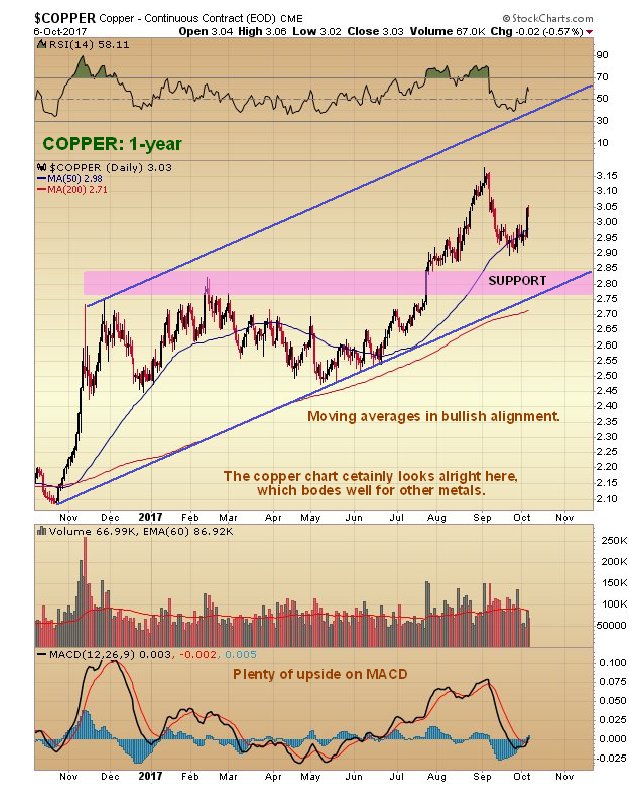
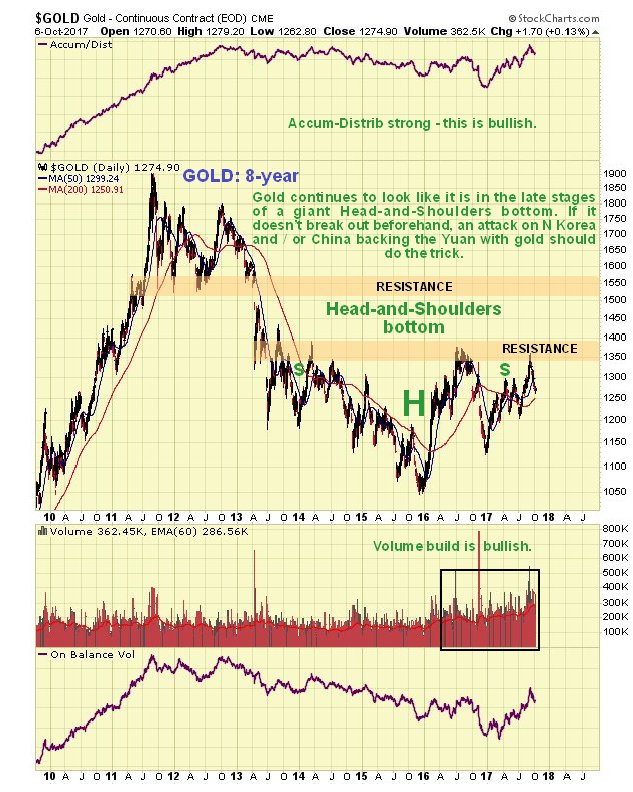
Given that copper tends to lead other metals as it did on the last rally, this could well be followed by gold and silver reversing to the upside after their reaction back to support, despite the dollar looking like it has further to rally. Another positive factor for gold and silver is that there was a full moon late last week and the Precious Metals often reverse on either the new or full moon, although astrologically silver is ruled by the moon and gold by the sun, which may explain why the Incas, famous for their gold, worshipped the sun – which makes a lot more sense than many of the other things that get worshipped. If you think that is wacky, try this for size – eclipses are thought by many astrologers to be a baleful omen, and you may recall that on August 21st a total eclipse of the sun slashed right across the US from coast to coast. Soon after, the country was clobbered by a succession of natural disasters, in addition to Donald Trump’s Tweetstorms, with 3 massively destructive hurricanes impacting Texas, then Florida, and lastly Puerto Rico. Coincidence? – I think not. On gold’s 8-year chart it continues to look like it is in the late stages of a giant Head-and-Shoulders bottom pattern. The buildup in volume over past 20 months certainly looks positive, especially over the past several months, all the more so because it has driven volume indicators higher, notably the Accum-Distrib line, which is not far off making new highs – exceeding its level at the 2011 peak. Once gold breaks above the resistance level approaching $1400 it will be on its way, although it will then have to contend another important band of resistance in the $1510 – $1560 range.
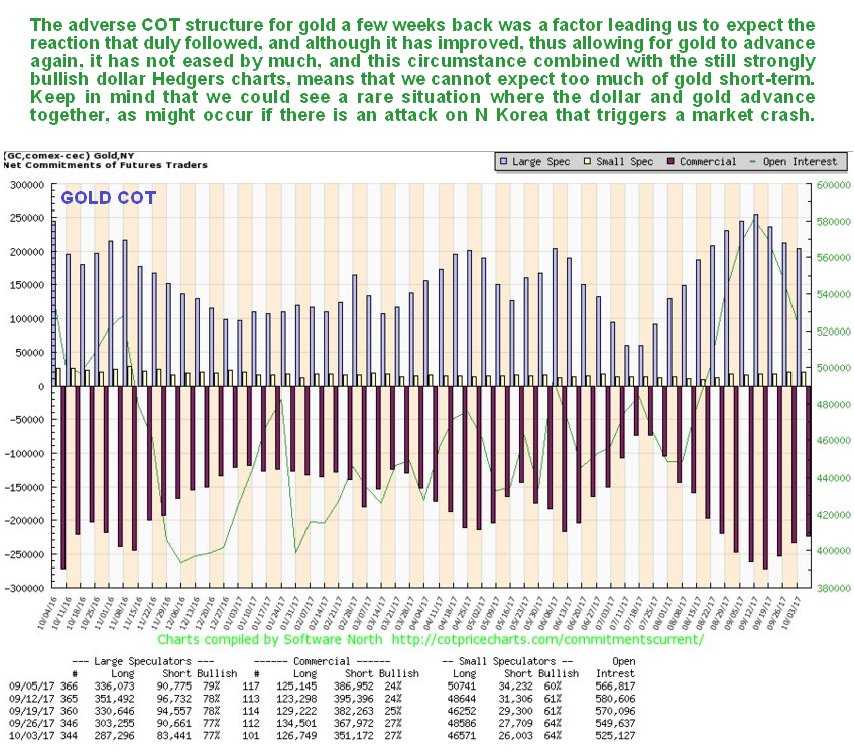
The latest COT chart for gold shows that, while positions have certainly eased on the reaction of recent weeks, they have not eased by as much as one would expect, which sounds a cautionary note and suggests that a rally now may be stunted, and followed by more basing action before a larger uptrend can gain traction. This accords with what we are seeing on the dollar charts, especially the latest dollar Hedgers chart.
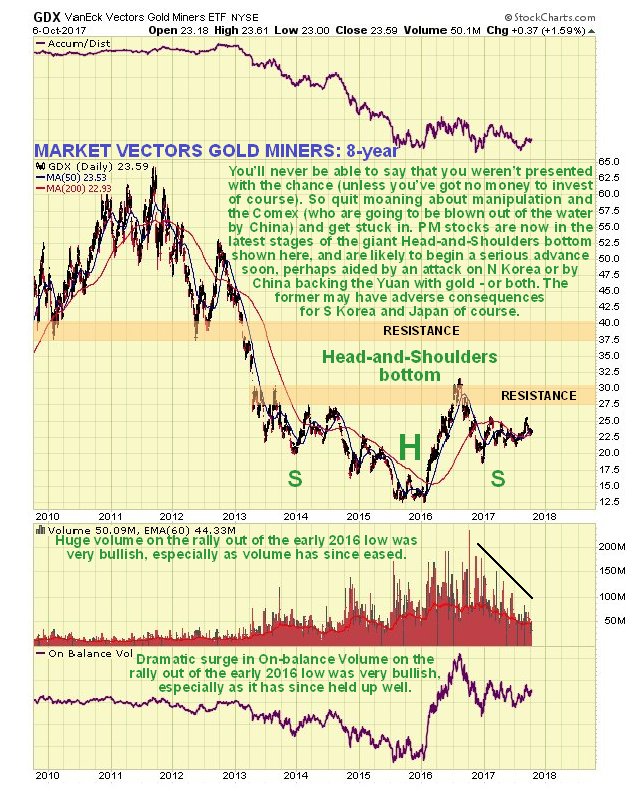
Click on chart to popup a larger, clearer version. The Market Vectors Gold Miners, GDX, which functions as a gold stocks index, is marking out a giant Head-and-Shoulders bottom that roughly parallels the one completing in gold itself. The fact that the price is still well below the strong resistance at the top of this reversal pattern means that prices for many gold (and silver) stocks are still very favorable. The volume pattern during the build out of this base pattern is very bullish, with big volume on the rise out of the low (Head) of the pattern, tailing off steadily as the Right Shoulder has formed.
The dollar looks like it has put in an intermediate bottom. On the 1-year dollar index chart shown below, we can see that it has broken out of its downtrend by a significant margin and looks like it may be marking out a Head-and-Shoulders bottom, although it is still too early to be sure. If it is then we will see a shallow dip to mark out the Right Shoulder of the pattern before it then turns higher.
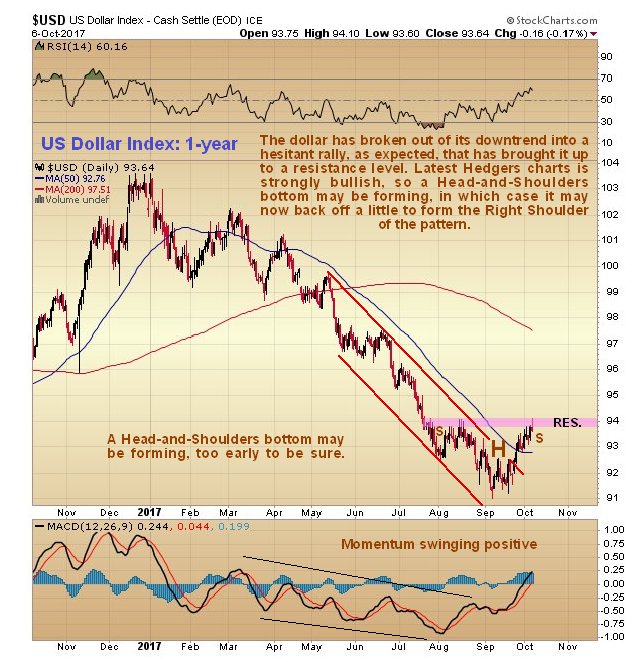
The latest dollar Hedgers chart certainly looks bullish, with the large Commercial Hedgers having cleared out their short positions…
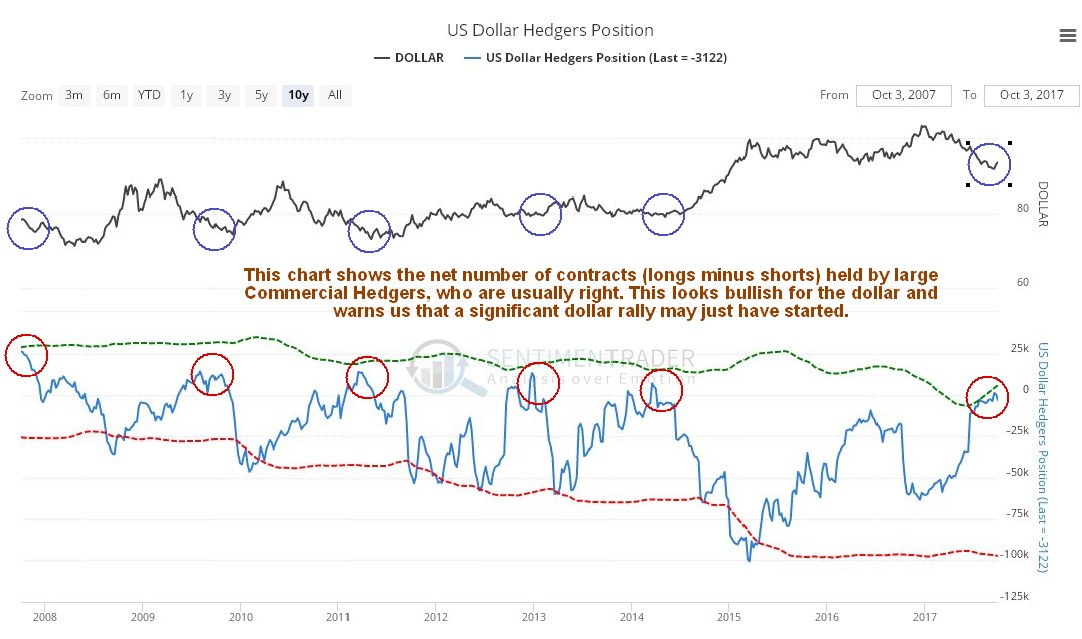
Click on chart to popup a larger, clearer version. Chart courtesy of www.sentimentrader.com
Although we cannot reconcile this positive dollar outlook for the medium-term (long-term outlook remains bearish) with a positive outlook for the Precious Metals sector, there are times when the dollar and gold and silver rally together. This could happen for example if some drastic action is taken with respect to North Korea.


For new investors, getting into the business of buying, selling, and renting homes may seem pretty ambitious.
But like any other area of personal finance expertise, real estate investing boils down to some simple basics. With the right strategies, patience, and a willingness to learn, it’s a discipline that can help you make strides on the path to financial independence.
STRATEGIES FOR REAL ESTATE INVESTING
Today’s infographic comes to us from Offer Climb and it dives into four timeless real estate investing strategies worth knowing.
Whether you aim to do a quick “lipstick” flip or you’d prefer to generate passive income over time, here are the details and resources needed to execute on each strategy.

Although buying and holding is the most common and traditional strategy used for real estate investing, there is actually a variety of different strategies used. Some of these are simple and can be executed in just days, while others can be used on an ongoing basis to create long-term value.
HOW DOES EACH STRATEGY WORK?
The appropriateness of each strategy below depends on your goals, risk tolerance, and local housing market. For the average investor, it is obvious that some of these strategies would also not likely be suited for booming markets like San Francisco, New York City, Vancouver, or Toronto, where multi-million dollar prices are the norm, and bubble risk is higher.
1. The “Lipstick” Flip
The first impression of a house is incredibly important. The “Lipstick” flip involves buying a house that can be easily improved, and then making minimal cosmetic improvements and repairs to sell for a better price.
For the right property, taking the time to fix small issues with flooring, walls, landscaping, and paint can pay off almost immediately.
2. Buy and Hold
This is one of the oldest strategies in the book, and it’s designed for long-term passive income.
By purchasing a property and leasing it to tenants, it creates a stream of monthly cash flows, and even offers potential tax benefits for the owner.
3. Wholesale
This has similarities to flipping, but involves finding a buyer for a seller and taking a percentage off the sale. If done right, this can be done quickly and with minimal risk.
4. Buy, Renovate, Rent, Refinance, and Repeat
Likely the most complex strategy in real estate investing for beginners to follow, this can ultimately be used to provide benefits in both the short and long term.
It involves four steps: buying a property, renovating it, renting the property out to tenants, and then refinancing the mortgage later on. Then the process repeats itself.
Of course, this strategy works best in places where property values are rising fast.
- Dead malls spring back to life
- The start of a huge rally?
- Plus: The best names in cheap retail
The retail apocalypse is a lie.
Don’t get me wrong — the stock losses racked up by the big mall anchors are very real. We’ve spent most of 2017 digging into troubling numbers posted by the prominent brick and mortar retailers. They aren’t pretty. Everyone knows that the first half of the year was a disaster for the mall anchors, with no relief is in sight for some of these troubled companies.
But there’s more to the “death of retail” story than these struggling stores. Watching iconic brands close locations across the country has warped our brains. We see pictures of vacant malls on the news and assume the American shopper has taken his business online for everything from big screen TVs to socks and underwear.
Will we ever leave our homes for the local shopping center again?
Absolutely.
If you dig into the numbers, you’ll find that aside from the high-profile closings, brick and mortar retail is expanding this year. According to IHL Group, U.S. retailers will open 1,326 more locations than they will close in 2017.
Despite popular belief, every single retailer in the country isn’t about to declare bankruptcy. As we’ve said from the start, the best businesses will adapt and survive, whether we’re talking online start-ups or brick and mortar retailers.
The market’s finally starting to catch onto this idea…
For starters, the retail sector halted its nasty year-to-date plunge last month. It’s now quietly on the cusp of breaking out of the downtrend that has held the sector hostage all year.
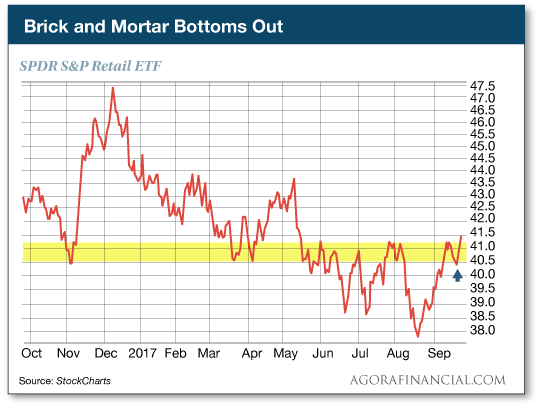
The failed breakdown in late August appears to have sealed the downtrend’s fate. The bears have overplayed their hand and are now susceptible to a face-ripping rally if these poor little retail names can catch a little momentum…
In fact, we’ve already seen select retail stocks rise from the rubble.
Just check out the extreme discounters and dollar stores. We’ve been bulled up on the “cheap junk” sector for a while now. Our theory is that these lean dollar store operations have what it takes to survive alongside Amazon. They fill an important retail niche and don’t have to worry about price-matching gimmicks the big box retailers use to compete.
As you can probably guess, extreme discounters and dollar stores are anything but fancy. But they’re growing. That’s a big deal in the Age of Amazon.
Take Dollar General Corp. (NYSE:DG) New locations are popping up all over rural America. The company is planning to open 1,000 stores before the year is finished. That’s an aggressive expansion plan—especially when you have Amazon breathing down your neck.
Investors are rewarding the effort. DG stock is posting new 2017 highs this week. The same goes for one of its main competitors: Dollar Tree Inc. (NASDAQ:DLTR). Shares are up more than 25% off its summer lows as they push to new year-to-date highs.
The formula is simple. Good deals in small stores make it easy for shoppers to get in and out. That’s why dollar stores are bucking the trend and expanding in this dismal retail environment.
Sincerely,
Greg Guenthner

-
I know Mike is a very solid investor and respect his opinions very much. So if he says pay attention to this or that - I will.
~ Dale G.
-
I've started managing my own investments so view Michael's site as a one-stop shop from which to get information and perspectives.
~ Dave E.
-
Michael offers easy reading, honest, common sense information that anyone can use in a practical manner.
~ der_al.
-
A sane voice in a scrambled investment world.
~ Ed R.
Inside Edge Pro Contributors

Greg Weldon

Josef Schachter

Tyler Bollhorn

Ryan Irvine

Paul Beattie

Martin Straith

Patrick Ceresna

Mark Leibovit

James Thorne

Victor Adair