

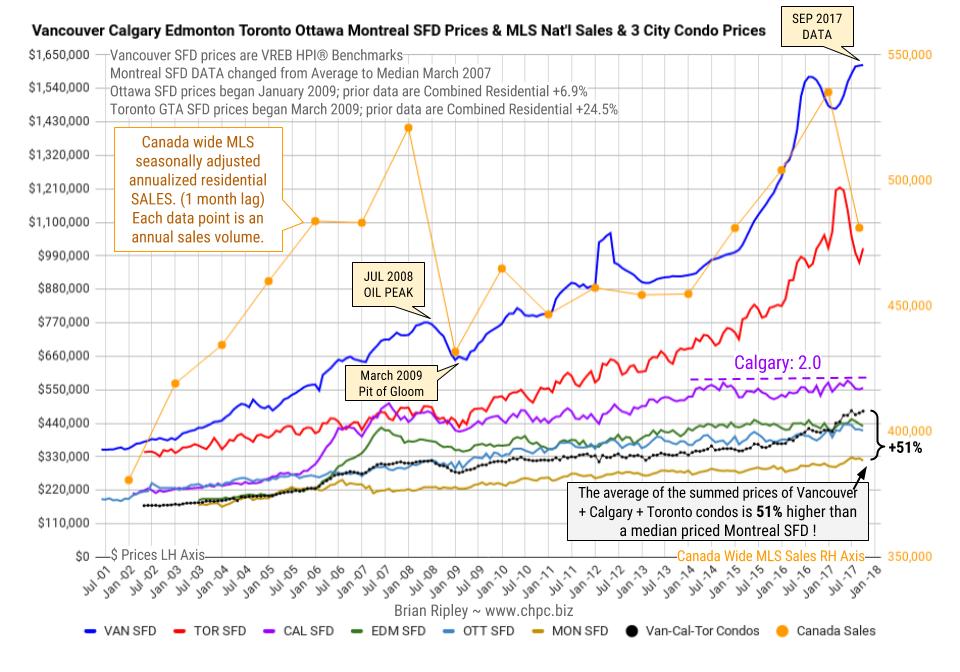
The chart above shows the average detached housing prices for Vancouver*, Calgary, Edmonton, Toronto*, Ottawa* and Montréal* (the six Canadian cities with over a million people each) as well as the average of the sum of Vancouver, Calgary and Toronto condo (apartment) prices on the left axis. On the right axis is the seasonally adjusted annualized rate (SAAR) of MLS® Residential Sales across Canada (one month lag).
In September 2017 Toronto metro SFD prices found support after 5 months of selling below the March 2017 spike and peak price. The 2017 price gains have vanished. Vancouver prices defy gravity in all residential sectors with another HPI hat trick; FOMO and speculative pricing is still on.
also:
Brian Ripley’s Plunge-o-meter which tracks the dollar and percentage losses from the peak and projects when prices might find support. HERE


