
Stocks & Equities
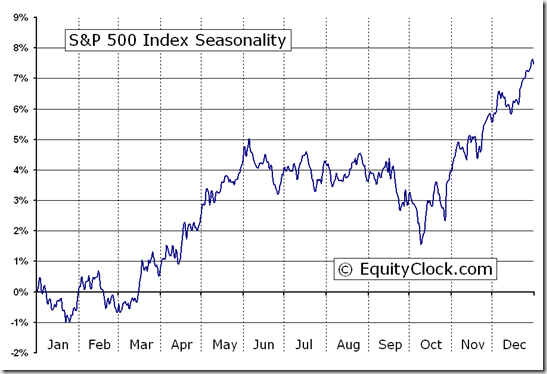
Ed Note: Dodging Overbought status, Don Vialoux’s seasonality studies aim at profiting through Historically reliable patterns (detailed definition HERE). Right now EquityClock says “Seasonal influences on equity markets turn positive in March. They tend to strength as the month progresses.” The TSE tracks the S&P 500 well. All the World’s Major indices charts and commentary are below:

Macro events will continue to influence equity markets this week. The G20 Meeting of Finance Ministers was held in Mexico over the weekend. The focus is on European sovereign debt. Germany’s Parliament discusses the Greek bailout program on Monday. The European consumer confidence and industrial confidence indices are released on Tuesday. Federal Reserve Chairman Ben Bernanke delivers the Semi-annual Monetary Report on Wednesday. China and Euro announce their February Purchasing Managers indices on Thursday. Europe’s unemployment rate is released on Thursday. Russia’s Presidential election is held next Sunday.
Economic news this week is expected to be mixed to slightly negative, breaking a string of economic reports that have encouraged investor confidence. Click HERE for Economic & Earnings News Schedule for this coming week.
The earnings focus this week is on Canada’s banks (scroll down HERE for the Schedule). Fourth quarter reports from the U.S. are winding down. A total of 463 S&P 500 companies have reported to date. 59% have exceeded consensus versus an average of 62% in recent quarters. A total of 104 S&P 500 companies have offered first quarter guidance with 31 companies guiding higher and 64 companies guiding lower.
Short and intermediate technical indicators remain overbought in a wide variety of equity markets and sectors. Fewer sectors are leading the advance.
Cash on the sidelines remains substantial and is unlikely to trend lower until equity markets determine who the next U.S. President will be.
Equity Trends
The S&P 500 Index gained 4.51 points (0.33%) last week. Intermediate trend is up. The Index remains well above its 50 and 200 day moving averages. Short term momentum indicators are overbought and showing early signs of peaking. Short term momentum indicators are not useful until the short term trend line is broken.
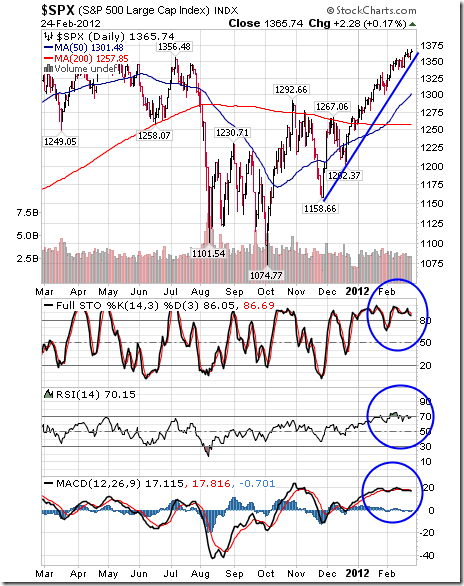
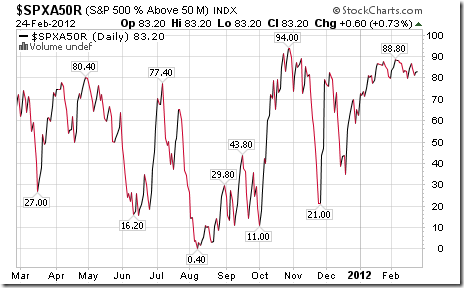
Percent of S&P 500 stocks trading above their 50 day moving average slipped last week from 86.60% to 83.20%. Percent is intermediate overbought and peaked three weeks ago.
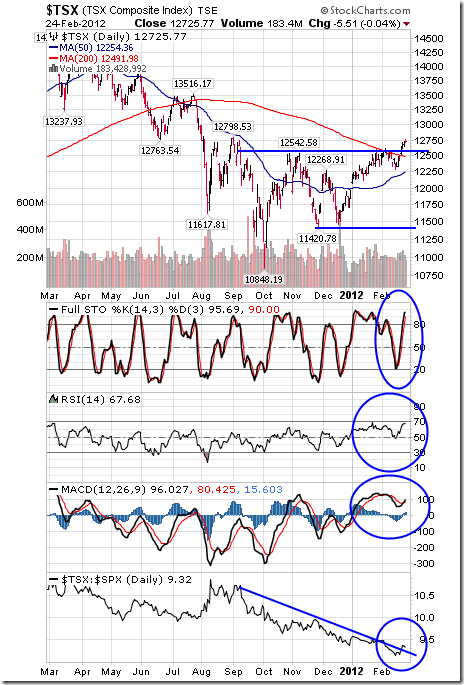
The TSX Composite Index gained 267.47 points (2.15%) last week. Intermediate trend is up. The Index broke above resistance at 12,623.98. Support is at 11,420.78. The Index remains above its 50 day moving average and broke above its 200 day moving average last week. Short term momentum indicators are overbought, but have yet to show signs of peaking. Strength relative to the S&P 500 Index is turning positive. ‘Tis the season for the TSX to outperform the S&P 500 Index!
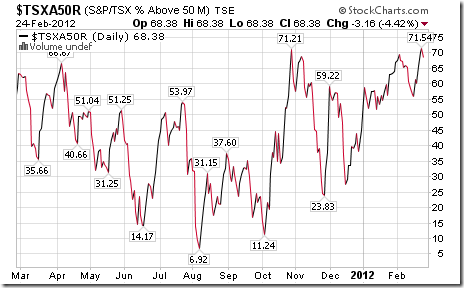
Percent of TSX Composite stocks trading above their 50 day moving average increased last week from 60.08% to 68.38%. Percent remains intermediate overbought.
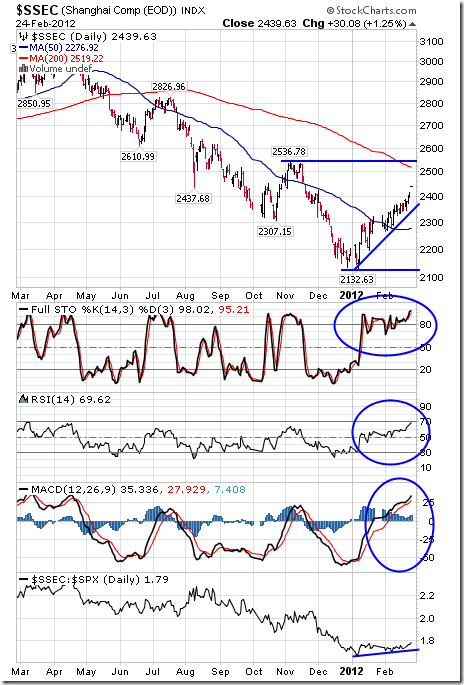
The Shanghai Composite Index gained 66.45 points (2.82%) last week. Intermediate trend is down. Support is at 2,132.63 and resistance is at 2,536.78. The Index trades above its 50 day moving average, but remains below its 200 day moving average. Short term momentum indicators are overbought, but continue to trend higher. Strength relative to the S&P 500 Index remains positive. ‘Tis the season for the Index to move higher!
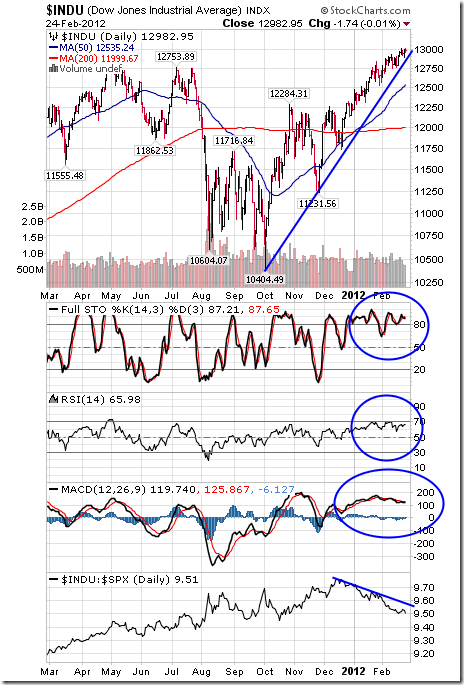
The Dow Jones Industrial Average added 33.08 points (0.26%) last week. Intermediate trend is up. The Average trades well above its 50 and 200 day moving averages. Short term momentum indicators are overbought and showing early signs of peaking. However, short term momentum indicators are not meaningful until short term uptrend in the Average is broken. Strength relative to the S&P 500 Index remains negative.
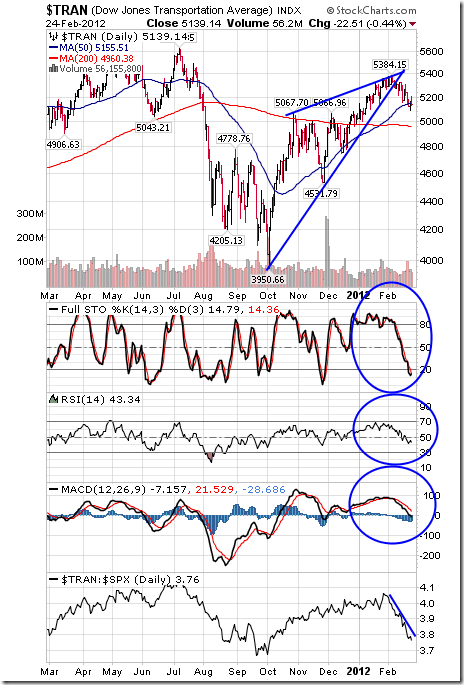
The Dow Jones Transportation Average fell 100.38 points (1.92%) last week. Intermediate trend is up. Support is at 4,531.79 and resistance has formed at 5,384.15. The Average has broken below a rising wedge pattern. The Average trades above its 200 day moving average, but fell below its 50 day moving average on Friday. Short term momentum indicators continue to trend down. Strength relative to the S&P 500 Index remains negative.
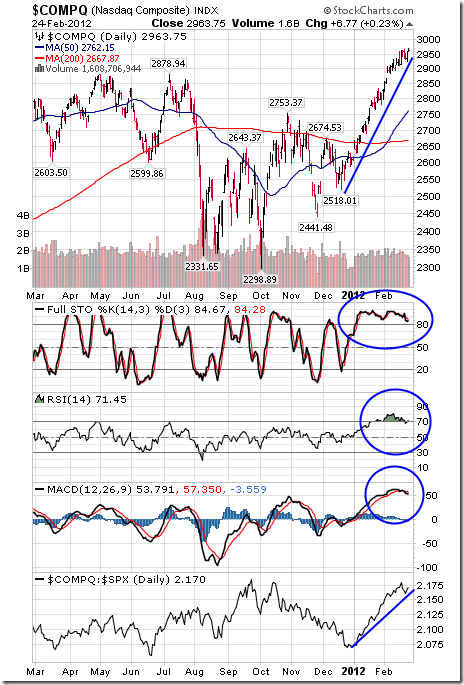
The NASDAQ Composite Index added 11.97 points (0.41%) last week. Intermediate trend is up. Support is at 2,441.48. The Index trades well above its 50 and 200 day moving averages. Short term momentum indicators are overbought and showing early signs of peaking. Significant momentum sell signals will occur when short term uptrend of the Index is broken. Strength relative to the S&P 500 Index remains positive.
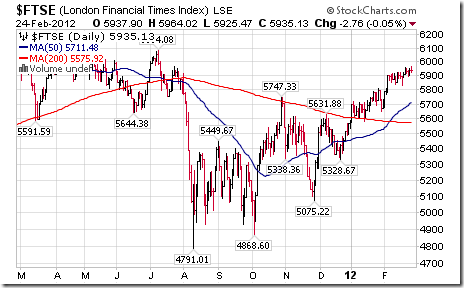
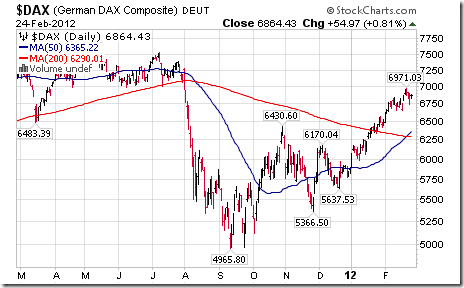
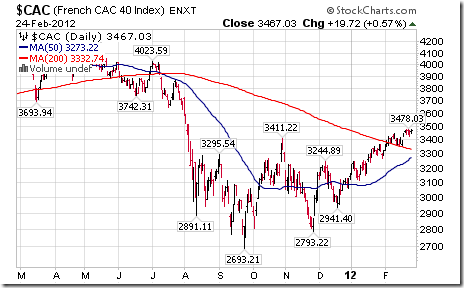
The London FT Index added 30.06 points (0.51%), the Frankfurt DAX improved 16.40 points (0.24%) and the Paris CAC Index gained 27.41 points (0.80%) last week.
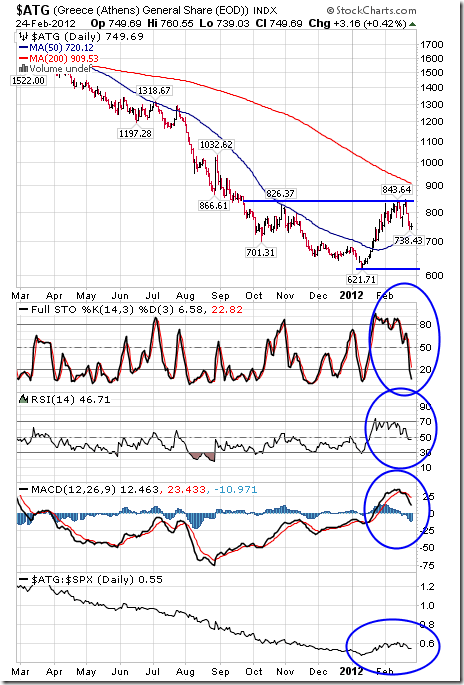
The Athens Index plunged 74.57 points (9.05%) last week. Investors are skeptical that the agreement on sovereign debt will last. Resistance is forming at 843.64. Short term momentum indicators are trending down. Strength relative to the S&P 500 Index has returned negative.
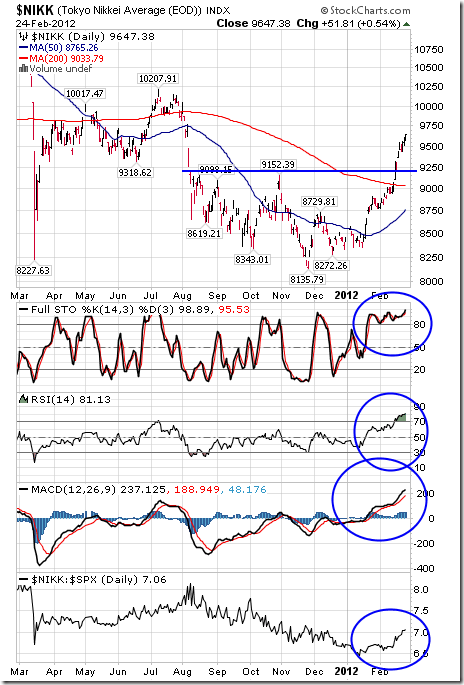
The Nikkei Average gained 263.21 points (2.80%) last week. Intermediate trend is up. The Average trades well above its 50 and 200 day moving averages. Short term momentum indicators are overbought, but continue to trend higher. Strength relative to the S&P 500 Index remains positive. ‘Tis the season for the Nikkei Average to move higher!
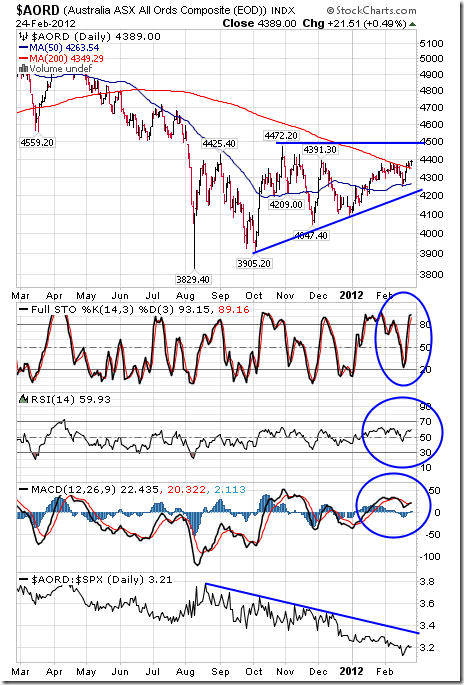
The Australia All Ordinaries Composite Index added 115.74 points (2.71%) last week. Intermediate trend is up. Support is at 3,905.20 and resistance is at 4,472.20. The Index recently bounced from its 50 day moving average and broke above its 200 day moving average last week. Short term momentum indicators continue to trend higher. Strength relative to the S&P 500 Index remains negative.
Other Factors
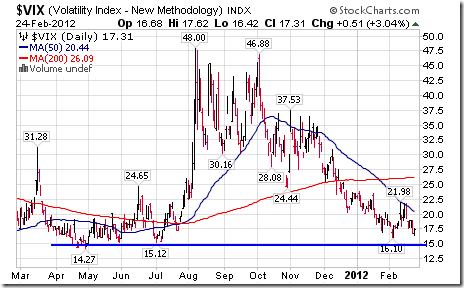
The VIX Index slipped 0.47 (2.64%) last week. Once again, it is testing long term support near 15.00.
…..to view 30 more Charts for Currencies, Commodities and Interest Rates go HERE. Don & Jon Vialoux’s Equityclock.com is offering free access to a data base showing seasonal studies on individual stocks and sectors. The data base holds seasonality studies on over 1000 big and moderate cap securities and indices.
To login, simply go to http://www.equityclock.com/charts/

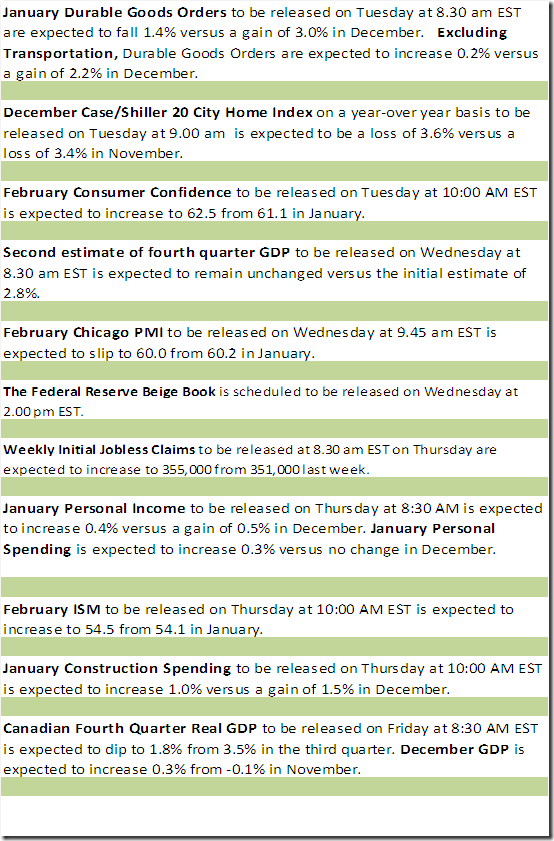
Economic News This Week
Earnings Reports This Week


The record volatility, and 400 point up and down days in the DJIA of last summer seem like a lifetime ago, having been replaced by a smooth, unperturbed, 45 degree-inclined see of stock market appreciation, rising purely on the $2 trillion or so in liquidity pumped into global markets by the central printers, ever since Italy threatened to blow up the Ponzi last fall. In short – we have once again hit peak complacency. Yet with crude now matching every liquidity injection tick for tick, there is absolutely no more space for the world central banks to inject any more stock appreciation without blowing up Obama’s reelection chances (and you can be sure they know it). Suddenly the market finds itself without an explicit backstop. So what are some of the “realizations” that can pop the complacency bubble leading to a stock market plunge, and filling the liquidity-filled gap? Here are, courtesy of David Rosenberg, six distinct hurdles that loom ever closer on the horizon, and having been ignored for too long, courtesy of Bernanke et cie, will almost certainly become the market’s preoccupation all too soon.
1. The nascent task market place improvement was small a lot more than a reflection of deteriorating productiveness growth. As this kind of, businesses will reply in the spring by curbing their hiring ideas. This is exactly what happened a calendar year ago when non-public payroll gains averaged 207k from January to April and the most significant blunder the emboldened bulls did at the time was extrapolate that performance into the future. No quicker did we mention the most likely renewed corporate target on reviving productiveness growth than we noticed Proctor & Gamble announce a five,700 occupation cut or 10% of its manufacturing work power — and the stock price tag was rewarded with a $ two advance.
2. The ballyhooed housing recovery represented a climate report. January was the fourth warmest on report, skewing the data, and February seems to be to be a record for balmy temperature ranges. As this sort of, we could be in for a setback in the housing knowledge, and the most recent weekly info on house loan programs for new purchases could presently be signaling a renewed downturn in profits activity. The volume index for new purchases was down 2.9% in the week of February 17th on leading of an 8.4% slide in the prior week and it has been trending down for four of the past 5 weeks.
3. The European economic downturn is just getting started (See Recession Looms for ten Nations on webpage 2 of the FT) and the effect on Asian trade flows is previously evident in the knowledge — with Chinese export growth fully vanishing in January and producing diffusion indices flashing modest contraction in February. We are possibly one particular to two quarters absent from seeing a significant shock to the U.S. GDP data from an eroding internet international trade overall performance. To catch a glimpse of just how much reaching the Eurozone economic downturn is, have a look at Austerity in Europe Puts Stress on Drug Prices on page B6 of the NYT.
4. What upset the apple cart this time very last yr was the operate-up in oil rates, followed by a lag with a surge in fuel costs at the pump. So instead of acquiring the four.% very first quarter GDP progress number in 2011 that several pundits anticipated, we got .four% rather — correct digits but in the wrong place. The issue was electricity expenses and what that did to the GDP value deflator — it crushed genuine financial expansion (this time it is not the Arab Spring but heightened Israel-Iran tensions at perform). In 24 hours of the release of that GDP report in late April, the stock industry peaked for the yr.
Once yet again, oil costs have ratcheted up and with a lag, we can most likely count on a return to $ four for every gallon for normal gasoline at the pumps by the time spring rolls all around. The front webpage of the USA Right now can make the scenario for why $ 5 for each gallon is probably coming … that would symbolize a lot more than a $ 200 billion drag out of home funds flows. As it stands, consumers have responded by cutting again on energy usage at a pace we have not observed in fifteen years. Notice that motorists in California are currently spending north of $ four for every gallon. And Brent crude charges have strike file highs in the U.K. in sterling phrases and back to 2008 ranges in euro terms for the previously economic downturn-gripped euro location.
Not only have been January retail revenue previously weak, but we just saw two bellwethers —Gap and Kohl’s — all article reduce Q4 earnings. Kohl’s really posted its first income decline in a few years. And we have not even noticed the entire brunt of the energy value influence hit property however.
The transportation shares see what is coming, obtaining peaked on February third, and since then this group has suffered nine losses out of the past thirteen sessions, representing a 4% decline from the nearby peak. This is a bit of a problem for the bulls because the transports in no way did validate the new highs that the Dow and S&P five hundred manufactured — and the index is now at a vital juncture as it kisses the 50-day going regular on the downslope.
5. This hurdle will most likely only grow to be apparent in the 2nd fifty percent of the 12 months and it relates to tax uncertainties and the implications for growing personal and company cost savings prices.
First, the top rated marginal individual tax fee rises to 39.6% from 35% as the Bush tax cuts expire at the stop of 2012. A reduce on itemized deductions will include a even more one.two percentage details to the top rate. Second, a new .9% Medicare tax on incomes more than $ two hundred,000 will get imposed ($ 250,000 for joint filers). Moreover, the best fifteen% price on extended-term funds gains rises to twenty%. And dividends will after yet again be taxed at normal prices — 39.six% for the leading earnings earners. A new 3.eight% tax on investment income also will get launched for incomes over $ 200,000 ($ 250,000 for joint filers). The top estate tax rate goes from 35% to 55% (sixty% in some instances). The estate tax exemption falls to $ one million from $ 5 million (the present-tax exemption also drops to $ 1 million and the charge adjusts hither to 55%). In all, 41 independent tax provisions expire this yr.
6. Fiscal contagion. Just as there is a deep-seated look at of economic re-acceleration in the United States, so too is there a widespread consensus that Europe will muddle via. The ECB’s substantial liquidity infusion previous November and the forthcoming move on February 29th for what pretty much everyone hopes will be a massive LTRO (For a longer time-term Refinancing Operation) just take-up has the masses convinced that Europe is out of the woods.
Markets have dealt with Greece’s default with a shrug. But what if a CDS celebration does get activated? It is feasible. And what if Portugal decides that it desires its bail-out phrases renegotiated, as the FT hints at? Spain is undertaking furthermore as properly — see Spain Pushes Brussels to Reduce Deficit Target as Growth Hopes are Dashed on the front webpage of the FT and also have a seem at Spain Counts Social Fees of Austerity Drive on page 2 of the FT.
The lack of self-assurance is so palpable that some corporates in Portugal, like Portugal Telecom, trade at a 600 basis level price reduction to equivalent federal government bonds. Even Italy is far from out of the woods (allow on your own Spain) — the ECB’s intervention efforts may have helped drag ten-year yields down to 5.4% from the latest peak of more than seven%, but personal debt and debt-program dynamics are this kind of that fiscal sustainability can only be achieved, barring an economic boom (which is not in the cards), if yields can break decisively underneath four% and remain there.


Since 1978, China has been exporting more goods than it has imported. That’s allowed the nation to stockpile trillions of Dollars. What to do with so much money?
The way it works is simple to understand. When a Chinese business earns Dollars by selling overseas, the law requires the company to hand those Dollars over to the country’s central bank, the People’s Bank of China (PBOC). In return, the business gets Chinese currency (called either the “Yuan” or the “Renminbi”) at a fixed rate.
There’s nothing fair about this. The Chinese people do all the work, and the Chinese government keeps all of the money. But that’s the way it goes.
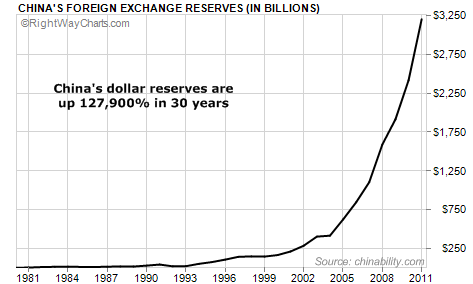
At first, the Dollar inflow was small because trade between the two countries was tiny. In 1980, for example, China’s foreign currency reserves stood at approximately $2.5 billion. But since then, the amount of foreign currency reserves held by the Chinese government has gone up nearly every year…and now stands at $3.2 TRILLION. That’s a 127,900% increase. It’s simply astonishing to look at the chart of the increase in currency reserves…
As I mentioned yesterday, the group in China that manages these foreign reserves is called the State Administration of Foreign Exchange (SAFE). This group is engaged in a full-fledged currency war with the United States. The ultimate goal – as the Chinese have publicly stated – is to create a new dominant world currency and dislodge the US Dollar from its current reserve role.
And for the past few years, SAFE has had one big problem, where to put the money.
SAFE decided to use most of these reserves to buy US government securities. As a result, the Chinese have now accumulated a massive pile of US government debt. In fact, about two-thirds of China’s reserves remain invested in US Treasury bills, notes, and bonds. The next biggest chunk is in Euro. Of course, all this money is basically earning nothing to speak of in terms of interest…because interest rates around the world are close to zero.
And while the Chinese would love to diversify and ditch a significant portion of their US Dollar holdings, they are essentially stuck. You see, if the Chinese start selling large amounts of their US government bonds, it would push the value of those bonds (and their remaining holdings) way down. It would be like owning 10 houses on the same block in your neighborhood…and deciding to put five of them up for sale at the same time. Imagine how much that would depress the value of all the properties with so much for sale at one time.
One thing China tried to do in recent years was speculate in the US stock market. But that did not go well…The Chinese government bought large amounts of US equities just before the market began to crash in late 2007. It purchased a nearly 10% stake in the Blackstone Group (an investment firm)…and a similar stake in Morgan Stanley. Blackstone’s shares are down about 46% since the middle of 2007, and Morgan Stanley is down about 70% since the Chinese purchase.
The Chinese authorities got burned big time by the US equities markets and received a lot of heat back home. They are not eager to return to the US stock market in a meaningful way. So China’s US Dollar reserves just keep piling up in various forms of fixed income – US Treasury bonds, Fannie and Freddie mortgage bonds, and other forms of debt backed by the US government. These investments are considered totally safe – except that they’re subject to the risk of inflation.
According to a statement by the government: “SAFE will never be a speculator. It mainly seeks to protect the safety of China’s foreign exchange reserves and ensure a stable investment return.”
If the Chinese won’t buy stocks and the only real risk to their existing portfolio is inflation, what do you think they will do to hedge that risk?
They will Buy Gold…lots and lots of gold.
The Chinese are now clearly on a path to accumulate so much gold that one day soon, they will be able to restore the convertibility of their currency into a precious metal…just as they were able to do a century ago when the country was on the silver standard.
The West wasn’t kind to China back then. The country was repeatedly looted and humiliated by Russia, Japan, Britain, and the United States. But today, it is a different story…
Now, China is the fastest-growing country on Earth, with the largest cash reserves on the planet. And as befits a first-rate power, China’s currency is on the path to being backed by gold.
China desperately wants to return to its status as one of the world’s great powers…with one of the world’s great currencies. And China knows that in this day and age – when nearly all governments around the globe are printing massive amounts of currency backed by nothing but an empty promise – it can gain a huge advantage by backing its currency with a precious metal.
As the great financial historian Richard Russell wrote recently: “China wants the Renminbi to be backed with a huge percentage of gold, thereby making the Renminbi the world’s best and most trusted currency.”
I know this will all sound crazy to most folks. But most folks don’t understand gold, or why it represents real, timeless wealth. The Chinese do.
About the Bullion Vault
The BullionVault gives private investors around the world access to the professional bullion markets. You can benefit from the lowest costs for buying, selling and storing gold and silver.
We currently take care of some $2 billion for more than 34,500 users, making us the world’s largest online investment gold service.
We have been saying it for weeks, and today even the WSJ jumped on the bandwagon: the sole reason why crude prices are surging is because global liquidity has risen by $2 trillion in a few short months, on the most epic shadow liquidity tsunami launched in history in lieu of QE3 (discussed extensively here in our words, but here are JPM‘s). Luckily, the market is finally waking up to this, and just as world central banks were preparing to offset deflation, they will instead have to deal with spiking inflation, because the market may have a short memory, it can remember what happened just about this time in 2011. And the problem is that when it comes to the inflation trade, the market, unlike in most other instances, can be fast – blazing fast, at anticipating what the central planning collective’s next step will be, after all there is only one. And if Bank of America is correct, that next step could well lead to the same unprecedented economic catastrophe that we saw back in 2008, only worse: $200 oil. Note –this is completely independent of what happens in Iran, and is 100% dependent on what happens in the 3rd subbasement of the Marriner Eccles building. Throw in an Iran war and all bets are off. Needless to say, an epic deflationary shock will need to follow immediately, just as in 2008, which means that, in keeping with the tradition of being 6-9 months ahead of the market, our question today is – which bank will be 2012’s sacrificial Lehman to set off the latest and greatest deflationary collapse and send crude plunging to $30 just after it hits $200.
How do we get to $200 crude? Read the detailed explanation and view the charts HERE


-
I know Mike is a very solid investor and respect his opinions very much. So if he says pay attention to this or that - I will.
~ Dale G.
-
I've started managing my own investments so view Michael's site as a one-stop shop from which to get information and perspectives.
~ Dave E.
-
Michael offers easy reading, honest, common sense information that anyone can use in a practical manner.
~ der_al.
-
A sane voice in a scrambled investment world.
~ Ed R.
Inside Edge Pro Contributors

Greg Weldon

Josef Schachter

Tyler Bollhorn

Ryan Irvine

Paul Beattie

Martin Straith

Patrick Ceresna

Mark Leibovit

James Thorne

Victor Adair