

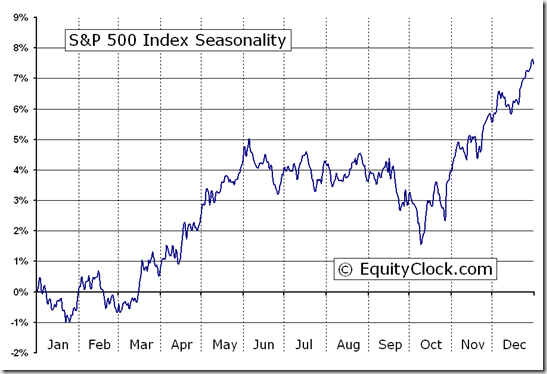
Ed Note: Dodging Overbought status, Don Vialoux’s seasonality studies aim at profiting through Historically reliable patterns (detailed definition HERE). Right now EquityClock says “Seasonal influences on equity markets turn positive in March. They tend to strength as the month progresses.” The TSE tracks the S&P 500 well. All the World’s Major indices charts and commentary are below:
Macro events will continue to influence equity markets this week. The G20 Meeting of Finance Ministers was held in Mexico over the weekend. The focus is on European sovereign debt. Germany’s Parliament discusses the Greek bailout program on Monday. The European consumer confidence and industrial confidence indices are released on Tuesday. Federal Reserve Chairman Ben Bernanke delivers the Semi-annual Monetary Report on Wednesday. China and Euro announce their February Purchasing Managers indices on Thursday. Europe’s unemployment rate is released on Thursday. Russia’s Presidential election is held next Sunday.
Economic news this week is expected to be mixed to slightly negative, breaking a string of economic reports that have encouraged investor confidence. Click HERE for Economic & Earnings News Schedule for this coming week.
The earnings focus this week is on Canada’s banks (scroll down HERE for the Schedule). Fourth quarter reports from the U.S. are winding down. A total of 463 S&P 500 companies have reported to date. 59% have exceeded consensus versus an average of 62% in recent quarters. A total of 104 S&P 500 companies have offered first quarter guidance with 31 companies guiding higher and 64 companies guiding lower.
Short and intermediate technical indicators remain overbought in a wide variety of equity markets and sectors. Fewer sectors are leading the advance.
Cash on the sidelines remains substantial and is unlikely to trend lower until equity markets determine who the next U.S. President will be.
Equity Trends
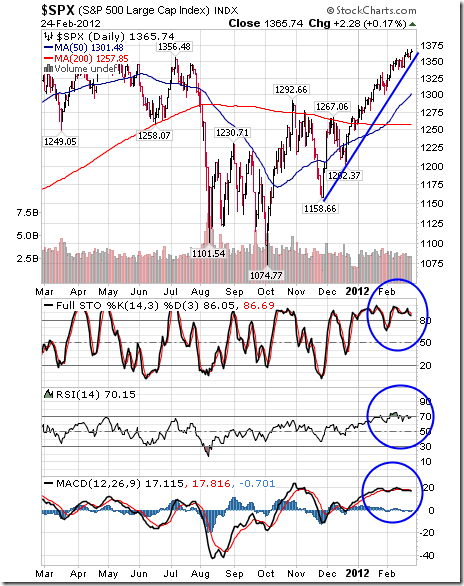
The S&P 500 Index gained 4.51 points (0.33%) last week. Intermediate trend is up. The Index remains well above its 50 and 200 day moving averages. Short term momentum indicators are overbought and showing early signs of peaking. Short term momentum indicators are not useful until the short term trend line is broken.
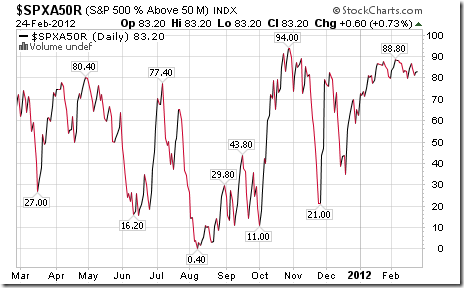
Percent of S&P 500 stocks trading above their 50 day moving average slipped last week from 86.60% to 83.20%. Percent is intermediate overbought and peaked three weeks ago.
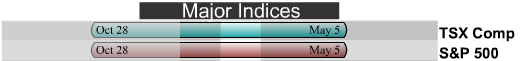
The TSX Composite Index gained 267.47 points (2.15%) last week. Intermediate trend is up. The Index broke above resistance at 12,623.98. Support is at 11,420.78. The Index remains above its 50 day moving average and broke above its 200 day moving average last week. Short term momentum indicators are overbought, but have yet to show signs of peaking. Strength relative to the S&P 500 Index is turning positive. ‘Tis the season for the TSX to outperform the S&P 500 Index!
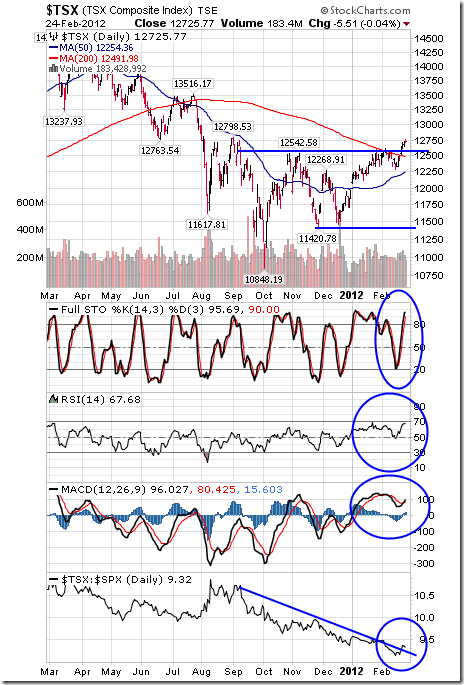
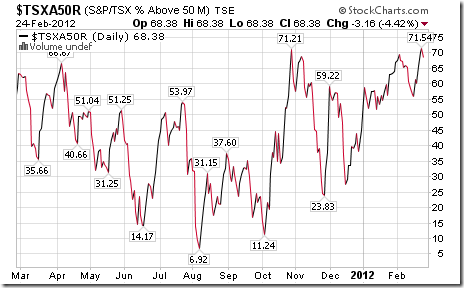
Percent of TSX Composite stocks trading above their 50 day moving average increased last week from 60.08% to 68.38%. Percent remains intermediate overbought.
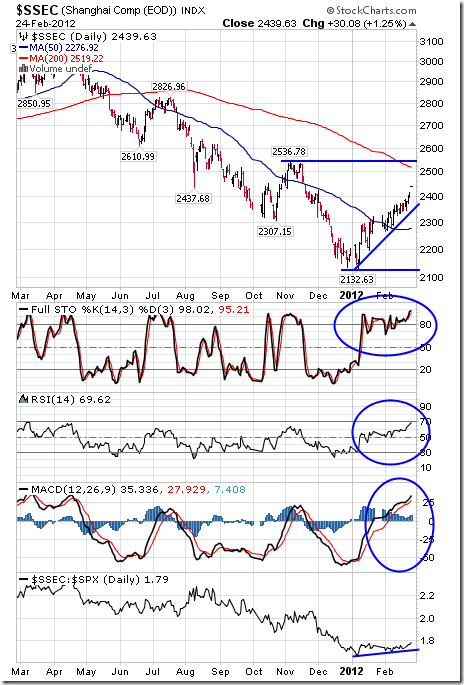
The Shanghai Composite Index gained 66.45 points (2.82%) last week. Intermediate trend is down. Support is at 2,132.63 and resistance is at 2,536.78. The Index trades above its 50 day moving average, but remains below its 200 day moving average. Short term momentum indicators are overbought, but continue to trend higher. Strength relative to the S&P 500 Index remains positive. ‘Tis the season for the Index to move higher!
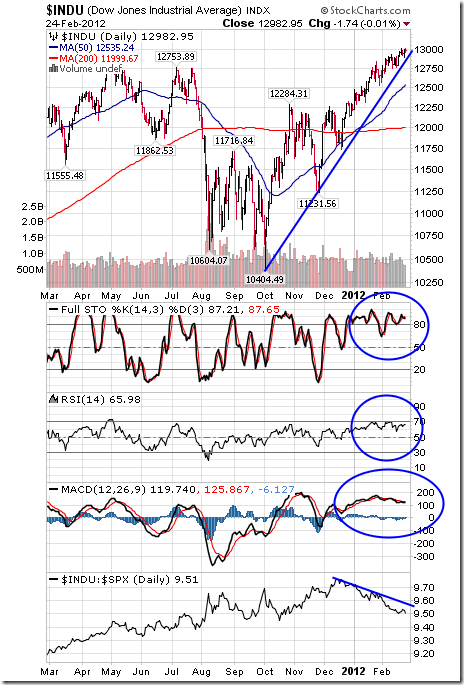
The Dow Jones Industrial Average added 33.08 points (0.26%) last week. Intermediate trend is up. The Average trades well above its 50 and 200 day moving averages. Short term momentum indicators are overbought and showing early signs of peaking. However, short term momentum indicators are not meaningful until short term uptrend in the Average is broken. Strength relative to the S&P 500 Index remains negative.
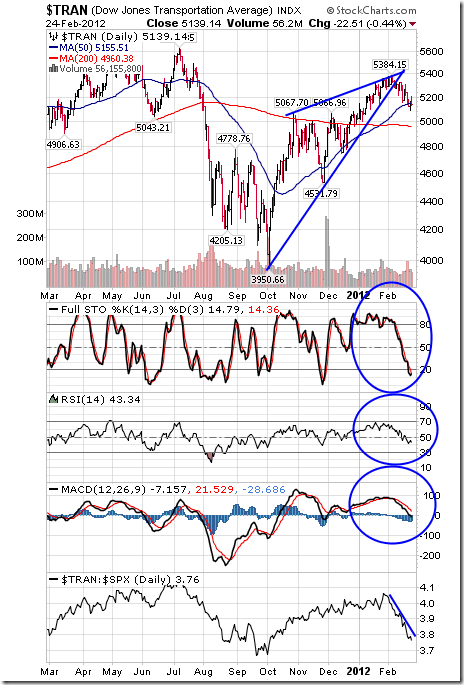
The Dow Jones Transportation Average fell 100.38 points (1.92%) last week. Intermediate trend is up. Support is at 4,531.79 and resistance has formed at 5,384.15. The Average has broken below a rising wedge pattern. The Average trades above its 200 day moving average, but fell below its 50 day moving average on Friday. Short term momentum indicators continue to trend down. Strength relative to the S&P 500 Index remains negative.
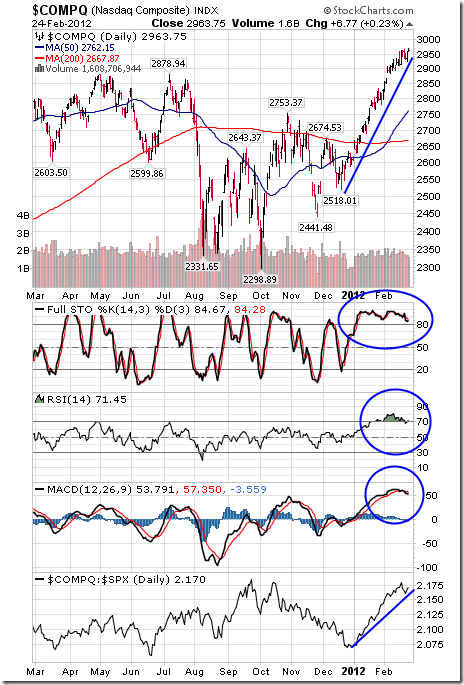
The NASDAQ Composite Index added 11.97 points (0.41%) last week. Intermediate trend is up. Support is at 2,441.48. The Index trades well above its 50 and 200 day moving averages. Short term momentum indicators are overbought and showing early signs of peaking. Significant momentum sell signals will occur when short term uptrend of the Index is broken. Strength relative to the S&P 500 Index remains positive.
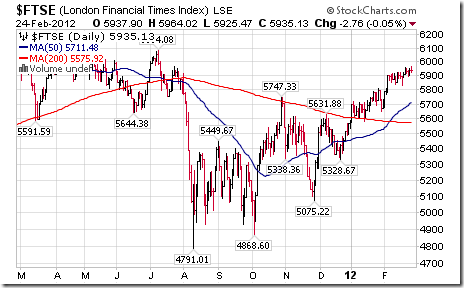
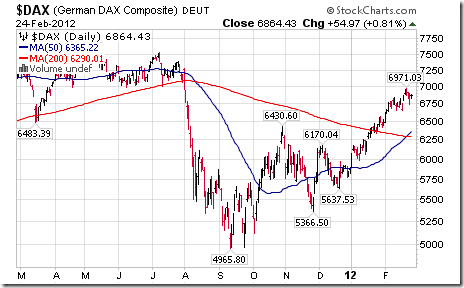
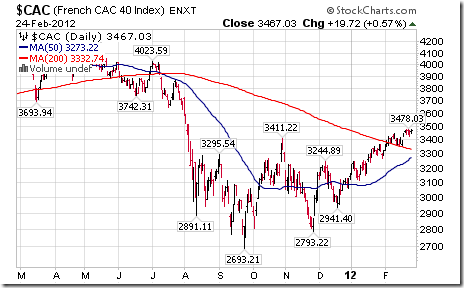
The London FT Index added 30.06 points (0.51%), the Frankfurt DAX improved 16.40 points (0.24%) and the Paris CAC Index gained 27.41 points (0.80%) last week.
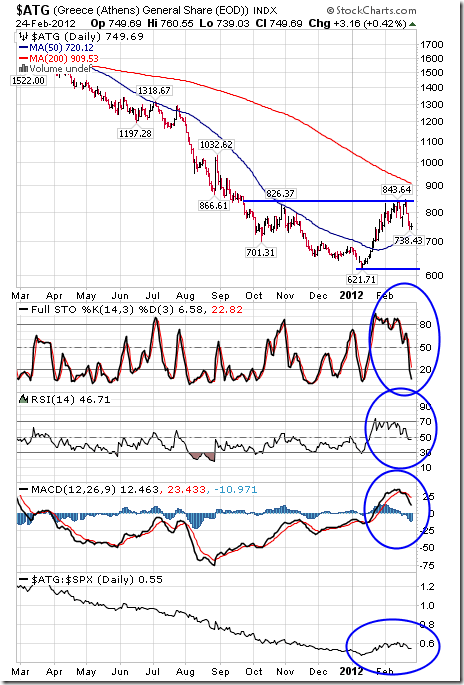
The Athens Index plunged 74.57 points (9.05%) last week. Investors are skeptical that the agreement on sovereign debt will last. Resistance is forming at 843.64. Short term momentum indicators are trending down. Strength relative to the S&P 500 Index has returned negative.
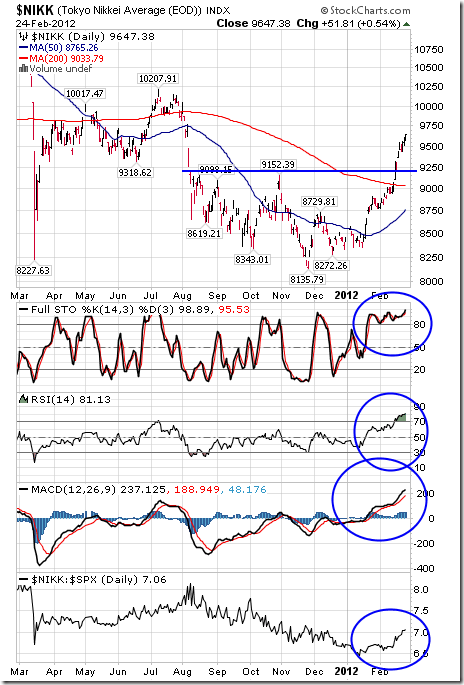
The Nikkei Average gained 263.21 points (2.80%) last week. Intermediate trend is up. The Average trades well above its 50 and 200 day moving averages. Short term momentum indicators are overbought, but continue to trend higher. Strength relative to the S&P 500 Index remains positive. ‘Tis the season for the Nikkei Average to move higher!
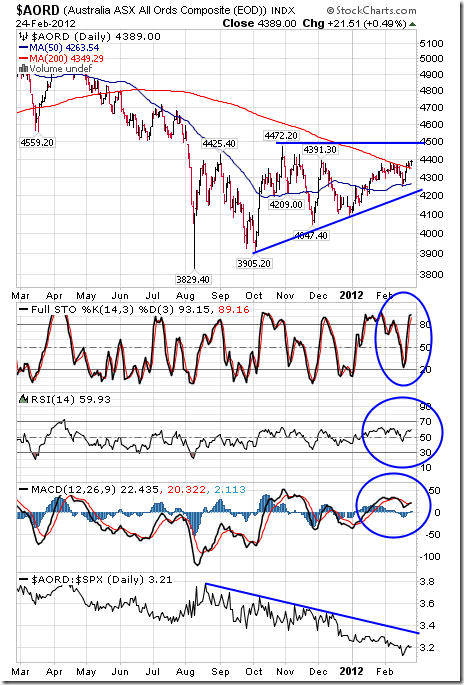
The Australia All Ordinaries Composite Index added 115.74 points (2.71%) last week. Intermediate trend is up. Support is at 3,905.20 and resistance is at 4,472.20. The Index recently bounced from its 50 day moving average and broke above its 200 day moving average last week. Short term momentum indicators continue to trend higher. Strength relative to the S&P 500 Index remains negative.
Other Factors
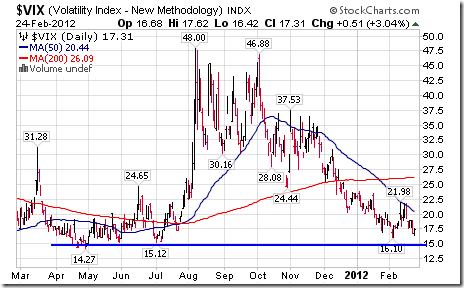
The VIX Index slipped 0.47 (2.64%) last week. Once again, it is testing long term support near 15.00.
…..to view 30 more Charts for Currencies, Commodities and Interest Rates go HERE. Don & Jon Vialoux’s Equityclock.com is offering free access to a data base showing seasonal studies on individual stocks and sectors. The data base holds seasonality studies on over 1000 big and moderate cap securities and indices.
To login, simply go to http://www.equityclock.com/charts/


