
Currency

“The only thing that saves us from bureaucracy is its inefficiency.”
– Eugene McCarthy
We foolishly find ourselves asking: when will Federal Reserve quantitative easing reach its limit?
Considering the consequent boost to risk appetite that flows from QE, enriching those who hold financial assets while doing little for those holding welding torches and spatulas, we are happy to tell you that the Fed has plenty of room to maneuver the printing presses still.
And if you’re wondering just how much credit they can pump into banks or how much government debt they can buy up in order to keep the Keynesian desperados operating, it’s at least 26% more of total government debt – that would take them to even with the ECB efforts that have to this point “succeeded” in suppressing severe risks:
To read full article CLICK HERE


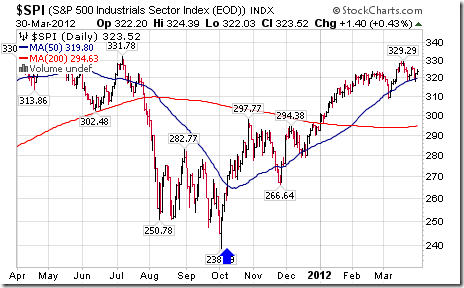
This column recommended accumulation of Exchange Traded Funds in the Industrial sector on October 11th for a seasonal trade lasting until Spring. Since then, the S&P Industrial Index has gained 23.9 per cent. What should holders of Exchange Traded Funds and related equities in the sector do now?
The industrial sector includes a wide variety of subsectors including industrial conglomerates, aerospace & defense, machinery, air freight & airlines, road & rail, electrical equipment, construction and engineering and building products. Investors can choose between 24 ETFs that track the sector or its subsectors. Largest holdings in the S&P Industrial Index are General Electric, United Parcel Services, United Technologies, Caterpillar, MMM, Boeing, Union Pacific, Honeywell, Cummins and Emerson Electric.
The industrials sector has a period of seasonal strength from October 9th to May 31st. Average return per period during the past 20 periods was 15.0 per cent. The current period has recorded significantly higher than average returns through actively traded Exchange Traded Funds. Excluding dividend distributions, the Industrial Select Sector SPDR Fund (XLI $37.42) has gained 21.0 per cent, the Vanguard Industrial Index Fund (VIS $69.54) has advanced 20.0 per cent, iShares on the Dow Jones Transportation Average (IYT $93.69) gained 15.5 per cent, the Dow Jones US Aerospace & Defense Fund (ITA $67.13) gained 17.4 per cent and Market Vectors Environmental Services ETF added 14.7 per cent.
On the charts, the S&P Industrials Index has a positive, but deteriorating technical profile. Intermediate trend is up. The Index trades above its 50 and 200 day moving averages. However, strength relative to the S&P 500 turned negative at the end of January and short term momentum indicators started to roll over from overbought levels last week. The Index at 323.52 currently has resistance at 329.29. In addition, several key stocks in the sector including United Technologies, Caterpillar and Boeing broke below technical support levels last week.
The sector is vulnerable to news from first quarter earnings report when they begin to appear next week. General Electric, United Parcel Services, United Technologies and Caterpillar are scheduled to report modest earnings gains on a year-over-year basis while MMM, Boeing and Honeywell are expected to report modest declines. Of greater concern, second quarter earnings guidance released with first quarter reports could be revised lower by several key companies in the sector. Most companies in the sector realize more than half to their earnings from operations outside of the United States. Currency translation into U.S. Dollars at a time when the U.S. Dollar Index is high relative to the same period last year will significantly dampen earnings expectations in the second quarter.
Preferred strategy is to take seasonal profits on Industrial sector Exchange Traded Funds and related equities at current or higher prices.
Don Vialoux is the author of free daily reports on equity markets, sectors,
commodities and Exchange Traded Funds. . Daily reports are
available at http://www.timingthemarket.ca/. He is also a research analyst for
Horizons Investment Management Inc. All of the views expressed herein are his
personal views although they may be reflected in positions or transactions
in the various client portfolios managed by Horizons Investment Management.

Investors may be taken for a ride by today’s Minutes of the Federal Open Market Committee (FOMC), which expand on the FOMC’s March 13, 2012 statement; in the interim, we believe the Federal Reserve (Fed) Chairman Bernanke has gone out of his way to assure the markets that monetary policy will remain “highly accommodative,” at least through late 2014.
The Fed does indeed have a credibility problem: having assured investors that rates will remain low for an extended period, it may only take one or two FOMC members to turn more optimistic about the economic outlook to cause the markets to more aggressively price-in tighter monetary policy. Conversely, Bernanke has made it clear that he is most concerned about a recovery in the housing market and that low interest rates – throughout the yield curve – are desirable. Operation Twist is specifically aimed to achieve that, lowering long-term rates and flattening the yield curve. However, should investors become increasingly optimistic about economic improvement, odds increase that investors sell bonds, putting upward pressure on long-term rates.
To understand the Fed’s “communication strategy”, one needs to be aware of who is calling the shots. We are not just talking about Fed Chairman Bernanke, but also the composition of voting FOMC members. Without a doubt, the “hawks” (hawks are FOMC members considered to favor tighter monetary policy compared to “doves”) on the FOMC are getting more vocal. At the same time, the only voting “hawk” on the FOMC this year is Richmond Fed President Jeff Lacker:
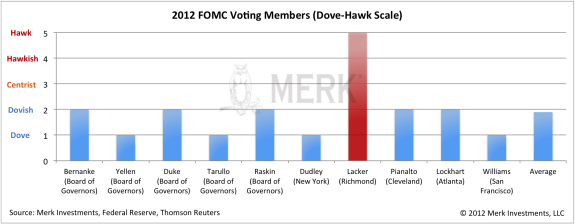
The scale may tilt a tad towards the centrist/hawkish side should Congress fill the two vacant seats with the candidates under consideration. Still, when all is said and done, it is the voting members who ultimately determine imminent monetary policy decisions, rather than the noise created by non-voting members. And those actions remain, in our interpretation, decisively on the dovish side:
- “almost all members again agreed to…maintain a highly accommodative stance…”
- “a number of members perceived a non-negligible risk that improvements in employment could diminish as the year progressed”
Obviously, should economic data continue to surprise to the upside, the Fed will have an ever-more difficult time defending its dovish position. The credibility of the Fed will be seriously tested as the Fed has committed to keeping rates low until late 2014. However, should we enter a weak patch, we believe the odds are rather high that the FOMC will “take out insurance” against another slowdown. In a world where everyone hopes for the best, but plans for the worst, central banks around the world – including the Fed – may keep the world awash in money.
After all, a world laden with debt may need inflation if deflation is to be avoided. Bernanke has argued many times that tightening monetary policy too early was one of the biggest mistakes the Fed made during the Great Depression. We don’t think Bernanke will repeat this. Indeed, we consider he will err firmly on the side of inflation. As such, when the dust settles, look at actions, not words. We see doves, not hawks, managing the monetary aviary.
Please register for our Webinar on Thursday, April 19, or sign up for our newsletterto be informed as we discuss global dynamics and their impact on currencies.
Axel Merk
President and Chief Investment Officer, Merk Investments
Merk Investments, Manager of the Merk Funds

-
I know Mike is a very solid investor and respect his opinions very much. So if he says pay attention to this or that - I will.
~ Dale G.
-
I've started managing my own investments so view Michael's site as a one-stop shop from which to get information and perspectives.
~ Dave E.
-
Michael offers easy reading, honest, common sense information that anyone can use in a practical manner.
~ der_al.
-
A sane voice in a scrambled investment world.
~ Ed R.
Inside Edge Pro Contributors

Greg Weldon

Josef Schachter

Tyler Bollhorn

Ryan Irvine

Paul Beattie

Martin Straith

Patrick Ceresna

Mark Leibovit

James Thorne

Victor Adair