
Stocks & Equities
This market wants to go up: My theme the past few weeks has been, “This market wants to go up,” and it was up again this week with the DJI up 100 points (Toronto up 230 points) to a new 3 month high. There have only been 3 higher weekly closes on the DJI since 2007…and if it had closed 30 points higher this past Friday it would have been the highest weekly close since December 2007.
Ed Note: Transcript continues below, or click on image for BNN Segment:
Low volume: Summer doldrums, European vacations and the Olympics contributed to the lowest weekly volume in the DJI for 2012 YTD.
Since the June 4 Key Turn Date: (a date that saw several Key Weekly Reversals) the DJI is up nearly 1200 points, the TSE is up nearly 700 pts, the CAD is up 5 cents and the higher-beta AUD is up 10 cents. Since the October 4, 2011, Key Turn Date (a date that saw a very rare and very powerful Monthly Key Reversal in the DJI) the DJI is up 2,800 points.
Climbing a Wall of Worry: I’ve written about this market “Climbing a Wall of Worry“ and there has been a lot to worry about (isn’t there always a lot to worry about?) One example of the worried investor psychology is the torrent of cash going into the perceived “safe haven” government bonds at lifetime low yields…even while governments are issuing record amounts of debt to cover their deficits…deficits that seem likely to continue for years…what self-respecting bond vigilante could have ever imagined a scenario wherein bond yields were this low while governments issued mountains of paper to fund trillion dollar deficits?
Psychology: Within the last 5 years investors have been hit with crashes in the stock market, the commodity market, and, in the United States, the housing market…it’s no wonder that investor psychology…particularly among the boomers… is now cautious…fretful…perhaps even fearful that the recent stock market gains could be gone in a heartbeat…and thus the rising market is subject to nasty short term breaks as cautious optimism is undercut by the latest wave of fear.
What’s changed? The European financial crisis has probably been the market’s biggest, most immediate worry…it was easy to imagine it spinning out of control with contagion effects clobbering all markets. Rightly or wrongly it seems as though the fear of a European inspired financial panic is diminished…and markets, with the weight of that worry reduced, are able to rise.
Trading: One of the notes taped to my trading screens says, “Are you trading what you think the market should be doing…or what it is doing?” I’ve thought about that a lot lately. It seems impossible to NOT have an opinion about what the market should be doing. When I think back to the times when I stayed with a losing position too long it was almost always because I thought that if I gave the trade a little more time then the market would “wake up” and come around to my point of view…in hindsight, not a good trading strategy!
These days I still have opinions about what the market should be doing…but, if it is not doing what I think it should be doing then I wait…until it does do what I think it should be doing before I make my trade…I anticipate a trade and then wait for a confirmation that the time is right to put on the trade.
I remain long the US stock market indices in my short term trading accounts.

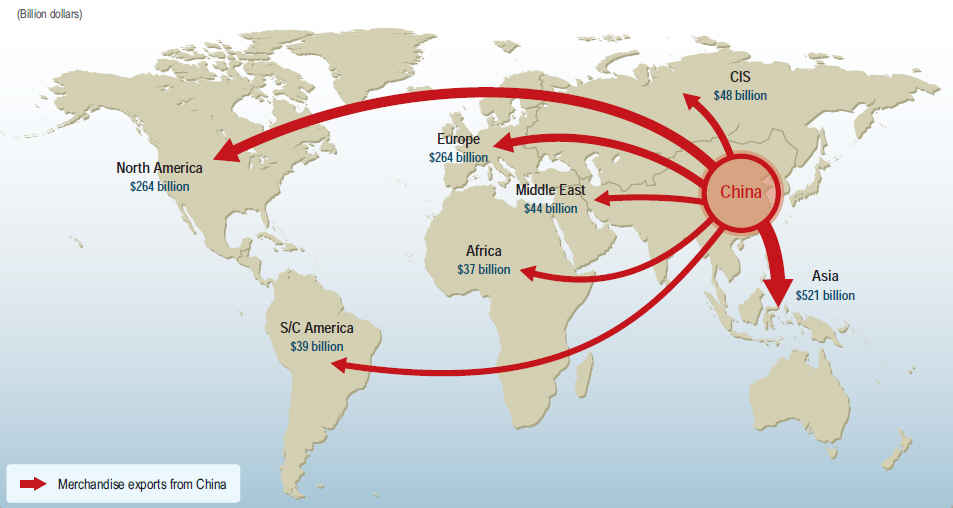
China’s exports slumped in July, as faltering demand from the country’s two biggest foreign customers, the European Union and United States provided further evidence that the global economy is stalling.
Chinese export growth in July dropped to just one per cent compared to the eight per cent expected by a Bloomberg poll of economists, a shocking fall for the world’s largest exporter as the summer draws to a close.
‘Economists are still underestimating the extent of the slowdown’, Sean Darby, chief global equity strategist at Jefferies n Hong Kong told Bloomberg. ‘Things are much, much worse than expected, and this trade data will only get worse in the next quarter. More interest rate cuts will come.’
Policy response
It is the scale and the effectiveness of the Chinese policy response that is now the focus of debate. Can China repeat the massive stimulus of 2008 to beat the slump? And would it work again if it did?
Many now think that China’s central bank will further relax the amount of cash banks must hold as reserves to bolster growth.
“In the very short term, we think Beijing will make one more attempt to revive confidence, with an imminent 50bp reserve requirement ratio cut most likely,” said Ms Yao .
Earlier this month, Korea reported an 8.8pc contraction in July exports and Taiwan’s exports slumped by 11.6pc during the same period.
“Given this backdrop, the 1pc year-on-year from China merely reconfirmed that the severe headwind from the euro zone crisis and the US slowdown is blowing harder,” said Wei Yao at Societe Generale.

According to the Department of Energy, up to 430 billion barrels of recoverable oil lay right here in the United States.
Exactly how much oil is this?
It’s…
- 2x more than all the reserves of Saudi Arabia
- 6x more than Mother Russia
- More than Iraq, Iran, Kuwait, and Canada combined!
All of which makes it even harder to understand why we’re still dependent on any one of these countries for our oil.
The truth is it’s not because of politics… but simply because this oil is too difficult to extract.
You see, most people are surprised to learn that when it comes to crude, oil companies typically recover only the “low-hanging fruit”: just 10% to 20% of the oil in proven reserves.
That’s it. The rest is either too difficult or too costly to extract.
Think about that: Up to 90% of proven oil is simply abandoned by profit-hungry oil companies!
Now just imagine what it would mean if these companies could finally get to all this “leftover” oil.
If only they had the right technology…
If only the right technology even existed…
I’m here to tell you that it does.
What’s more, it’s already being used by some of the biggest oil companies on the planet…
Some of which are using it to increase individual well production by as much as 1000%!
No wonder an analyst with Max Capital Markets wrote:
“The potential for this technology to be adopted by an entire industry is huge.”
Just as another recent technology — horizontal fracturing — has opened up so much natural gas in North America that there’s not even enough room to store it, so too will this new technology unleash billions and billions of barrels of domestic oil.
But first, let me show you the breakthrough technology that could easily allow the United States to triple its oil production almost overnight.
The “Earthquake” Effect
To understand how this technology works, it’s important to realize why it’s so difficult for producers to reach more than 20% of the oil beneath their feet.
To extract the oil, companies inject hundreds of thousands of gallons of water and carbon dioxide into the ground to push it into another well where it can be pumped out.
But instead of acting as one massive wave of pressure throughout the entire formation, water and CO2 flow the path of least resistance, with much of it seeping away into tiny rivers and nooks and crannies in the earth.
The result is that only a fraction of the oil can be recovered before there is nothing left but water and CO2.
Until physicists realized something…
For years, whenever an earthquake hit Alaska, oil production in the Western Canadian Sedimentary Basin soared.
Why?
Well, the closest explanation was that massive waves of energy moving at hundreds of meters a second were bound to break apart rock formations containing oil.
But that posed another question…
What if this same seismic energy could be safely stimulated to extract more oil?
In the late 90s, with oil still at $12 at barrel, one tiny company put this question to the test.
And the answer it came up with was a device so mind-bogglingly simple that it can be used right out of the box!

All oil producers need to do is attach this device to the bottom of a fluid injection string…
Then this “Petro-Pusher” relentlessly pulses water through the ground at speeds of up to 100 meters per second.
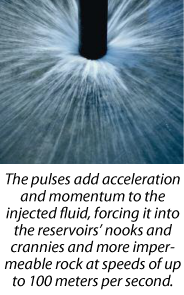
It’s this lightning-fast, nonstop pressure that forces thousands of more barrels of oil to the surface faster thanany other extraction method that has ever existed.
And it’s why, in some cases, the Petro-Pusher has increased individual well production as much as 1,000% — and secondary field recovery by 30% or more…
Last year, Core Energy almost doubled oil production at its carbonate pinnacle reef field from 46 barrels of oil per day (bpd) to 84 bpd…
At a formation in Crane County, TX, production soared 30%…
A Canadian operator in Alberta increased production by 52%…
Another operator based in Calgary increased production by 56%…
Small wonder why the Petro-Pusher is already being used by giants like Chevron, Penn West, Apache, BP, Halliburton, and others at more than 175 wells across North America…
Or why the number of drilling stations equipped with it has soared 3,300% since 2007.
Today, America…
Tomorrow, the World
As exciting as all of this is, it’s just the beginning.
After all, extraction difficulties aren’t just a problem in the United States…
A whopping 65% of all the world’s proven oil reserves are also abandoned.
Now, just imagine what it would mean if companies could suddenly reach this oil.
Well, the folks over at BP don’t have to imagine…
According to a company memo:
The prize in enhancing recovery rates is enormous…
a 5% increase in recovery – a conservative increase thought to be achievable – would yield an additional 300 to 600 billion barrels.
Think about that for a minute…
The United States, the largest consumer of oil on the planet, plows through about 6 billion barrels per year.
Even at the low end of BP’s estimates, you’re looking at one company’s ability to produce enough oil to meet demand for more than 50 years.
And here’s the best part: It can all be done without drilling a single well.
That’s why oil companies are lining up for this technology.
The cost to find, drill, and develop a new oil field can total well over $20 billion.
The rentals on deepwater platforms alone run about a half million dollars per day!
And forget about all the regulatory issues involved with drilling new wells… These wells already exist.
All producers like BP have to do is use the Petro-Pusher at those old wells that still have a wealth of oil just sitting there, waiting to be extracted…
About Energy and Capital
Every day, we publish commentary, research, and investment ideas centered around the end of the oil age and the technologies that will help us make a smooth transition. For more information about the newsletter, check out our frequently asked questions.
Membership also ensures you have every opportunity to join our paid advisory services, which have been helping investors maximize energy profits for years.
You can sign up for the newsletter here.
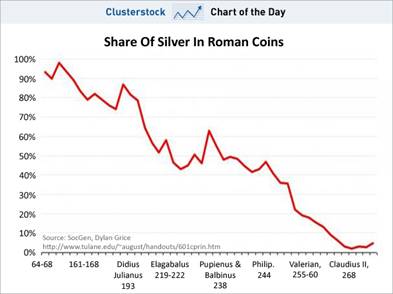
“Debasement was limited at first to one’s own territory. It was then found that one could do better by taking bad coins across the border of neighboring municipalities and exchanging them for good with ignorant common people, bringing back the good coins and debasing them again. More and more mints were established. Debasement accelerated in hyper-fashion until a halt was called after the subsidiary coins became practically worthless, and children played with them in the street, much as recounted in Leo Tolstoy’s short story, Ivan the Fool.” – Charles P. Kindleberger – Manias, Panics, and Crashes
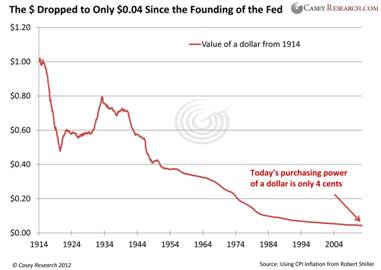
The Holy Roman Empire debased their currency in the early 1600s the old fashioned way, by replacing good coins with bad coins. Any similarities with the U.S. issuing pennies that cost 2.4 cents to produce and nickels that cost 11 cents to produce is purely coincidental. I wonder what the ancient Greeks would think of our Olympic gold medals that contain 1.34% gold. The authorities have become much more sophisticated in the last one hundred years. Digital dollars are so much easier to debase. The hundred year central banker scientifically manufactured bust relentlessly plods towards its ultimate conclusion – the dollar reaching its intrinsic value of zero.
“It is well enough that people of the nation do not understand our banking and monetary system, for if they did, I believe there would be a revolution before tomorrow morning.” – Henry Ford
Henry Ford made this statement decades before the debasement of our currency entered overdrive. The facts reflected in the chart above should have provoked a revolution, but the ruling class has done a magnificent job of ensuring the mathematical ignorance of the masses through government education, mass media propaganda, and statistical manipulation of inflation data to obscure the truth. Mainstream economists have successfully convinced the average American that inflation is good for their lives and deflation is dangerous to their wellbeing. There are economists like Kindleberger, Shiller and Roubini who have brilliantly documented and predicted various bubbles, despite being scorned a ridiculed by the captured mouthpieces for the oligarchs. But even these fine men have a flaw in their thinking. They can see speculative manias spurred by irrational beliefs and delusional thinking, but are blind to the evil manipulations of bankers, politicians, and corporate titans. They believe that humans with Ivy League educations can outsmart markets and through the fine tuning of interest rates, manipulation of the money supply and provision of liquidity through a lender of last resort, can control the financial system and avoid panics.
……read much more HERE

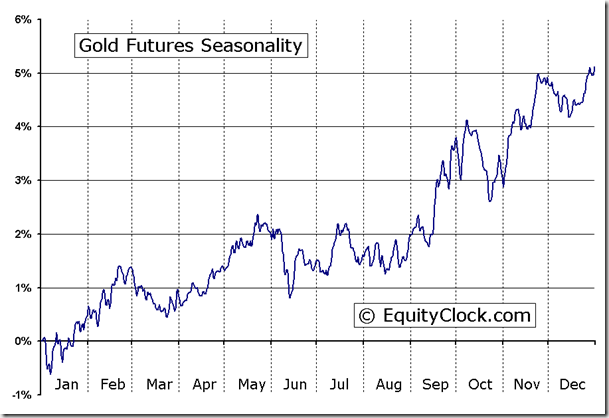
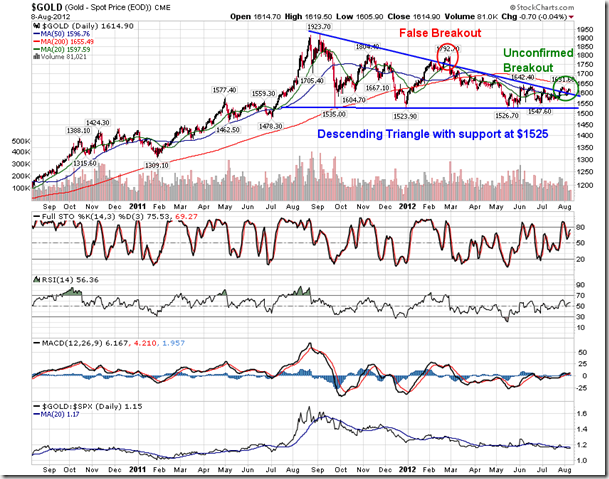
With Europe in Financial Crisis, the US Debt soaked and struggling economically, the biggest influence on gold prices right now is the expectation towards more monetary easing, either out of Europe or the U.S. That’s the No. 1 driver. For Gold investors this happily coincides with Equity Clock’s seasonal and technical studies which clearly show that Gold typically embarks on a significant upward swing during the month of August. Furthermore, as the second chart shows that Gold in US Dollar Terms is not only down 16% from its high, it is breaking out of a yearlong descendng triangle, typically a reliable technical indicator.
Gold Mining issues outperformed this week too, as another indication that this rally is getting underway. The GDX is up 4% so far and the GDXJ is up 4.5%.

One interesting facet is that Silver is in Backwardation. Backwardation occurs when the future price of a commodity (gold, silver, oil, corn, etc.) is less than the current spot price. In other words, the price you pay now is higher than the price you have the option of paying a month later. . .two months later. . .or a year later.” The result, according to Brian Hicks of Wealth Daily, is “Historically backwardation means one of two things:
1) there’s a current shortage of silver bullion available on the open market and/or
2) silver traders believe the price of silver is about to take off.” Hicks continues, “Basically it means that there are relatively few silver owners that are willing to sell their bullion holdings. As a result of this tight supply, there’s an increasing amount of demand for bullion that is jacking-up the current spot price of silver. And that’s the significance of backwardation. The current spot price of silver is an accurate record of the real spot price of physical silver as long as people are willing to exchange currency for silver at that price, which is why backwardation is so important.”
James Turk pointed out in an interview with King World News that gold may also be in backwardation. Turk says, “I think it is, even though the gold forward rate doesn’t show it simply because dollar interest rates are manipulated. I think to a large extent gold interest rates can’t be manipulated any more than they have been. So the true reflection of the market is you have a backwardation, but it’s not obvious because of the various interest rate manipulations that are going on. That’s very bullish. Whenever you get the metals in backwardation it’s a very bullish situation. I” I think that’s what we’ve got right here.” Turk also commented, “The bottom line is we are in a fiat currency bubble. Eventually this bubble is going to pop because we are using this fiat currency, backed by nothing, not just in one country, but throughout the world”.
John Embry of Sprott Asset Management says that the next big move in gold may be the result of supply more than demand. He told King World News, “I have been a long time proponent of the idea that we may very well be at peak gold production in the world. We may have seen the peak. The problem is that all of the low hanging fruit has long since been plucked. The high grade ore bodies in geopolitically (friendly) places have (already) been mined and a lot of these open pits have been mined. And they (open pits) have a very finite life. Underground mines last forever (by comparison). But the fact is all of the easy stuff has been mined and where you are now finding anything of significance, it tends to be in geopolitically unattractive areas. They are hard to mine and they are going to be extraordinarily expensive to mine… I don’t worry too much about the fact that the production profile can’t grow that much because ultimately that will be extremely bullish for the gold price. This is a classic supply/demand squeeze. We know that demand is rising in many parts of the world… If there is no greater amount of gold coming out of the ground, the only thing that can arbitrate where the gold goes is price, and the price will go up a lot. I think the gold price could go up to multiples of the current price.” Embry is even more bullish on silver: “I have been of the long held opinion that if we get into a raging bull market, which we are going to in the two precious metals, that silver will head towards the low end of the gold/silver ratio, which is currently over 50. In real bull markets, it will fall as low as 10 or 15 (to 1). If that happens, silver will move up three times as fast as gold by the time this is all over. And I think gold is going a long ways, so you can get really excited about the upside potential in silver.”
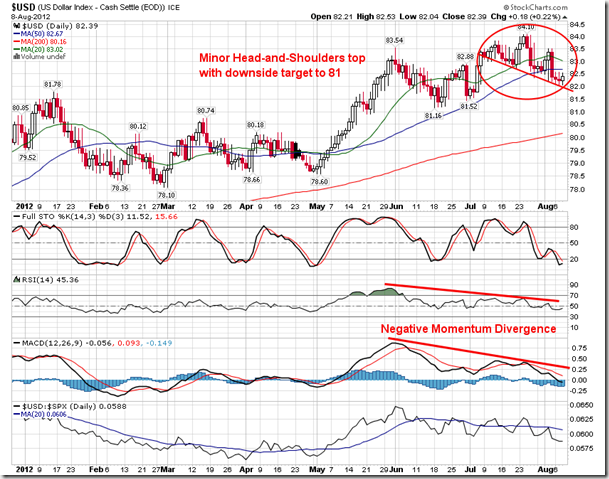
The Bottom Line? The framework for a strong move higher in Gold has become established. In addition to increased inflation expectations, the US Dollar index has also come under pressure over the course of the past month and a minor head-and-shoulders top can be spotted on the charts. The target of this topping pattern points down to 81, also the point at which the price action would intersect with the rising intermediate trendline. As you can see in Equity Clocks Seasonality Chart below, the US Dollar Index seasonally declines, on average, between now and September, supporting commodity prices, such as Gold.


-
I know Mike is a very solid investor and respect his opinions very much. So if he says pay attention to this or that - I will.
~ Dale G.
-
I've started managing my own investments so view Michael's site as a one-stop shop from which to get information and perspectives.
~ Dave E.
-
Michael offers easy reading, honest, common sense information that anyone can use in a practical manner.
~ der_al.
-
A sane voice in a scrambled investment world.
~ Ed R.
Inside Edge Pro Contributors

Greg Weldon

Josef Schachter

Tyler Bollhorn

Ryan Irvine

Paul Beattie

Martin Straith

Patrick Ceresna

Mark Leibovit

James Thorne

Victor Adair