
Timing & trends
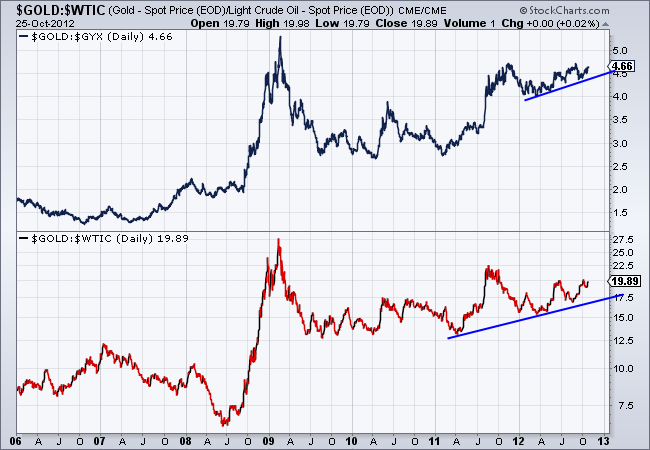
Longtime readers know that we are a fan of intermarket analysis. The movement of certain markets influences other markets so it is always wise to analyze a handful of markets rather than just a single market by itself. Several years ago we learned from others before us how intermarket analysis can help us get a handle on the margins of gold (and silver) miners. Generally, Oil (energy) represents about 25% of the cost of mining while industrial metals prices can be a proxy for the costs of trucks, chemicals and blasting agents (like cyanide). It has been a while since we’ve looked at these charts but with the gold stocks having put in a major bottom it is time to analyze whether it is sustainable or not.
Simply put, we look at Gold relative to oil (bottom) and Gold relative to industrial metals (top). These ratios were quite low in 2007 when share prices were driven more so by positive sentiment and high valuations then by positive fundamentals. As you can see, the financial crisis was a major catalyst for the gold mining industry. Gold surged against oil and industrial metals. During the weak recovery these ratios held their ground and are reaching higher levels once again.
Next, we want to look at these markets by themselves. Industrial metals prices are on top while oil is on the bottom. Do these markets appear to be any threat to move much higher? Industrial metals have substantial resistance at 500 and have made obvious lower highs and lower highs in the past year. GYX is threatening a move below 350. Oil has also made lower lows and appears far more likely to test $78-$80 then to rebound above $95.
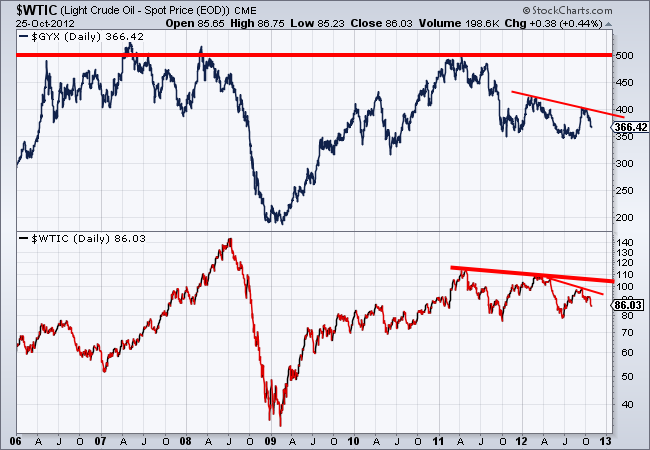
Meanwhile, Gold continues to hold up quite well within a consolidation. Predictably, its rebound ended at $1800. Yet, the market has a very strong bottom in place and has good support just below $1700.

As you can see, according to this simple straightforward analysis, Gold mining margins should continue to expand. The commodities that represent mining cost inputs are not only trending bearish but are little threat to move much higher anytime soon. Meanwhile, Gold is trading in a healthy range and once it breaks $1800 will be within a month or two of breaking to a new all time high.
In the early years of the boom, gold stocks performed quite well even as cost inputs surged. The reason was the market was willing to pay more and more for gold stocks. Presently we have a very different situation. The fundamentals for gold producers are improving yet the market is attaching low valuations to these companies. Our view is that if Gold breaks to and sustains a new high then the current valuations of these companies will increase materially.
All this being said, it is important to understand that gold mining is an extremely difficult industry. Despite this positive analysis, a fair portion of the industry will struggle. It is geologically and mathematically impossible for major producers to grow consistently. Small miners often lack the expertise and manpower to be successful. Most are aware of the 80-20 rule. We just returned from a tour of one of the best producer’s projects. We heard that this management team believes in the 95-5 rule. In other words, in the gold mining industry, 5% of the people produce 95% of the profits. You should keep this in mind when evaluating producers and potential producers. This is also why we focus on stock selection. In this sector, it is crucial to achieving great returns. If you’d be interested in professional guidance in uncovering the producers and explorers poised for big gains then we invite you to learn more about our service.
Good Luck!
Jordan Roy-Byrne, CMT
Jordan@TheDailyGold.com

Today’s chart illustrates the price to earnings ratio (PE ratio) from 1900 to present. Generally speaking, when the PE ratio is high, stocks are considered to be expensive. When the PE ratio is low, stocks are considered to be inexpensive. From 1900 into the mid-1990s, the PE ratio tended to peak in the low to mid-20s (red line) and trough somewhere around seven (green line). The price investors were willing to pay for a dollar of earnings increased during the dot-com boom (late 1990s), surged even higher during the dot-com bust (early 2000s), and spiked to extraordinary levels during the financial crisis (late 2000s). Since the early 2000s, the PE ratio has been trending lower with the very significant but relatively brief exception that was the financial crisis. More recently, the PE ratio has moved slightly higher. It is worth noting, however, that even with this recent uptick, the PE ratio still remains at a level not often seen since 1990.

Quote of the Day
“I conceive that the great part of the miseries of mankind are brought upon them by false estimates they have made of the value of things.” – Benjamin Franklin
Stocks of the Day
Find out which stocks investors are focused on with the most active stocks today.
Which stocks are making big money? Find out with the biggest stock gainers today.
What are the largest companies? Find out with the largest companies by market cap.
Which stocks are the biggest dividend payers? Find out with the highest dividend paying stocks.
Notes:
Where’s the Dow headed? The answer may surprise you. Find out right now with the exclusive & Barron’s recommended charts of Chart of the Day Plus.
Corportate Revenues Plunge.
The Eurozone meltdown has sent capital pouring into (temporarily) safe haven currencies like the US dollar, which rose by nearly 12% between October 2011 and August 2012.

This sounds like a good thing for the US but it’s not, because US multinationals lose big when the dollar pops. Assume, for example, that you’re making computers in California and selling them to Germany, and the dollar goes up by 10%. Suddenly your computers are 10% more expensive, which makes it hard to sell as many as you expected. And those that you do sell are paid for with euros, which are now worth 10% less than they were a few months ago. When you convert those euros to dollars in order to pay your bills, your revenues are 10% lower than they should be. Your costs, meanwhile, are mostly in dollars, so your profit ends up being far lower than you expected.
Now combine this margin squeeze with an order slowdown in Europe and China, and extend it to the whole S&P 500 and you get the following:
…..read more HERE

GOLD TRADING in London – heart of the world’s wholesale bullion market – leapt in September.
“The continued economic uncertainty in the Eurozone and US, the end of the holiday period and the start of the Indian festival season boosted clearing turnover,” says trade body the London Bullion Market Association, releasing the new data to members on Thursday.
But matched by a sharp rise in the size of gold-backed trust funds traded on the stock market (ETFs), these latest figures really suggest strong interest from hedge funds, investment banks and other institutions around the US Federal Reserve’s announcement of QE3, we believe.
Why QE3 as the catalyst? Because the so-called “smart money” had been hanging on Ben Bernanke’s every word all year…willing him to make free and easy with his electronic printing press once again. And why that group? Because the other potential buyers just weren’t so hot – buyers whose demand would have quickly registered back up the supply chain at the wholesale level – and certainly not hot enough to push Gold Trading through its world center in London to the third highest value on record.
Jewelry suppliers in India have kept a lid on their stockpiling, even ahead of the annual peak in demand due with Diwali in mid-November. Private households (aka “retail” investors) raised their demand in September, but not dramatically, as Bullion Vault’s own Gold Investor Index shows. And amongst those central banks who declare their hand each month to the International Monetary Fund (ie, everyone but China), September 2012 saw them pretty much flat overall as a group.
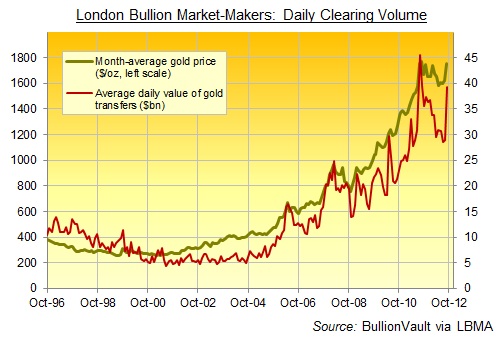
So you have to guess, therefore, that the so-called “smart money” was the big buyer, helping drive the daily value of Gold Bullion traded through London’s 11 big market makers more than 35% higher in September from August to its highest level since summer 2011’s all-time peaks.
Those 11 market makers – led by global investment-bank and London vault operators HSBC and J.P.Morgan, and all guaranteeing to quote firm Gold Buying and selling prices throughout the day – shifted some $39.2 billion-worth of gold between them on average each day last month. Make a guess at all of September’s other Gold Trading done via smaller bullion banks and dealers, all still quoting prices for settlement in London’s secure and accredited vaults, and the total could have reached to $350bn. That’s the multple suggested by spring 2011’s market-wide survey, undertaken by the London Bullion Market Association on behalf of the World Gold Council.
The aim of that report, in which the LBMA surveyed all its members, was to gauge the true depth and liquidity of the physical gold market. The previous best guess-timate – of a multiple between 3 and 5 times the average daily turnover reported by the big 11 banks – now looks it should stand nearer 8 times. Especially when Gold Trading gets hot, as it clearly did in September.
Some of that hot money has turned tail since. This month’s pullback so far has taken Dollar-gold 4% lower to $1700 per ounce. Perhaps hedge funds, bank traders and other private institutions simply booked early profits off their September Gold Trading. Or perhaps they’re disappointed that QE3 didn’t instantly send inflation soaring.
Give it time. “There is a great deal of ruin in a nation,” as Adam Smith calmly replied when told in October 1777 that Britain was ruined by its defeat by the American rebels at Saratoga. It took another 170 years for the British Empire to crest and collapse. Today’s limitless zero-rate money won’t have long.
Looking to Buy Gold or physical Silver Bullion today…?
Adrian Ash runs the research desk at BullionVault, the physical gold and silver market for private investors online. Formerly head of editorial at London’s top publisher of private-investment advice, he was City correspondent for The Daily Reckoning from 2003 to 2008, and is now a regular contributor to many leading analysis sites including Forbes and a regular guest on BBC national and international radio and television news. Adrian’s views on the gold market have been sought by the Financial Times and Economistmagazine in London; CNBC, Bloomberg and TheStreet.com in New York; Germany’sDer Stern and FT Deutschland; Italy’s Il Sole 24 Ore, and many other respected finance publications.
 Why houses/condos may fall in value but apartment buildings do not.
There is a common misperception that all real estate classes are created equal. House prices are falling in some cities in Canada, primarily because the rules to get mortgages have changed, such as increased debt-coverage ratios, higher down payments and shorter amortization. This allowed our Finance Minister Hon. Jim Flaherty to tighten consumer debt without raising interest rates! This leads some to believe that those (modestly) falling house prices will also affect other real estate classes, such as apartment buildings. Nothing could be further from the truth.
With the tightening of mortgages for single family units more people chose to rent, or longer; thus lowering vacancies and driving up rents and rental property values – an unintended, but expected consequence. If you look across our portfolio you will see higher rents and lower vacancies across the board compared to 2 or even one year ago. Thank you, Jim Flaherty!
An asset we bought in Dec. 2010 went from $14.65M to close to $20M not even 2 years later. This translates into a price of about 160,000’s per unit, up from the 120’s when we bought it less than two years ago. That’s a great cash-on-cash ROI on the roughly $5M cash invested into this asset that is co-owned by two of our LPs: PRISM A and one still open for investment, Kings Castle LP.
To get a perspective on what is going on, lets use the example of a typical young married couple in Calgary. They can rent a nice 900 sq ft two bedroom unit with a balcony in one of our three storey walkup buildings for $1200, or so. Or they could spend a bit more, say $1500, and rent a nicer, newer, yet often smaller 850 sq ft two bedroom downtown condo. Alternatively they could buy that brand new condo for perhaps $300,000. Let’s do the math: 5% down: $15,000 – no problem. New mortgage of $285,000 at 2.99% plus CHMC fees = $295,000, amortized over 25 years : $1410/month plus condo fees of 30 cents a foot or $250, property taxes of $140 plus $50 insurance = $1850. So, more expensive per month to own that same condo with $15,000 invested with no guarantee for future upside for a while. Hmmm honey .. let’s rent a while longer. That discussion is happening in tens of thousands of rental apartments across the country, and people stay put longer. Moreover that doesn’t even allow for folks who move to booming cities like Edmonton, Red Deer or Calgary. So you can see why rents have rocketed upwards lately.
In the run up to the boom, with rising prices, buying new was a no-brainer and people would opt to buy rather than rent due to sizable equity upside. Not such a no-brainer anymore. Construction is slowing too as investors don’t get a decent yield, especially true in booming Alberta with construction costs also on the rise .
Result: low low vacancies and rising rents. To the point, a few short years into the future, if rents in our assets are up another $250 or so and interest rates remain the same the math will make sense to buy again. Then again if interest rates move higher .. even a slight 1% rise from 3% to 4%, it would increase the monthly mortgage payment by almost $200 to own that condo. So renting could well be en vogue for a while, just like it is where I used to live in Europe where roughly 50% of the population rents [Canada is still only about 35%].
What does this mean for an investor if rents go up $250, roughly a 20% sizable increase over the current rent of $1200? If rents rise 20% values of the underlying asset go up roughly 20% too. However, lets say you only put 40% down and mortgaged the rest at super low rates of 3%? A 20% upside is a 50% ROI on your cash invested, so this makes investments in rental real estate such a powerful investment even in a flat (or declining) condo/house market!
Further market analysis: Sub 100/door in any major city in AB is usually garbage unless you get lucky. We’re buying an asset in a B area in B condition for high 90’s/door next month in Kings Castle LP with the cash at hand. Little decent inventory around but still far better cash-on-cash return with lower risk than the stock market, and higher than bonds.
An asset we bought for 30’s/door in Fox Creek, AB in 2005 and sold for 70’s/door in 2007 with a triple digit cash-on-cash ROI is now listed in the 80’s/door .. in a town of not even 2500 people halfway between Edmonton and Grand Prairie.
CAP rates in Vancouver are around 4%, or lower even. A building that just sold in Kitsilano, for example, sold for 28 times annual rent .. twice what you’d pay in Edmonton .. say 12-14 .. CAP rates in Calgary are around 5%, and in Edmonton 5.5% to sub 6%, similar to Burnaby, New Westminster or N-Vancouver.
Many good condition assets or in good locations are not for sale or below that CAP rate in the 130-150/door in Edmonton, the 165 to 200/door range in Calgary, or 250+ in Greater Vancouver.
Everyone (like insurance companies, pension funds, REITs, high net worth individuals, retirees, ..) is scrambling for decent, sustainable, long term yields with low risk, apartment buildings in good locations that are impeccably managed. Provide that!
I expect CAP rates to drop further, Calgary to around 4% and Edmonton to 5%, as interest rates will stay low for a while. Long term CMHC insured money is at 2.4%, without CMHC at around 3%. So, it makes sense to borrow and buy an asset with a yield that is 50-70% higher (i.e. 4 to 6%).
I am not too familiar with GTA, Ottawa, Winnipeg or Halifax, but quality assets are there also between 5 and 6% CAP rates, about a percent higher in dubious locations.
If an asset in Edmonton that is valued today at $5M with an net operating income of $300,000 and thus, is valued using a 6% CAP rate, what would happen if the CAP rate drops to 5.5% or even 5% ? It means that this asset is now valued at $5.5 or even $6M ($300,000/0.05). Couple this with expected rent increases and you can see how the Calgary asset improved so drastically in value with rents up over 15% in 2 years along with a CAP rate drop.
We also expect interest rates to continue to stay low for quite some time, as democracies around the world try to shed their debt. As this is tougher than deflating the currency through quantitative easing, i.e. creating more borrowing capacities by their respective central banks, politicians pick the easy route.
Thus, it continues to make sense to borrow money cheaply at 2.5% to 3% and invest it at 4-6% or 50-70% higher! This is what we do, and have become experts at, in rental apartment buildings, in growth markets, in decent locations, impeccably managed, sensibly levered with cheap and widely available money. It’s like owning gold .. with a yield !
Care to join us ?
Sincerely and successful investing,
Thomas Beyer, President
Prestigious Properties Group
T: 403-678-3330 www.prestprop.com
P.S.: This LP is currently open for investment (in larger amounts only for non-residents via a PrestProp holding company to avoid these annual withholding tax issues) with optional 5% cash-flow and equity growth, with a verified target ROI of around 10%/year.
P.P.S.: I love Europe, which I visited in September, as a vacation destination, but not as an investment environment for stocks, real estate nor debt. Canadian land or apartment building investments make far more sense as we have decent GDP growth, huge natural resources the world wants and needs, immigration, job growth, high quality of living standards, low debt and low deficits, especially in Alberta with a baby boom. With an NDP looming in BC in 2013 and high deficit & high electricity rate Ontario we will not invest in these provinces at the moment and carefully divest or maintain a position at best.
Follow our latest news on Facebook or follow us on http://twitter.com/prestprop.
Legal Disclaimer: This email is not a solicitation for investments nor financial or investment advice. Not a guaranteed return. You could lose all money you invest. Investments are sold via offering memorandum only, to eligible investors, via Exempt Market Dealers who are registered to give financial advise.

-
I know Mike is a very solid investor and respect his opinions very much. So if he says pay attention to this or that - I will.
~ Dale G.
-
I've started managing my own investments so view Michael's site as a one-stop shop from which to get information and perspectives.
~ Dave E.
-
Michael offers easy reading, honest, common sense information that anyone can use in a practical manner.
~ der_al.
-
A sane voice in a scrambled investment world.
~ Ed R.
Inside Edge Pro Contributors

Greg Weldon

Josef Schachter

Tyler Bollhorn

Ryan Irvine

Paul Beattie

Martin Straith

Patrick Ceresna

Mark Leibovit

James Thorne

Victor Adair