
Personal Finance
Vancouver, Calgary and Toronto Detached Housing Priced in Gold:
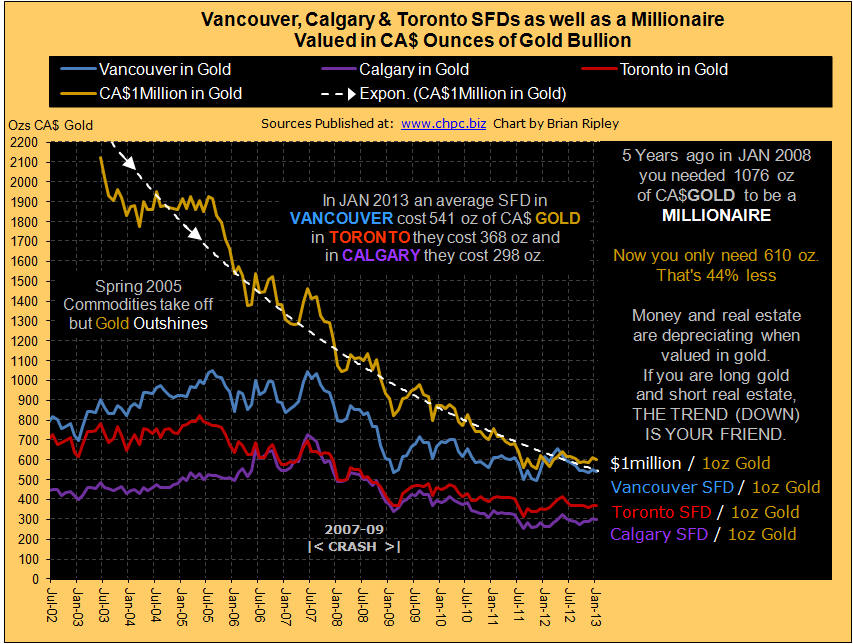
The chart above shows Vancouver, Calgary and Toronto detached housing priced in ounces of gold valued in CA$. Gold mining share prices rise as the “real price” of gold rises eg: the Gold/Commodities Ratio because the commodity cost (fuel, materials, equipment) is falling against the nominal price. See the Homestake Mining Chart from 1924 to 1935. Bullion attracts investment when credit markets contract because of its classic use as a hedge against currency depreciation and its ability to act as money.
The Millionaire Metric allows you to see what your dollar is worth and the (declining) amount of gold you need to be a millionaire. In January 2013 the spot price of gold continued trending in the middle of a channel base that has been established since last summer. It requires 44% less gold now to be a millionaire than 5 years ago. See also the GOLD/CRB ratio here.
Ratios of Gold, Commodities and TSX Real Estate – The Real Price
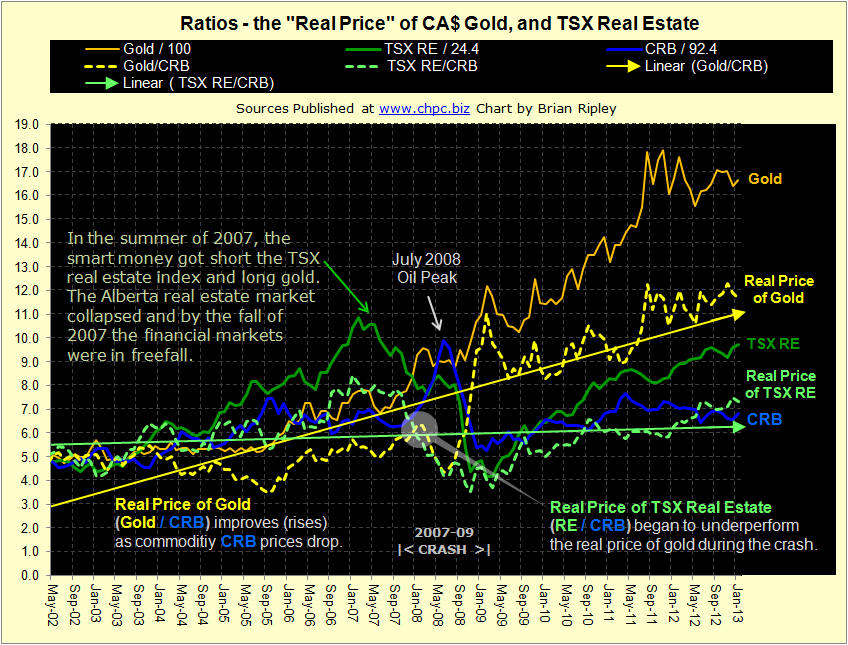
The chart above shows the “Real” price of gold (Gold/CRB) and the real price of real estate (RE/CRB). Gold miner’s profitability depends on the nominal price of gold and the cost of getting the metal out of the ground. When the cost (fuel, and industrial materials) goes down, the real price rises even in the absence of a nominal price rise. Housing is a bundled commodity (lumber, steel, copper, materials, fuel to get to the site) and the TSX-RE/CRB ratio (green dotted line) plunged with the spike in oil prices in 2008 as did the real price of gold (dotted yellow line). But by the end of the 2007-09 crash the real price of gold zoomed with the BoC ZIRP policy and the real price of TSX real estate rallied but on a much more subdued trend; gold has been outperforming since. As of January 2013 gold continues to trade sideways since the summer of 2011 but above its 6 year trend line. The CRB has been drifting down since the secondary April 2011 high and failed retest of the $147/barrel oil spike of July 2008. A falling CRB is excellent for gold miners and ultimately good for long term house buyers as the replacement value for real estate falls with the CRB. The TSX RE Index rally has been offset with an uptick in the CRB which has moved the real price (TSX-RE/CRB) down creating a near by double top test of the 2006-2007 highs. Stay tuned.
….for 10 more Real Estate Charts go HERE

Investors Are More Bullish Than In 99% Of All Periods Since 2002.
According to the firm’s Bull & Bear Index, which tracks sentiment using indicators like hedge fund market exposure, fund flows, long-only investor positioning and so forth, investors are more bullish than they were in 99% of periods since 2002.
The current B&B reading is 9.6 (on a scale of 0 for max bearish and 10 for max bullish). It suggests investor sentiment is currently more bullish than 99% of all readings since 2002. Extreme bullishness is characterized by robust inflows to EM equity funds, overbought high-yield credit markets relative to treasuries and aggressive hedge fund positions for a weaker yen and stronger oil prices.

What’s even worse. This extreme surge in bullishness comes even as there’s been a breakdown of late in the economic data, as measured by the BofA/ML Economic Surprise Index.

Thus bulls should have reason to worry. Everyone is bullish, and lately he data isn’t holding up so hot, relative to expectations.
In the meantime, the moment of truth for the economy approaches: HERE
JAPANESE STOCKS SOAR AFTER TWO-DECADE DROP
Japan’s stock market has taken off, with the Nikkei Stock Average soaring more than 30 percent since Nov. 14 to a four-year high.

That ascent follows just a brief little 22-year decline.

In fact, investors have poured money into Japan equity funds in 10 of the last 12 weeks, according to EPFR Global data cited by The Journal. Net inflows totaled $3.09 billion during the perio
The rise has come amid optimism over new Prime Minister Shinzo Abe’s economic stimulus plans.
They include a weaker yen, which is boosting the fortune of Japan’s big exporters like Sony, Panasonic and Toyota. A falling currency helps a country’s exports by making them cheaper in foreign currency terms.
Goldman Sachs analysts figure that Japanese exporters’ profit rise 7 to 10 percent for every 10 yen that the dollar rises, The Wall Street Journal reports.
The dollar hit a 2 ½-year high of 94.06 yen this week.
“The stock story has mostly been a yen-driven phenomenon, no question,” Naoki Fujiwara, a fund manager at Shinkin Asset Management, tells The Journal. “Some investors are finding that they can’t afford to remain on the sidelines.”
Lorne Steinberg, chief executive of Lorne Steinberg Wealth Management in Montreal, believes the market will keep rising. “We could be looking at a two-to-three year equity market rally,” he says.
Construction companies have registered the highest risk-adjusted return among Japanese stocks since an earthquake and tsunami hit the country on March 10, 2011, according to Bloomberg.
“Public works investment will be robust in the long term when you consider the government’s plan to strengthen infrastructure,” Masaru Hamasaki, chief strategist at Toyota Asset Management, tells Bloomberg.
“That’s highly likely to give construction companies a stable revenue source.”
However, Japan’s public debt is more than twice the size of the economy.
“You can’t keep expanding public works when you think about Japan’s fiscal situation,” Isao Kubo, a Tokyo-based equity strategist at Nissay Asset Management, tells Bloomberg. “There’s been support for construction stocks since the earthquake, but I don’t think it will last long.”
Money News: The ‘Unthinkable’ Could Happen — Wall Street Journal. Prepare for Meltdown

 Gold: Descending Triangle, Watch Out Below – Maybe
HAC does not own any gold, but I am commenting on the sector at this time because of its relationship to silver. In previous newsletters I have stated that silver is a much better seasonal investment than gold at this time of the year, despite both being precious metals. This has proven to be the case this year.
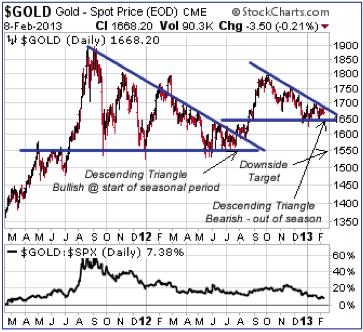
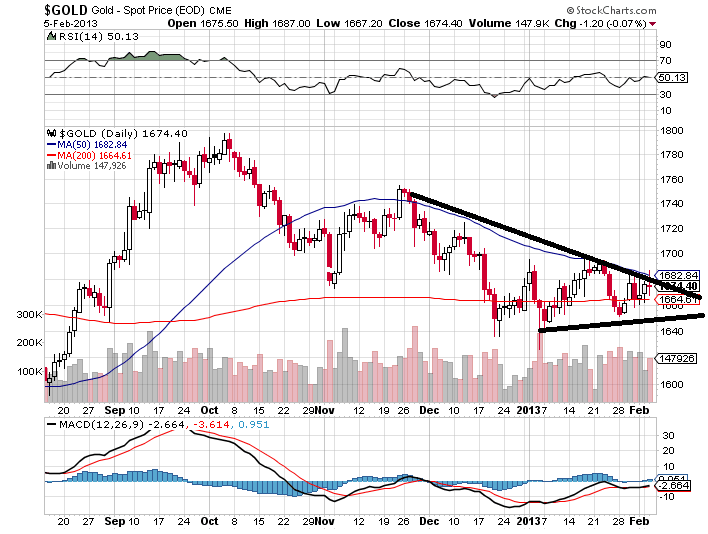
In general, the precious metals group moves up and down together, with different metals outperforming at different times. If gold has a major breakdown in price it would be expected that silver would echo its performance, or vice versa. Currently, gold has been putting in a bearish performance, and has once again formed a descending triangle. Investors should be concerned about this pattern at this time.
Some readers may challenge me on this, as I stated that gold was a strong buy back in July when it had formed exactly the same pattern. To be absolutely clear, I stated that a descending triangle is NOT bearish at the start of a strong seasonal period. Most descending triangles are resolved to the upside when they occur at the start of a seasonal period.
On the other hand, when a descending triangle is formed “out of season,” this is considered bearish as most of these patterns are resolved to the downside. Gold is currently in a bearish descending triangle and if this pattern is bro- ken to the downside, the target level for gold is $1550. If it does have a large drop, it is inevitable that silver will follow suit, despite still being in its strong seasonal pe- riod. Investors should be watching gold’s support level of $1650, which is below its 50 and 200 day moving aver- ages. If this level is broken, investors should be watch- ing silver for a similar breakdown. The support level for silver is $30. If this level is broken, investors should con- sider exiting the silver trade early, despite the seasonal period end date of March 31st.
Just because gold is in a bearish descending triangle pat- tern does not mean that it is going lower. It is possible for it to move higher, but the odds support a move lower.
Silver- Doing well, be careful, but don’t write it off yet
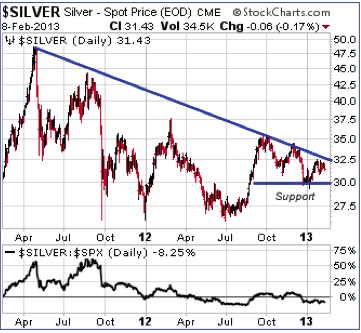 Despite giving breakdown levels for gold and silver in the above commentary, silver has performed well so far and it still may have a strong run. Silver is part precious metal and part industrial metal. If the base metals start to pick up this should provide a boost to silver.
Ed Note: Much more in Brooke’s FREE Monthly “Thackray Market Letter which can be accessed HERE
Disclaimer: Brooke Thackray is a research analyst for Horizons Management Inc. All of the views expressed herein are the personal views of the author and are not necessarily the views of Horizons Management Inc., although any of the recommendations found herein may be reflected in positions or transactions in the various client portfolios managed by Horizons Investment Management Inc. HAC buys and sells of securities listed in this newsletter are meant to highlight investment strategies for educational purposes only. The list of buys and sells does not include all the transactions undertaken by the fund.
While the writer of this newsletter has used his best efforts in preparing this publication, no warranty with respect to the accuracy or completeness is given. The information presented is for educational purposes and is not investment advice. Historical results do not guarantee future results
Mailing List Policy: We do not give or rent out subscriber’s email addresses. Subscribe to the Thackray Market Letter: To subscribe please visit alphamountain.com. Unsubscribe: If you wish to unsubscribe from the Thackray Market Letter please visit alphamountain.com. Contact: For further information send an email to brooke.thackray@alphamountain.com
Continuing strength in equity markets has provided an opportunity to take profits on strength on a wide variety of seasonal trades (e.g. agriculture, technology, biotech) and to rotate into other sectors that have a history of outperformance during the February to April period (e.g. energy, platinum, silver, copper, retail).
(You can listen to Mike’s Interview of Don Vialoux Feb 9th on Money Talks HERE)
Equity Trends
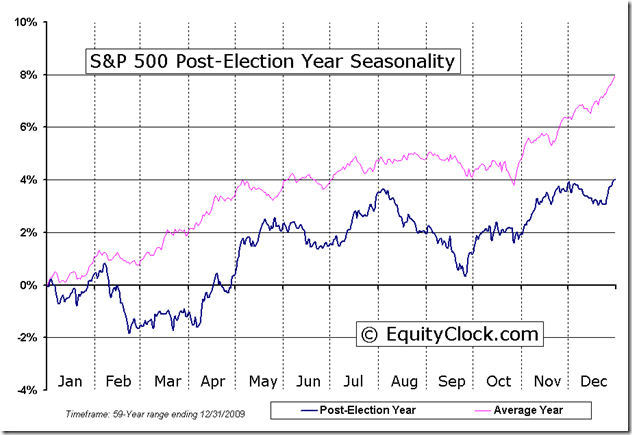
History shows that U.S. equity markets in the year after a Presidential election move higher until the end of the first week in February weaken thereafter until the end of March and move higher thereafter. Given political events scheduled in the U.S. during the next two months, history is about to repeat.
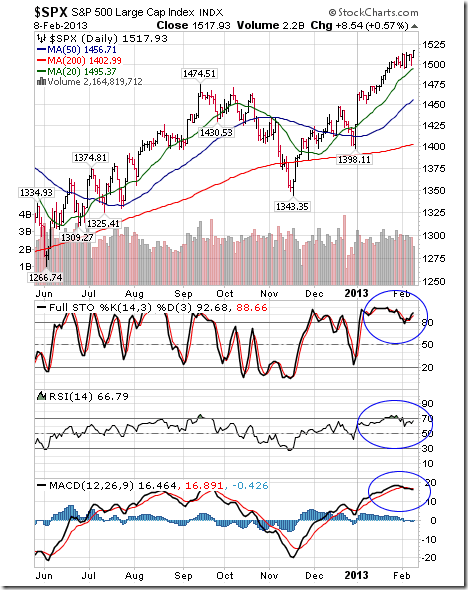
The S&P 500 Index gained 4.76 points (0.31%) last week. An intermediate uptrend was confirmed when the Index closed at a 5 year high. The Index remains above its 20, 50 and 200 day moving averages. Short term momentum indicators remain overbought.
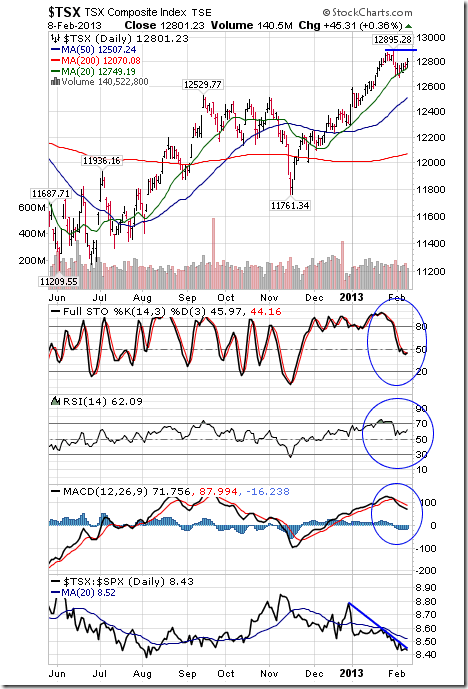
The TSX Composite Index improved 32.40 points (0.25%) last week. Intermediate trend is up. Resistance is forming at 12,895.28. The Index remains above its 20, 50 and 200 day moving averages. Strength relative to the S&P 500 Index remains negative. Short term momentum indicators have rolled over from overbought.
Currencies
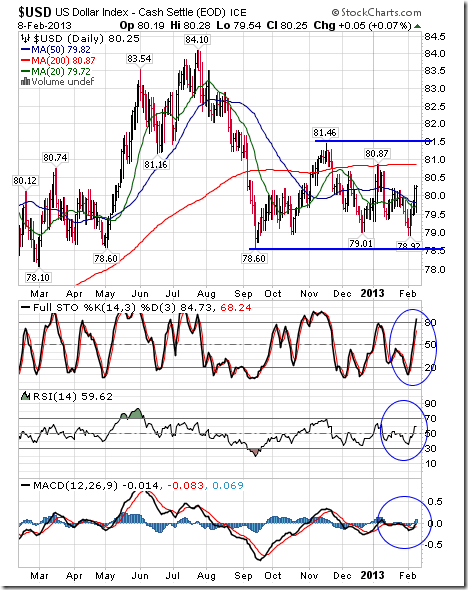
The U.S. Dollar gained 1.12 (1.42%) last week. The Dollar moved above its 20 and 50 day moving averages. Short term momentum indicators are trending up.
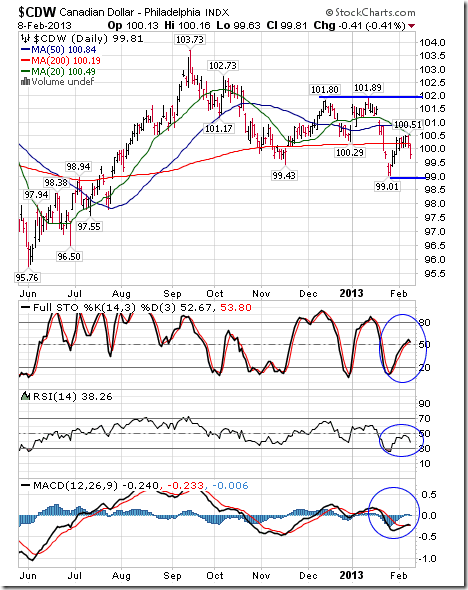
The Canadian Dollar fell 0.48 cents U.S. (0.48%) last week on strength in the U.S. Dollar. The Canuck Buck remains below its 20 and 50 day moving averages and fell below its 200 day moving average on Friday. Short term momentum indicators are neutral.
Commodities
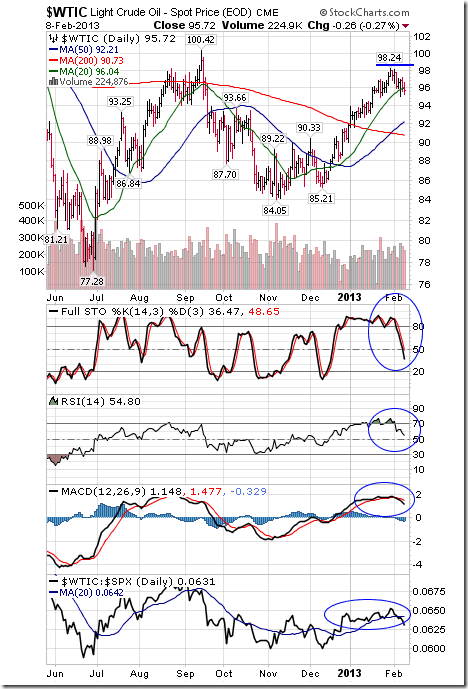
Crude Oil fell $2.05 per barrel (2.10%) last week. Intermediate trend is up. Resistance is forming at $98.24. Crude remains above its 50 and 200 day moving averages, but fell below its 20 day moving average on Friday. Strength relative to the S&P 500 Index changed from positive to neutral. Short term momentum indicators have rolled over and are trending down.
Gold slipped $3.70 per ounce (0.22%) last week. Intermediate trend is neutral. Support is at $1.626.00 and resistance is at $1,697.80. Gold remains above its 200 day moving average and below its 20 and 50 day moving averages. Strength relative to the S&P 500 Index remains negative. Short term momentum indicators are neutral.
…..read more and view 45 charts HERE

Japan’s stock market has taken off, with the Nikkei Stock Average soaring more than 30 percent since Nov. 14 to a four-year high.
That ascent follows just a brief little 22-year decline.
In fact, investors have poured money into Japan equity funds in 10 of the last 12 weeks, according to EPFR Global data cited by The Journal. Net inflows totaled $3.09 billion during the perio
The rise has come amid optimism over new Prime Minister Shinzo Abe’s economic stimulus plans.
They include a weaker yen, which is boosting the fortune of Japan’s big exporters like Sony, Panasonic and Toyota. A falling currency helps a country’s exports by making them cheaper in foreign currency terms.
Goldman Sachs analysts figure that Japanese exporters’ profit rise 7 to 10 percent for every 10 yen that the dollar rises, The Wall Street Journal reports.
The dollar hit a 2 ½-year high of 94.06 yen this week.
“The stock story has mostly been a yen-driven phenomenon, no question,” Naoki Fujiwara, a fund manager at Shinkin Asset Management, tells The Journal. “Some investors are finding that they can’t afford to remain on the sidelines.”
Lorne Steinberg, chief executive of Lorne Steinberg Wealth Management in Montreal, believes the market will keep rising. “We could be looking at a two-to-three year equity market rally,” he says.
Construction companies have registered the highest risk-adjusted return among Japanese stocks since an earthquake and tsunami hit the country on March 10, 2011, according to Bloomberg.
“Public works investment will be robust in the long term when you consider the government’s plan to strengthen infrastructure,” Masaru Hamasaki, chief strategist at Toyota Asset Management, tells Bloomberg.
“That’s highly likely to give construction companies a stable revenue source.”
However, Japan’s public debt is more than twice the size of the economy.
“You can’t keep expanding public works when you think about Japan’s fiscal situation,” Isao Kubo, a Tokyo-based equity strategist at Nissay Asset Management, tells Bloomberg. “There’s been support for construction stocks since the earthquake, but I don’t think it will last long.”
Money News: The ‘Unthinkable’ Could Happen — Wall Street Journal. Prepare for Meltdown

-
I know Mike is a very solid investor and respect his opinions very much. So if he says pay attention to this or that - I will.
~ Dale G.
-
I've started managing my own investments so view Michael's site as a one-stop shop from which to get information and perspectives.
~ Dave E.
-
Michael offers easy reading, honest, common sense information that anyone can use in a practical manner.
~ der_al.
-
A sane voice in a scrambled investment world.
~ Ed R.
Inside Edge Pro Contributors

Greg Weldon

Josef Schachter

Tyler Bollhorn

Ryan Irvine

Paul Beattie

Martin Straith

Patrick Ceresna

Mark Leibovit

James Thorne

Victor Adair