

Continuing strength in equity markets has provided an opportunity to take profits on strength on a wide variety of seasonal trades (e.g. agriculture, technology, biotech) and to rotate into other sectors that have a history of outperformance during the February to April period (e.g. energy, platinum, silver, copper, retail).
(You can listen to Mike’s Interview of Don Vialoux Feb 9th on Money Talks HERE)
Equity Trends
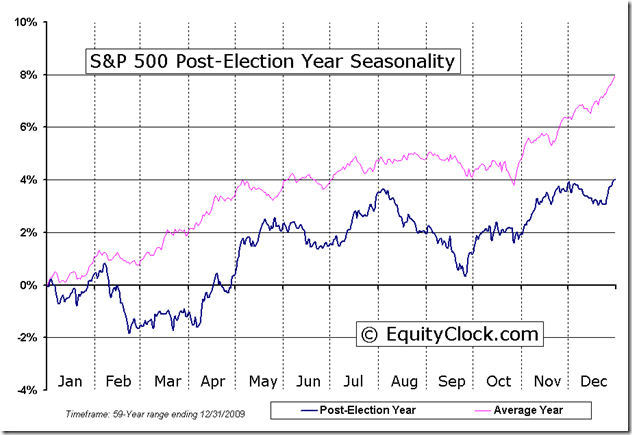
History shows that U.S. equity markets in the year after a Presidential election move higher until the end of the first week in February weaken thereafter until the end of March and move higher thereafter. Given political events scheduled in the U.S. during the next two months, history is about to repeat.
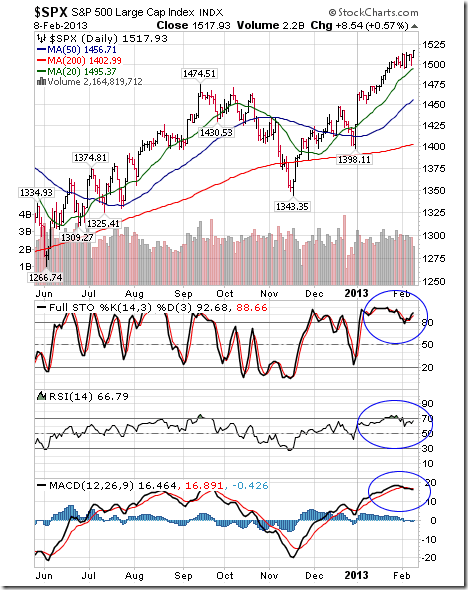
The S&P 500 Index gained 4.76 points (0.31%) last week. An intermediate uptrend was confirmed when the Index closed at a 5 year high. The Index remains above its 20, 50 and 200 day moving averages. Short term momentum indicators remain overbought.
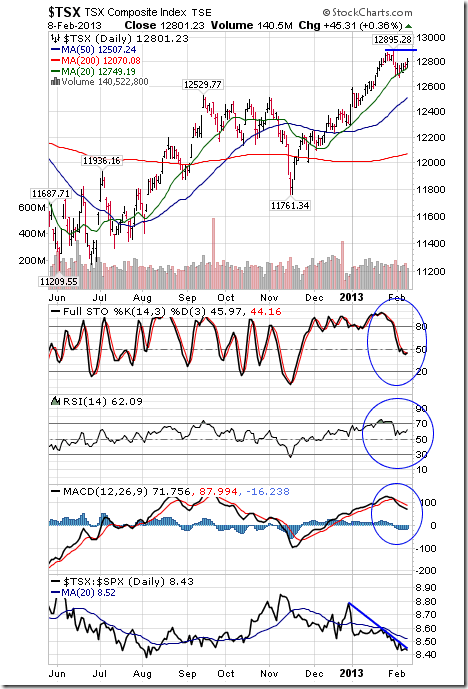
The TSX Composite Index improved 32.40 points (0.25%) last week. Intermediate trend is up. Resistance is forming at 12,895.28. The Index remains above its 20, 50 and 200 day moving averages. Strength relative to the S&P 500 Index remains negative. Short term momentum indicators have rolled over from overbought.
Currencies
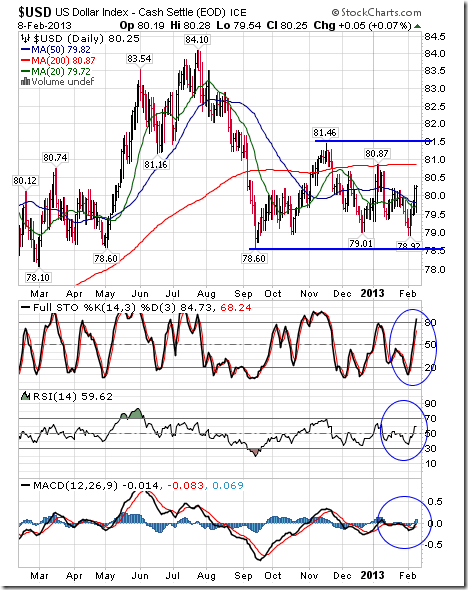
The U.S. Dollar gained 1.12 (1.42%) last week. The Dollar moved above its 20 and 50 day moving averages. Short term momentum indicators are trending up.
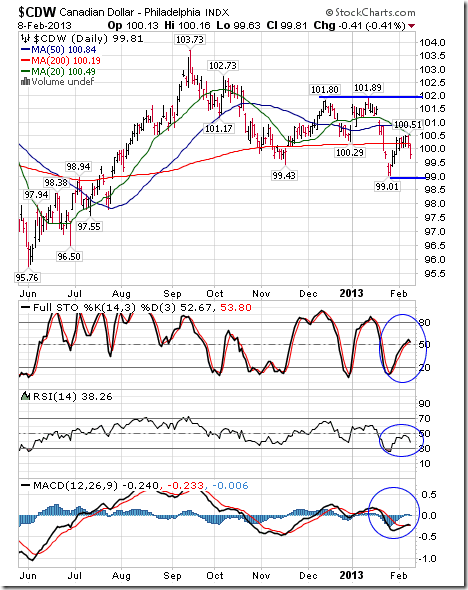
The Canadian Dollar fell 0.48 cents U.S. (0.48%) last week on strength in the U.S. Dollar. The Canuck Buck remains below its 20 and 50 day moving averages and fell below its 200 day moving average on Friday. Short term momentum indicators are neutral.
Commodities
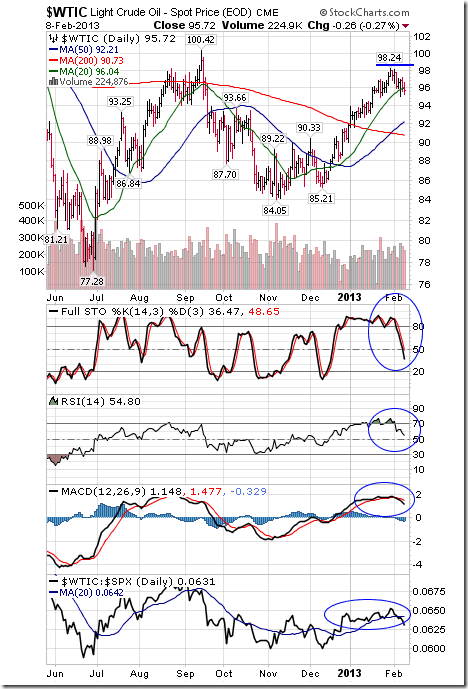
Crude Oil fell $2.05 per barrel (2.10%) last week. Intermediate trend is up. Resistance is forming at $98.24. Crude remains above its 50 and 200 day moving averages, but fell below its 20 day moving average on Friday. Strength relative to the S&P 500 Index changed from positive to neutral. Short term momentum indicators have rolled over and are trending down.
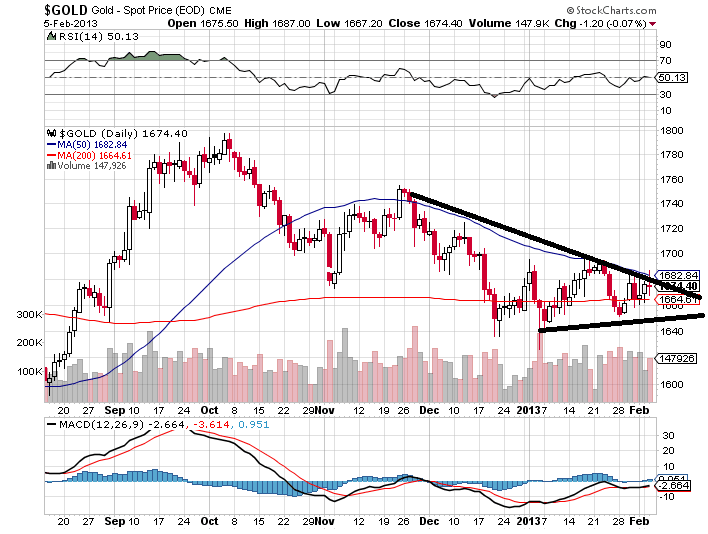
Gold slipped $3.70 per ounce (0.22%) last week. Intermediate trend is neutral. Support is at $1.626.00 and resistance is at $1,697.80. Gold remains above its 200 day moving average and below its 20 and 50 day moving averages. Strength relative to the S&P 500 Index remains negative. Short term momentum indicators are neutral.
…..read more and view 45 charts HERE


