
Energy & Commodities
Jim Rogers has been bullish on agriculture for years now. He stated during an interview with the Economic Times in 2009:
Ten years from now, it may be farmers who will drive the Lamborghinis and the stock brokers will drive tractors or taxis at best.
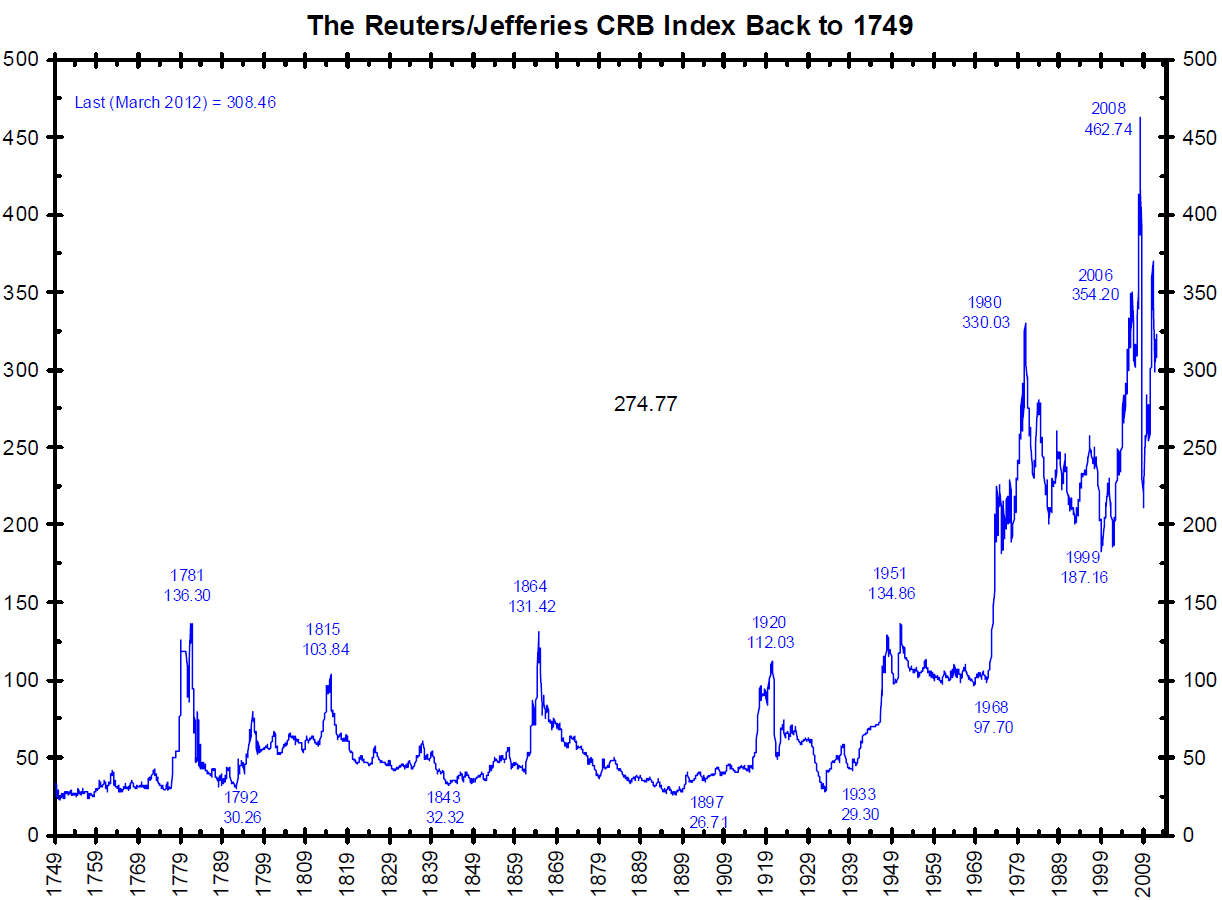
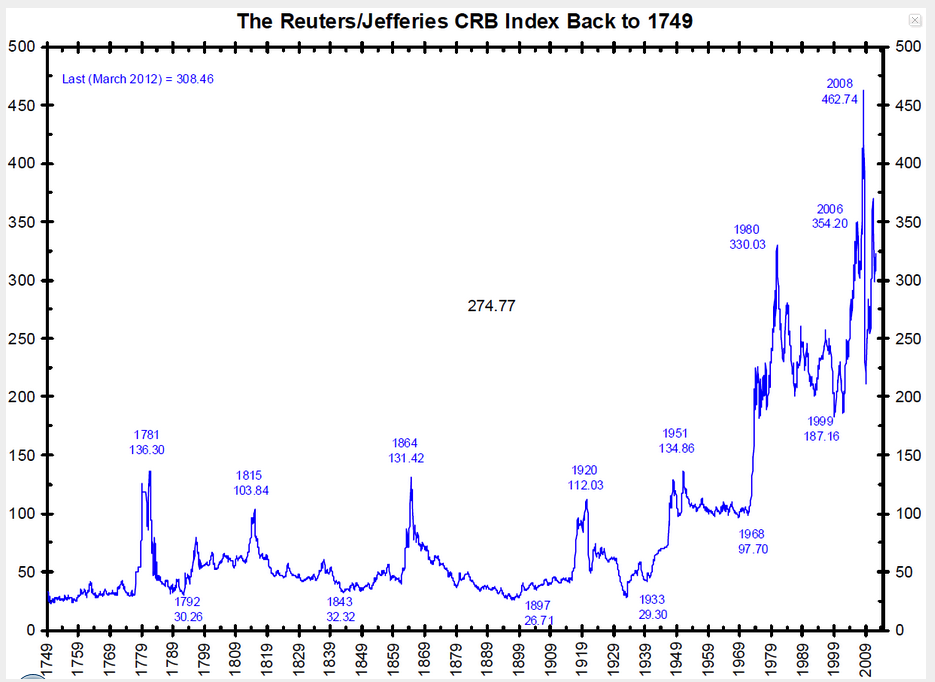
In order to get into his mind, one first needs to understand the mechanisms driving the commodities market, which is really the “real assets” market that includes agriculture, a very long term chart is in order. Here s one of the CRB interpolated from 1749 to the present.
….click HERE to enlarge this chart and read the rest of this detailed Historical article.
What’s happening here needs a bit of explanation. It would seem, from 1749 until 1968, the general nature of real asset prices is that they skirt along their floor with periodic spikes. We have long periods of stable prices from 1749-1779, 1789-1812, 1816-1861, and 1870-1914. After 1914 until 1952 things start going a little haywire, and the final stable period is between 1955 or so until 1968. After that, there is no longer such a thing is commodity price stability. Forget it.
If we look at the spikes and remember what was going on during those times, things start to make some sense. 1781 was the peak of the Revolutionary War Continental Dollar printing. 1815 marked the end of the War of 1812, marred by periodic national suspensions of specie payments for paper dollars, allowing banks to inflate the paper money supply during that time to finance the war. 1864 was, obviously, the Civil War, again financed by paper money called Greenbacks, America’s first relatively long experiment in fiat money. 1914-1920 is the World War I money printing, but more importantly, the founding of the Federal Reserve System which centralizes the money printing business and perhaps causes the Great Depression, among other things. In 1933, with commodities bottoming out, FDR confiscates all gold in the country and devalues it, enabling the Fed to print even more and inflate asset prices. World War II and the Korean War push up prices further, but the international link of the dollar to gold is still alive.
In 1968, it breaks down. With the Nixon administration printing dollars to finance the Vietnam War, foreigners begin cashing them in for gold. To stop a gold run, Nixon tries to create a fake gold market between central banks and ignore the free gold market everywhere else. This was called the “two tier gold market” that lasted from 1968 until 1971. After that, it was over. The dollar lost all definition, and real asset prices haven’t even had a short period of stability since then.
So we see, during periods of massive money printing, real asset prices always go up. The reason they go back down afterwards is that periods of money printing have historically been followed by periods of deflation, but this was only because, throughout the centuries, the dollar-gold anchor was always eventually restored. This time it doesn’t exist. This time, real asset prices will just keep going up in dollar terms.
Be that as it may, the reason Jim Rogers likes to focus on agriculture is that the statistics with agriculture are surprisingly shocking. According to the National Crime Records Bureau [NCRB], there were 17,368 Indian farmer suicides in 2009 alone. While farming may not have been the sole cause that attributes to such a sad statistic, the fact is that agriculture has been a horrible business for decades. It is not my intention to sound gloomy about this, but when one considers the cost of seeds and the labor involved, many farmers are literally working themselves to financial death because they simply can’t make a living. Additionally, with the average age of a farmer at 55, the supply of farmers is going down. They are getting older with few young replacements. And if this trend continues, we may not have enough food to go around and prices are going to have to rise higher than they are already.
Rogers, to my knowledge, is not long agricultural or commodity stocks, but rather commodities themselves. He’s said this before about gold miners, which he does not invest in. It stands to reason he would not be long agricultural stocks either. It’s Wall Street Trends 101 that says that stocks and commodities bull markets run inversely. However, this is true mainly for consumer goods industries rather than capital goods industries. For example, when wheat is expensive, so goes the theory, General Mills’ (GIS) profit margins on its cereals will tend to contract, and the company will lose revenue. For capital goods stocks however, it stands to reason that companies supplying the agriculture industry, rather than retailing off of it, will boom along with agricultural prices. So, for example, Deere and Company (DE) will sell more farm equipment to farmers who will make more money when agricultural commodities start getting more expensive.
Despite the logic of this theory, one needs to have quite a strong stomach to be long capital goods industries at this time. If you thought being long the general market was tough in 2008, take a look at a comparison graph between DE and SPY.

…click HERE to enlarge this chart and read the rest of this detailed Historical article.
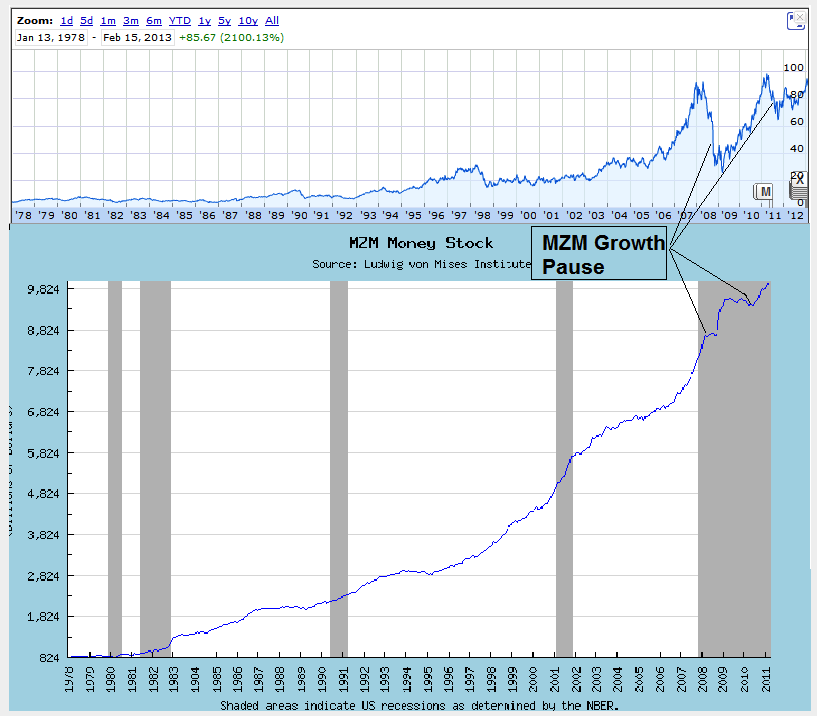
This extreme volatility can be correlated to the liquid money supply [MZM] fluctuations. Take a look at the long term chart of DE compared to the MZM, or liquid money supply in the economy along the same time period.
…click HERE to enlarge this chart and read the rest of this detailed Historical article.
Since Deere is at the very top of the structure of production, meaning capital goods as opposed to consumer goods which are at the bottom, liquid money supply moves to the top first, as interest rates are pushed down and long term investment projects are taken up, which require capital goods first and foremost. The problem is, once the Fed stops printing even for a few months after a long stretch of MZM increases, the boom cannot be sustained, and capital goods stocks fall rapidly. At the beginning of 2008, MZM growth clearly flat-lined for close to a year after a huge burst of growth starting in 1995 from $2.8T to nearly $8.8T, an increase of 214% in 13 years. With all the money from capital goods industries being supplied by the Fed suddenly drying up in 2008, the bubble deflated fast. Then the printing presses were fired up once again, and it resumed. As long as the Fed continues, holders of Deere and companies at the forefront of the structure of production will keep being first in line to receive the new Fed money. The minute he stops, DE shareholders will suffer.
But this is not investing. This is just playing a game of chicken with the Fed. If you want to do it, go ahead. I’m not touching it with a ten foot pole. Instead of stocks like Deere, the safest way to play the agriculture game besides investing in farmland straight-up is agriculture futures ETF’s like DBA or, in honor of Rogers, RJA, an ETN that replicates the performance of the Rogers International Commodities Index. These are not for trading. Just look at the tail end of the 1749-present graph of the CRB. Don’t even try. They are for buying and waiting while shielding oneself from price inflation. We have seen that from 1749 until today, every time the government prints money, commodities skyrocket. It used to only be during war time. Now it’s just constant. It is heads you win, tails you win. Either the global economy will pick up, in which case there will be shortages and commodities will rise, or they will print money, in which case commodities will rise. This is already reaching epidemic proportions, as reports are multiplying now about the G20 “denying currency wars” meaning, money printing competitions. When all governments deny it, that’s when we know it’s definitely happening.
There may be one more way to play this, but only with leftover cash, nothing big. During my search, I came across a microcap that may have the business idea to benefit from real asset gains in agriculture while avoiding the gyrations of printing press manipulation at the capital goods level. Terra Tech Corp.,(TRTC.OB) is attacking a new niche, urban farmers, basically connecting capital goods directly with end consumers and “sowing together” the beginning and end phases of the structure of production. These are horticulturists who live in the city or suburbs and want to grow their own food and gain independence from Big Ag. Terra Tech has been expanding recently, thinning its already thin balance sheet and hammering its stock price, which already comes with fairly large speculative dangers. But when agriculture prices do start to climb, this market will inevitably expand as people may try to save money by growing food at home, which will save massively on transportation costs and increase supply.
In New York City for example, a new trend is slowly spreading where tenants grow food on their roofs and balconies, and Terra Tech sells the hardware for this. When farmers get richer and demand for MBA’s dwindles, people in urban areas are going to start flocking to farms. Urban areas are pretty crowded, but they are seriously lacking in food, which is almost all imported.
Only time will tell if Terra has the right idea. The next few quarters will be crucial, and will show if it can grow its revenues, which only started flowing in at the beginning of last year.
About Tal Ben-Ami
Holds an MBA in economics from TAU – Doctoral student.

James Grant thinks so…
BROKEN CLOCKS get a bad rap…at least they are right twice a day, quips Eric Fry in the Daily Reckoning.
 Many are the objects, individuals and/or institutions who are lucky to be right once a day… or even once a year. Consider, for example, those poor souls who continuously predict rising interest rates. These “bond bears” have not been right once in the last 30 years.
The lesson is clear: Better to be a broken clock than a bond bear.
But even if bond bears are not right even once-a-three-decades, perhaps they will prove to be right once-a-generation… and perhaps that moment is now, or almost now.
So says James Grant, editor of Grant’s Interest Rate Observer. In a recent issue of his esteemed newsletter, Grant observed, “Today’s stunted interest rates, though not exactly unprecedented, are rare and remarkable. The world over, creditors are living on the equivalent of birdseed. Investors who once disdained sky-high yields today settle for crumbs…What are they thinking today?”
Grant answers his own question. Today’s bond buyers believe that “in an overleveraged economy, inflation is unachievable. So is growth, they have lately begun to insist. As for us, we hold a candle for both growth and inflation — and, in consequence, for our long anticipated, long overdue bond bear market.”
Grant hangs most of his prediction on fifth-grade arithmetic…or maybe advanced fourth grade: Debts are rising a lot. Revenues, not so much.
“Like a well fed teenager,” says Grant, “the national debt keeps growing and growing. On December 31, it bumped its head against the statutory ceiling that never seems to contain it. That would be $16.394 trillion, or the cash equivalent of 360.7 million pounds of $100 bills.”
Meanwhile, as the national debt continuously inflates by millions of pounds of hundred dollar bills, the national tax receipts struggle to keep pace.
“In the past 10 years to fiscal 2012,” Grant observes, “the compound annual growth in federal receipts worked out to 2.8%, that of federal outlays, 5.8%. In as much as the growth in receipts was much below the historical median (which, since 1967, had been 6.75% a year), one might — just for argument’s sake — say that the country had an income problem.”
Rapidly growing debt, coupled with slowly growing revenue, often creates a toxic environment for bonds. Bottom line: Grant is bearish on long-dated US Treasurys.
Eric Fry
for The Daily Reckoning
- January 31, 2013 — On Borrowed Time
- February 6, 2013 — S&P On the Kill List
- January 28, 2013 — US-China Relations: War in 2013?
- February 5, 2013 — The Charm of “Charm City”
- January 24, 2013 — Platinum’s Neglected Cousin

So if you think all is calm now, or relatively calm …
And if you think that President Obama’s ending of our role in Afghanistan signals the end of the war on terrorism …
Then I urge you to reconsider your views by taking a look at what my war research is telling me.
You see, just like business cycles, or various different economic cycles, the waging of war within and between nations has definite, identifiable rhythms.
In my research on war, which has covered more than 5,000 years of war data, I’ve found that there are three distinct cycles to war.
There are the 8.8 and 17.7 cycles. They in turn are sub-cycles of a larger cycle that’s 53.5 years in duration.
The 53.5-year cycle can be seen in this cycle chart here.

As you can clearly see, the 53.5-year War Cycle nailed major turning points …
![]() The War of 1812
The War of 1812
![]() The Civil War
The Civil War
![]() The end of WWI in 1918
The end of WWI in 1918
![]() The U.S. entry into WWII
The U.S. entry into WWII
It then …
![]() Rose during the Korean and Vietnamese Wars
Rose during the Korean and Vietnamese Wars
![]() And bottomed in 1995, right around the middle of the “Peace Dividend,” which resulted from the initial fall of communism in the former Soviet Union and the opening up of China’s communist economy.
And bottomed in 1995, right around the middle of the “Peace Dividend,” which resulted from the initial fall of communism in the former Soviet Union and the opening up of China’s communist economy.
The 53.5-year cycle has been turning up ever since. It should now be picking up momentum as its amplitude is not set to peak until 2027.
Now consider the shorter-term war cycles. Consider the 17.7-year cycle shown here. You can see how it too uncannily pegged important turning points, right on cue.
The Civil War, the Spanish-American War, the financial Panic of 1907, the end of WWI, the beginning of WWII for the U.S., the Korean War, the Vietnam War, and more.
Where does it stand now? This war sub-cycle is pointing directly up into 2014!
Now consider this next chart I have for you, which synthesizes the 53.5, the 17.7 and the 8.8-year war rhythms into one chart to give you a complete picture of where we stand right now.

We are right on the edge of seeing the war cycles turn violently higher, heading all the way up into the year 2019 before any lull is found.
What kind of war could we be facing? It could be …
• Another surge of terrorism
• A civil war and the breakup of Europe
• Massive civil unrest in the U.S.
• A war in the Middle East
• A war between China and Japan over the Senkaku (or Diaoyu) Islands
• A war between China and Vietnam, Malaysia and the Philippines over the Spratly Islands
• A Cyber war
• Massive uncontrolled currency wars
Or any combination of many or even all of the above!
It’s coming. You can see it in the increased tensions between China and Japan.
 Between China and the U.S.
Between North Korea and the U.S.
Between North Korea and Japan.
Between China and Vietnam and other countries laying claim to the Spratly islands.
And it’s going to impact markets in ways you simply must prepare for. It will likely drive U.S. equities sharply higher. It could be the main trigger for gold and other commodities to finally enter the next phase of their bull legs higher. Click for larger version
It would send interest rates higher, and bond prices lower. It could cause all kinds of economic and financial repercussions that will either strip you of your wealth this year …
Or help you become richer than Midas.
Until next week …
Best wishes,
Larry


Gold is declining once again this morning. In fact gold has fallen quite dramatically from its high on October 4th of last year at $1797.70 an ounce. Gold trades, as I write, at $1608 an ounce, a decline from its October high of almost 11%.
Gold bugs everywhere are fretting and the gold haters are saying “I told you so.” As you can see, the market gods have not been kind and may have labeled gold the “barbarous relic” John Maynard Keynes dubbed (he was referring to the gold standard at the time) almost a century ago (Monetary Reform 1924).
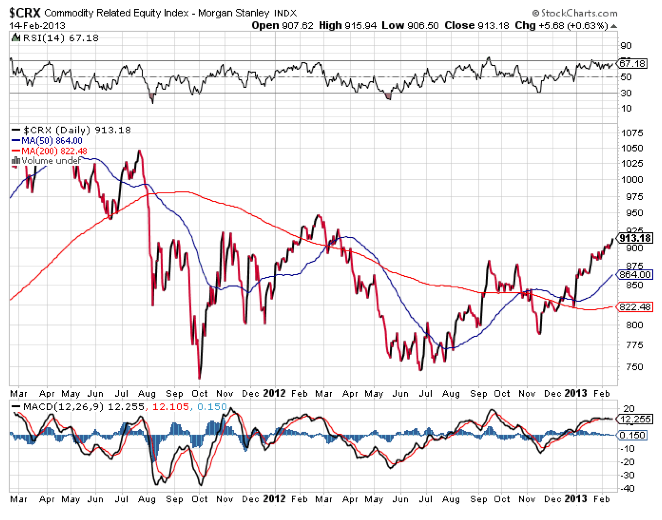
So has gold run its course? Are we now out of the economic woods? It is interesting to note that the CRB commodity index has taken off at the same time. This would seem to imply that at least the market believes that there’s growth somewhere that will require significant commodity discovery. But it is gold and silver that have not followed suit.

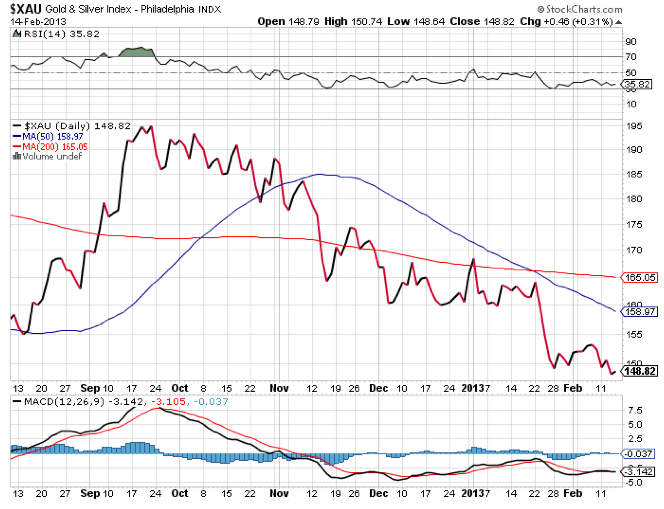
Hand-in-hand, the XAU index has fallen and continues to keep pace on the downside with price of gold. Its decline over the same period is almost 24%. So investors have taken gold and silver stocks, even the legacy producers, out to the woodshed and shot them.
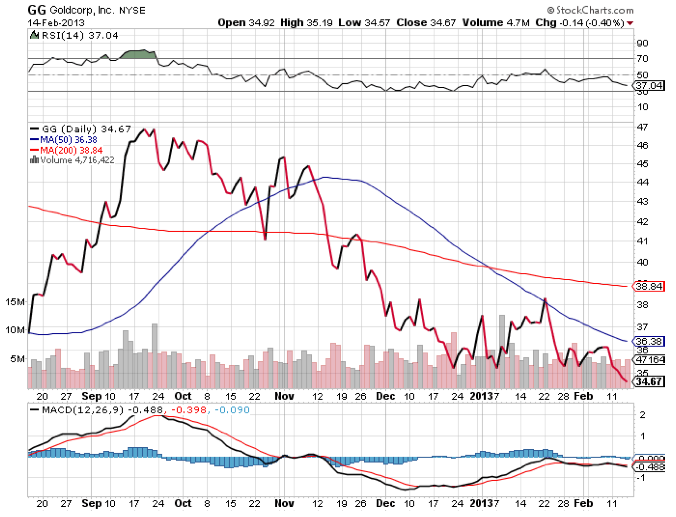
The emerging leader of the legacy gold stock universe today is Goldcorp. By all measures except share price, Goldcorp has provided investors with superior performance. In the fourth quarter alone Goldcorp produced a $504 million profit (earnings attributable to shareholders) primarily from its Canadian Red Lake and Mexican Penasquito mines. The Globe and Mail suggests this 25% increase in shareholder profits, before adjustments, positioned Goldcorp well for the coming year. We agree.
The company has now developed 67.1 million ounces of proven and probable gold resource.
During the past quarter Goldcorp produced 700,400 ounces of gold. At Penasquito alone the company produced 112,900 ounces of gold and 5.2 million ounces of silver. Costs were expected to be between $525 to $575 per gold ounce.
Operating cash flows for the year before working capital changes totaled $2.4 billion or $2.97 per share. The company increased its monthly dividend 11% to 5 cents a share. On an annual basis the dividend yield is now over 2%. Goldcorp also has reduced its risk, increased its production profile and generated significant free cash flow. Goldcorp looks to become a consolidator in the industry with its significant cash hoard.
As you can see in the following chart of Goldcorp’s share price the stock has declined 29% since its high $47.42 on September 21. It is difficult to explain this decline under the circumstances of such superior operating performance in almost all aspects of the company. The only reasonable explanation is that the market believes that the price of gold is going to fall further.
We are not in that camp. As competitive currency devaluations continue around the world and as the central bankers continue to accumulate gold and print fit currency to depress interest rates, gold and silver and other precious metals, as well as hard assets, must eventually appreciate in price.
There is of course one outstanding issue that we discussed in Wednesday’s Morning Note. It is the issue that all central bankers fear most. Could it be that markets are discounting a deflationary economic scenario in their valuation of gold? Will cash reign supreme?
It doesn’t appear likely that central bankers of the world, at this stage, will be curtailing their quantitative easing programs anytime soon with Western growth depressed. And given the recent and 3 1/2 month increase in the CRB commodity index (see graph of the CRB below) and the apparent resilience of the largely debt-free emerging world, global deflation does not seem imminent.
Therefore we believe the price of gold either has or is likely to make bottom in the near future. The leverage of the legacy gold producers will be very significant in the next year or two. For the most part the legacy gold producers issue dividends. If it is to be deflation as Gary shilling suggests then all bets are off. However the strong driver of the quality-of-life, long-term secular cycle now underway would seem to undermine a deflationary scenario in our view.
Goldcorp CEO Chuck Jeannes believes that there is simply a disconnect between the gold market, the gold indexes and the price of the shares of the gold miners. Yesterday in an interview with Toronto’s Globe and Mail he explained this disconnect,
“Relative to our peers Goldcorp is doing quite well … we are the top performer among the senior stocks … on an absolute basis we’ve seen over five years cash flow per share has gone up over 300% and our share price is up only 65% so there is a disconnect … the leverage we provide to increases in the gold price. It’s a complex situation as the gold price ran up so quickly to $1900 and people didn’t believe in it … but it’s also a fact there’s some operational issues in our sector, some political risk challenges where countries have taken assets … and there’s been a lot of cost inflation which has eaten into margins of gold producers. But I’m happy to say we were all subject to the first issue of investor’s view of the gold price. But at Goldcorp we’ve reduced our risk, maintained our costs and haven’t had any significant issues.”
The plight of the juniors in the exploration space is quite different however. For the most part these companies do not have cash flows and may not have developed resources yet. It is very clear that the junior resource sector is suffering dramatically from the fear of unsustainability of operations and the difficulty of producing a discovery in the short run.
In the long run this means that all discovered and readily available commodities, but particularly gold and silver, will become less available. Pierre Lassonde, chairman of Franco- Nevada, has this made this point numerous times in the past few months.
Discovery and mine development may be a 10 year process. If this is the case within the next few years there should be significant upward price pressure on the metals in general and gold and silver specifically.
Michael A. Berry, Ph.D.
Morning Notes
The material herein is for informational purposes only and is not intended to and does not constitute the rendering of investment advice or the solicitation of an offer to buy securities. The foregoing discussion contains forward-looking statements within the meaning of the Private Securities Litigation Reform Act of 1995 (The Act). In particular when used in the preceding discussion the words “plan,” confident that, believe, scheduled, expect, or intend to, and similar conditional expressions are intended to identify forward-looking statements subject to the safe harbor created by the ACT. Such statements are subject to certain risks and uncertainties and actual results could differ materially from those expressed in any of the forward looking statements. Such risks and uncertainties include, but are not limited to future events and financial performance of the company which are inherently uncertain and actual events and / or results may differ materially. In addition we may review investments that are not registered in the U.S. We cannot attest to nor certify the correctness of any information in this note. We own shares in Goldcorp. Please consult your financial advisor and perform your own due diligence before considering any companies mentioned in this informational bulletin.
One of the primary focal points of our writing is the corruption that has become endemic to the political and financial elites of the world. When we refer to corruption we are referring to insider deals, cronyism, lies and fraud. Since the Great Crisis began in 2008, these have become the four pillars of the financial system replacing the pillars of trust, transparency, truth and reality that are the true foundation of capitalism and wealth generation.
As we regularly note, corruption only works as long as the benefits of being “on the take” outweigh the consequences of getting caught. As soon as the consequences become real (namely someone gets in major trouble), then everyone starts to talk.
This process has now begun in Spain.
MADRID — Spain’s governing Popular Party was drawn deeper into a web of corruption scandals this past week, after the Swiss authorities informed the Spanish judiciary that the party’s former treasurer had amassed as much as 22 million euros, or $29 million, in Swiss bank accounts.
The treasurer, Luis Bárcenas, resigned from his job in 2009, after being indicted in the early stages of an investigation, which is still ongoing, into a scheme of kickbacks and illegal payments allegedly involving other conservative party politicians…
Nonetheless, the revelations have brought a fast-growing list of corruption investigations, which have unspooled across Spain, to the doorstep of the conservative government of Prime Minister Mariano Rajoy, who has so far remained silent. About 300 Spanish politicians from across the party spectrum have been indicted or charged in corruption investigations since the start of the financial crisis. Few have been sentenced so far.
http://www.nytimes.com/2013/01/19/world/europe/corruption-scandals-widen-in-spain.html?_r=0
Outside of Spain, corruption scandals have also erupted in Greece. There it was revealed that the very Greek political parties that were negotiated the Greek bailout had received over €200 million in loans from the Greek banks.
Greek prosecutors have ordered the two main ruling parties to testify in an investigation into more than 200 million euros in loans they received from banks, officials said on Friday.
The investigation – which is examining whether the loans are legal and whether any wrongdoing was involved – could embarrass the fragile conservative-led government, which relies on aid from the European Union and the International Monetary Fund.
Last year a Reuters report revealed the conservative New Democracy and the Socialist PASOK parties were close to being overwhelmed by debts of more than 200 million euros as they face a slump in state funding because of falling public support.
http://www.reuters.com/article/2013/02/01/us-greece-parties-idUSBRE91010O20130201
Here again, we find that politicians were “on the take” via questionable if not illegal funds. The fact that this story is coming out now does not bode well for Greece, which is barely holding together as a country.
The consequences of this discovery will not be positive for the Greek political class:
Greece’s finance minister was sent a bullet and a death threat from a group protesting home foreclosures, police officials said on Monday, in the latest incident to raise fears of growing political violence.
The package was sent by a little-known group called “Cretan Revolution”, which warned the minister against any efforts to seize homes and evict homeowners, police sources said. The group sent similar letters to tax offices in Crete last week.
http://news.yahoo.com/greek-finance-minister-sent-bullet-mail-165717734.html
 Italy is also facing a major scandal implicating key political figures including the biggest player for European financial system, ECB President Mario Draghi:
Back in mid-January, Bloomberg’s Elisa Martinuzzi and Nicholas Dunbar reported that Deutsche Bank helped Italy’s third-largest bank, Monte Paschi, cover up a 367 million euro loss at the end of 2008 with a shady derivative deal. That swap helped the bank look better than it really was just before taxpayers bailed it out—echoes of Goldman Sachs’s deal to hide Greece’s national debt.
The Italian papers followed Bloomberg’s scoop days later with news that Nomura had structured a derivative for Monte Paschi along similar lines. The Italian central bank then disclosed Monte Paschi executives had concealed documents on the trades from them. Reuters reported that JPMorgan also did a sketchy derivative for the bank.
But the scandal only continued to grow. So far, the bank may have lost a billion dollars on the deals, and it turns out that the Bank of Italy knew about the allegedly fraudulent deals back in 2010, when Mario Draghi was its chief. Draghi is now head of the European Central Bank, and has been critical in tamping down the euro crisis in the last several months.
Now, the scandal threatens to change the course of Italian national elections being held later this month, giving a leg up to Silvio Berlusconi…
http://www.cjr.org/the_audit/bloomberg_unearths_an_italian.php
The key item in the above story is Mario Draghi’s involvement. As head of the European Central Bank, Draghi is arguably the most powerful man in Europe. Indeed, it was his promise to provide unlimited bond buying that stopped the systemic implosion of Europe last summer.
In this sense, the entire EU has been held together by Draghi’s credibility as head of the ECB. The fact that we now have a major scandal indicating that he was not only aware of fraudulent deals in 2010, but gave them a free pass will have major repercussions for the future of the Euro, the EU, and the EU banking system.
We hope by now that you see why we have remained bearish on Europe when 99% of analysts believe the Crisis is over. The only thing that has the EU together has been the credibility of politicians who we are now discovering are all either corrupt, inept or both.
To use a metaphor, if Europe were a single house, it would be rotten to its core with termites and mold. It should have been condemned years ago, but the one thing that has kept it “on the market” was the fact that its owners were all very powerful, connected individual. We are now finding out that the owners not only knew that the home should have been condemned but were in fact getting rich via insider deals while those who lived in the house were in grave danger.
As we stated at the beginning of this issue, corruption only works as long as the benefits of being “on the take” outweigh the consequences of getting caught. As soon as the consequences become real (in that someone gets in major trouble), then everyone starts to talk.
The above stories about Greece, Spain, Italy reveal that we have entered the stage at which people have begun to talk about Europe’s corruption.
We have produced a FREE Special Report available to all investors titled What Europe’s Collapse Means For You and Your Savings.
This report features ten pages of material outlining our independent analysis real debt situation in Europe (numbers far worse than is publicly admitted), the true nature of the EU banking system, and the systemic risks Europe poses to investors around the world.
It also outlines a number of investments to profit from this; investments that anyone can use to take advantage of the European Debt Crisis.
Best of all, this report is 100% FREE. You can pick up a copy today at:
http://gainspainscapital.com/eu-report/
Best
Phoenix Capital Research


-
I know Mike is a very solid investor and respect his opinions very much. So if he says pay attention to this or that - I will.
~ Dale G.
-
I've started managing my own investments so view Michael's site as a one-stop shop from which to get information and perspectives.
~ Dave E.
-
Michael offers easy reading, honest, common sense information that anyone can use in a practical manner.
~ der_al.
-
A sane voice in a scrambled investment world.
~ Ed R.
Inside Edge Pro Contributors

Greg Weldon

Josef Schachter

Tyler Bollhorn

Ryan Irvine

Paul Beattie

Martin Straith

Patrick Ceresna

Mark Leibovit

James Thorne

Victor Adair