Energy & Commodities

Junior Miners: “Back in the Danger Zone

Juniors are still in flat-line mode (on a good day). A bunch of new resource estimates were not enough to make much difference though in my experience they often don’t. There are enough people tracking most stocks that the market tends to have a fair idea of what a resource estimate will look like. Weakening gold and silver prices dampened the impact of even good numbers.

SO FAR, SO MEDIOCRE

I had hoped to come away from the January conferences with some new idea. There are a few stories I’m going through due diligence on but nothing jumped out at me. I’m hoping something does as I have become more and more convinced that what this market really needs is something new. I wouldn’t expect traders to pay up for anything ahead of results but a story that hasn’t been worked over by the market seems to be on most traders wish lists. Companies on the HRA list with new targets should all be drilling within 2-3 months. Hopefully one of these delivers the positive surprise the juniors desperately need.

I still expect at least a moderate rally in the juniors later but the sector is back in the danger zone. We need to see a bounce from current levels soon for that narrative to maintain any validity. If this year does turn out to be a “2009-lite” we should start seeing evidence in the next month or so.

Six weeks into the new year and there is still no joy for junior resource traders. In the large markets there has been plenty of good news, with several exchanges hitting multi year highs. In our little corner of the market however, gloom predominates.

I’ve noted in print and in a couple of recent investor presentations that the current conditions remind me in some ways of 2009. I’m referring to the junior market specifically when I say that.

The chart below shows the TSXV index for the year 2009. Before going farther I should stress that I am not expecting a gain for the year in 2013 anything like that the Venture delivered in 2009. That would be nice but it’s very unlikely. My references to 2009 have to do with market conditions at the start of that year which were unusual.

Keep in mind also that we’re talking about the Juniors specifically. The economic and major market backdrop was obviously much different in 2009. As the chart on the next page shows there was a “Santa Claus” rally that lasted into mid- January before the first pullback. The first rally was a reaction to both the tail end of a four month up leg in the gold price and a horrendous tax loss selling season. Strong though the short term rally was, it is better classified as a “dead cat bounce”. It wasn’t until sometime later a real rally started.

Screen shot 2013-02-26 at 4.52.50 PM

Gold price moves sustained a second short rally into February 2009 until it was knocked back by the final drop in the major markets and a simultaneous pullback in gold prices. All in all, the market really went nowhere for the first quarter of 2009.

So far this year, we’ve definitely held to the “going nowhere” part of the script. The Venture index is now back to the range it bottomed at in December and the summer of last year. If we do manage to generate any upward momentum it’s unlikely we’ll have to worry about a “PDAC Curse” this year. Like 2009, there would not have been enough of a rally by the end of February for that to be an issue.

In 2009, the market turned up in mid-March and with the exception of 2-3 small pullbacks never really looked back until 2010. The Juniors were following the senior markets and commodity prices, both of which had similar rallies.

This time around the major markets are close to the highs they started their 2008 falls from. While I expect the large markets to have an ok year there certainly won’t be a monster 2009 style rally to drag the juniors higher.

There should be enough good news on the economic front to move some commodities higher. We noted strong rallies in iron ore in the last issue. Base metals have held up relatively well. This means most of them, like the large indices, aren’t in a position to stage major up moves from here.

The market has not been paying up for base metal discoveries lately anyway, unless there is a good precious metals kicker. That could change but I don’t expect much help from that sector as it is small.

With those drivers discounted, what do we have left? To my mind we have three potential game changers; precious metal prices, discoveries and …boredom.

Gold and silver have not behaved well recently. That is one reason for the latest failed rally. With the US performing relatively well there is no reason to expect gains from a falling US Dollar. The most recent down move resulted from stories that the G7 would act to stop members from devaluing their currencies.

The obvious target for that was Japan. In the end though, the G7 backed off and I suspect when the G20 has its meetings it will leave Japan alone too. Everyone recognizes Japan has to find a way out of a deflationary spiral and the Yen has been expensive anyway. If further falls in the Yen help Japan out of the corner its painted itself into most governments are willing to live with it.

The more cynical reason for leaving Japan alone is that other major currency blocks will keep printing themselves. Some of the recent drop in the gold price should resolve itself when the market comes around to accept that.

The move will be larger if Europe can get through some of its political issues. This has weakened the Euro. There have been calls from some quarters in Europe to weaken the Euro as a response to Japan’s Yen moves. This isn’t likely to happen. Germany is still the most powerful force in Europe and Germans are dead set against the idea of large scale QE. They are still terrified by the idea of inflation.

That terror is shared by few other central bankers and no politicians. Whatever the risks of QE and activist monetary policy, it’s what worked in the last three years. That lesson is lost on no one.

Japan is again a prime example for politicians in other states. Deflationary spirals are extremely difficult to break out of. G20 politicians are far more worried about 20 years of Japanese style stagnation than they are about higher inflation. Make no mistake; most central banks will keep printing money.

The physical gold and silver markets remain stronger than the paper one and as several observers have noted, gold has built up a very large short position. It is a good set up for a strong upward move if a catalyst appears. That could be strength out of Europe, more QE from just about anywhere else or “risk on” buying accompanying an equities rally.

I haven’t expected large upward moves from gold or silver but the short position in the physical market and ascent of activist central bankers in Japan and Britain could generate a good sized rally with a bit of a push.

Gold and silver moving back up could stop the bleeding in the juniors but it will take news flow and new discoveries to keep things moving.

In strict percentage terms, the current junior stock bear is milder than the last one but it doesn’t feel that way to traders. The main reason for that is longevity.

Screen shot 2013-02-26 at 4.53.40 PM

When the junior sector collapsed along with global markets in 2008 the drop was very steep and very fast. Stocks dropped 75% in the space of a few months. The bottom after that fall was brief, lasting a few weeks.

The fall so far this time (ignoring some intervening rallies) the bear market has been two years in the making. The bottom, assuming that is where we are, as been forming for close to eight months now.

There is no reliable way to determine how long a bottom will last. It could go on for a while longer, but I suspect it won’t. There are plenty of us sitting on underwater positions but there are also many with cash on the sidelines. Traders are getting bored and brokers are worried because they are not generating commissions. Both groups want to see something happen.

The most likely beneficiary of this situation will be companies with new discoveries that have not disappointed the market. The moves made by Goldquest and Reservoir last year indicate trader’s willingness to pile into a successful exploration play. There were a number of these in early 2009 that definitely contributed to the strength of that market. So far this year I have not seen one.

Companies with discoveries will get attention—those with discoveries that don’t need financing will receive even more. Pre discovery, attention will be focused on the strongest management groups and project sets.

In 2009 many predicted wholesale disappearance of junior companies. It didn’t happen because the financing window reopened fairly quickly. That hasn’t happened this time. I think the prediction of several hundred companies disappearing is much more likely to come to pass now. The only thing likely to hold it back is the TSX giving reprieves because it too is a public company now and wants to be able to book the potential listing fee revenues.

Short term painful but long term good. There are way too many junior explorers out there. Far too many companies did multiple spin out transactions of weak project sets they cannot finance now. There are only so many good projects and management/financing groups. I don’t know what the number is but it’s a lot less than the 2000 companies floating around out there.

Fading companies will hold back the Venture Index. Volumes are not bad over all compared to 2009. If gold can fight its way back to $1700 a base should be built and companies with good resources will see some gains. Like 2009 however, the best gains may be reserved for those with new discoveries. The intersection of hope and greed that new discoveries represent could be the catalyst so many have been waiting for. I’m hoping they start coming soon enough to finally make the market turn.

Ω

HRA Advisories, Resource Opportunities and the Oil & Gas Investments Bulletin are pleased to be hosting the annual Toronto Subscriber Investment Summit on Saturday, March 2nd, 2013 at the Royal York Hotel.

For the first time ever, we are opening a limited number of seats to the public. You will receive a full day of access to this private subscriber-only conference with your ticket purchase. This limited seating, exclusive event is designed to provide you with expert insight and specific investment strategies for today’s resource market, as well as access to some of the most undervalued public companies in the industry today. Don’t miss out on this rare opportunity to meet face-to-face with the experts and their top resource picks!

This event is a sell-out every year. Don’t miss out on your chance to participate!

Click Here to Register: http://www.subscriberinvestmentsummitpub.eventbrite.com/#

Published by Stockwork Consulting Ltd. Box 85909, Phoenix AZ , 85071 Toll Free 1-877-528-3958 hra@publishers-mgmt.com http://www.hraadvisory.com


Screen shot 2013-02-26 at 4.54.49 PM

The US Buck -The Key To it All

Are Correlations Between Currencies and Precious Metals Returning to Normalcy? 


We have been witnessing the abnormal situation in the intermarket correlations for quite some time now, i.e. positive correlation between dollar and gold and silver (or virtually no correlation at all) , and negative one between the general stock market and precious metals sector. Such a set-up is not the best from the precious metals perspective, as the overall medium-term outlook is bullish for stocks and bearish for dollar. But last week seems to have brought some important changes to the structure of correlations. Before we analyze them, let’s see what happened on the currency market last week – we’ll focus on the USD Index 

radomski february252013 1

On the very long-term chart we see a move above the declining long-term resistance line which normally would be a big deal. However, in the middle of last year when this happened, it was followed by an invalidation of the breakout and a subsequent decline. We expect to see the same thing here once again. Keep in mind that we have not seen a weekly close above this resistance line and really need to see several before stating that the breakout is truly confirmed.

Let us see how the medium-term perspective looks like.

radomski february252013 2

We include this chart in today’s article so that we could make some points about the head-and-shoulders pattern. We see that it is no longer perfectly symmetrical, but this does not invalidate the pattern. It could still be the case that a double right shoulder is forming. If the index declines below the 79 level, the pattern and the outlook will once again be just as bearish as if the breakdown took place last month.

Finally, let us take a looka at the short-term picture.

radomski february252013 3

In the short-term USD Index chart, we see the index right at its cyclical HYPERLINK “http://www.sunshineprofits.com/gold-silver/dictionary/turning-points/” \o “Cyclical turning points in gold and silver charts”turning point. The sharp rally this month brought the index to its November high and the last part of this rally severely exacerbated the decline of gold.

With the index at its November 2012 high, at a cyclical turning point, and with RSI levels above 70, a decline here is quite likely very soon if not immediately.

Let us take a look at gold and silver correlations to see how such a decline in the U.S. dollar could translate into precious metals prices.

radomski february252013 4

The Correlation Matrix is a tool which we have developed to analyze the impact of the currency markets and the general stock market upon the precious metals sector (namely gold & silver correlations). We continue to see some return to normalcy between the precious metals and the USD Index. Unfortunately the reason is that precious metals declined as the USD Index rallied. Of course, this must be considered a better scenario than if the metals had declined in price for no apparent reason. The indications are that when the USD Index reverses, the precious metals will do the same. With the USD Index at a cyclical turning point therefore, we could very well see higher prices for precious metals and mining stocks in the coming weeks.

We have mentioned the importance of cyclical turning points in the analysis of the currency markets and we would like to address one of our subscriber’s question regarding that matter, as this technique seems to raise doubts among our readers.

Q: Hi there, I was wondering if sometimes cyclical turning points just don’t happen at all. For example, we’ve been waiting for a cyclical turning point in the USD but it just hasn’t happened. And it now seems to be forming a right shoulder of a head-and-shoulders pattern. Is there a variable or certain rule about cyclical turning points that I don’t know about and would like to understand?

A: Yes, sometimes cyclical turning points just don’t happen – just like any technical tool. Good tools work most of the time and excellent tools can be expected to work 80% of the time or so (and it can be the case that something doesn’t work a few times in a row only to then work 20 times in a row). Expecting anything more than 80% is not really realistic and thus cyclical turning points also have to not happen at times. It still seems that they will work this time, though.

Summing up, the outlook remains bearish for the dollar. The implications from the currency markets appear quite bullish for the precious metals sector in the weeks ahead. 

Thank you for reading. Have a great and profitable week!

Przemyslaw Radomski, CFA

Founder, Editor-in-chief

PS. Today’s sharp pullback in gold is a very positive short-term sign. Please sign up for details (covered in today’s Market Alert).

http://www.sunshineprofits.com/” \o “gold investment & trading, silver investment & trading”Gold Investment & Trading Website – SunshineProfits.com


* * * * *


About Sunshine Profits


Sunshine Profits enables anyone to forecast market changes with a level of accuracy that was once only available to closed-door institutions. It provides free trial access to its best investment tools (including lists of best HYPERLINK “http://www.sunshineprofits.com/gold-silver/investment-tools/gold-stocks-ranking/” \o “gold mining stocks”gold stocks and HYPERLINK “http://www.sunshineprofits.com/gold-silver/investment-tools/silver-stock-ranking/” \o “silver mining stocks”silver stocks), proprietary HYPERLINK “http://www.sunshineprofits.com/gold-silver/charts/sp-indicators/” \o “gold indicator”gold & silver indicators, buy & sell signals, weekly newsletter, and more. HYPERLINK “http://www.sunshineprofits.com/gold-silver/services-overview/” \o “gold & silver services overview”Seeing is believing.


Disclaimer


All essays, research and information found above represent analyses and opinions of Przemyslaw Radomski, CFA and Sunshine Profits’ associates only. As such, it may prove wrong and be a subject to change without notice. Opinions and analyses were based on data available to authors of respective essays at the time of writing. Although the information provided above is based on careful research and sources that are believed to be accurate, Przemyslaw Radomski, CFA and his associates do not guarantee the accuracy or thoroughness of the data or information reported. The opinions published above are neither an offer nor a recommendation to purchase or sell any securities. Mr. Radomski is not a 

Déjà vu; is it 1937 all over again…..

 “a replay of 1937—a 50% market decline after a big rally from the low in 1932”

Quotable

“All through time, people have basically acted and reacted the same way in the market as a result of: greed, fear, ignorance, and hope. That is why the numerical (technical) formations and patterns recur on a constant basis.” – Jesse Livermore

Commentary & Analysis

Déjà vu; is it 1937 all over again?

We are not sure if we get a replay of 1937—a 50% market decline after a big rally from the low in 1932– but it feels a bit eerie to say the least. Now we have an extremely “overbought” stock market…false belief in a cyclical recovery…troubles in Europe…and rising tensions in Asia. I think a simple question is in order: Is risk skewed to the upside or downside? You know my answer.

Many attribute the big tax increase that took effect in 1937 as a major factor leading to another slowdown in the economy. Sound familiar? Big tax increases are biting into aggregate demand in 2013 thanks to the infinite wisdom of our Maximum Leaders who choose to punish initiative under the guise of “fairness.” It is to laugh! But it is what it is and we’ve seen it all before.

Screen shot 2013-02-26 at 7.54.31 AM

Quotable “Advertising is the rattling of a stick inside a swill bucket.”- George Orwell

Commentary & Analysis

Thank you China for validating our dollar bull market call.

I saw a promotional campaign several months ago from a newsletter company promoting a currency conference to be attended by various currency “experts.” The lead, if you can believe it, was, “Get the Hell Out of the Dollar.” It’s your typical scare tactic nonsense in order to sell services and push people into the one-trick pony multi-currency deposit accounts in order to prepare for the “plunging dollar.”

Remember how these multi-currency banks were loading their clients into the Icelandic krona to grab that “high yield” because it was the US dollar that was going to crash and burn from the rising global risk. Well, if you remember (and the multi-currency bankers wish you wouldn’t) it was the Icelandic krona that crashed and burned. I think if investors decide to “Get the Hell out of the Dollar,” they may be sorry. Why? Because even China is expressing some love for Mr. Greenie and citing the same fundamental rationales we have shared in these pages.

Black Swan’s long held call is the US dollar is in a multi-year bull market and it was triggered by the sea change global macro event called the credit crisis. If you peruse the chart below you will notice, with the gift of hindsight and my labeling, that prior multi-year trend changes in the US dollar index were accompanied by major global macro events.

Based on the US $ Index, the dollar bottomed in March 2008 and we are in the third bull market since President Nixon closed the gold window back in 1971 forcing major currencies to float against one another. [I believe the US dollar index has completed its third bear market in March of 2008; which incidentally was about seven years in duration as where the prior two bear markets.]

Screen shot 2013-02-26 at 8.05.06 AM

From Mr. Ambrose Evans-Pritchard, “China loves the US dollar again as America roars back:”

“Jin Zhongxia, head of the central bank’s research institute, said America’s energy revolution and export revival had shaken up the global landscape and would lead to a stronger dollar over time. ‘The dollar’s global dominance will continue,’ he said.”

  • Dr Jin said the world was moving to a “1+4” system, with the greenback serving as the anchor of global payments, supplemented by “four smaller reserve currencies” – the euro, sterling, yen and yuan.
  • Compared with the euro area, the dollar zone has much greater resilience to shocks.
  • Citigroup said lower energy imports and the revival of chemical industries would cut the US current account deficit by three quarters, eliminating a key cause of dollar weakness.

I may be a stretch to expect America to “roar back.” But relative to its competitors the US could be the destination for an inordinate amount of foreign direct investment, not to mention the “on shoring” that is taking place (manufacturers moving back to the US from China).

Of course China may not love the dollar at all. But at this stage in the cycle, jawboning the dollar higher would help China in two ways: 1) It would help China’s exporters at the margin, as they are fighting for a lot of the same export market with the US; and 2) relatively lower commodities prices in dollar terms would also support China’s domestic- demand transition.

[Last year China and the US were on the top of the list of exporters, with an 8.0% and 4.5% increase in exports, respectively. The rest of the developed world countries and BRICs had negative export growth in 2012. Notably, German exports were off 4.5% in 2012.]

It has been a very choppy trade in the US dollar index:

Screen shot 2013-02-26 at 8.05.49 AM

Rule #1: Anything can happen.

But net-net the dollar has worked higher even though gold blew off to a new high in August 2011(suggesting the fiat problem is much more than just the US dollar). And given my view: 1) the euro crisis isn’t over, 2) Japan will succeed in weakening the yen further, 3) the British pound seems be a favorite short on the “stagflation” trade, and, 4) the commodity dollar complex seems to be breaking down a bit, I think it is fair to say it may not be time to “Get the Hell Out of the Dollar.”

Screen shot 2013-02-26 at 7.57.53 AM


BUSTED!

I’m simply referring to all the market myths that are about to be busted, by the markets themselves, and how so many analysts and investors are going to get caught with their pants down!

After all, there are so many market myths out there, that it’s not surprising the majority of investors lose money. They’ve been taught a whole bunch of garbage by talking heads in the media … by ignorant analysts who have never done their homework …

Screen shot 2013-02-25 at 4.18.12 PMAnd by brokers who only want to move your money around, regardless of whether you make money or lose money, but do it all via the easiest sales pitch they can come up with. And very often this is based on misguided information.

So today, I’m going to cover just three of the many myths that are about to be busted, yet again, by the markets. That way, you’ll be prepared to make money rather than lose money, and you’ll be able to fend off all the misinformation that’s out there.

In future Money and Markets columns, I’ll bust even more myths for you. With that said, let’s get started …

Myth #1: Rising interest rates are bad for the stock market, and declining interest rates are good.

How many times have you heard that declining rates are good for stocks? Or that rising rates are bad?

If you’re like any average investor, you’ve heard that theory literally hundreds, if not thousands, of times before. Tune into any media show today, and I’m sure you’ll hear it a dozen or more times in the course of a single day.

Most stock brokers, and the majority of analysts and newsletter editors, espouse the same causal relationship between interest rates and stock prices. Rising interest rates are bad, declining rates are good.

But the fact of the matter, the plain truth, is that it is precisely the opposite that is true. Rising rates are positive for stocks, and declining rates are not.

Consider just the last 13 years …

 From March 2000 to October 2002, the Federal Funds rate declined from 5.85 percent to 1.75 percent, and the Nasdaq plunged 78 percent. Put simply, stocks and interest rates went down together.

 From March 2003 to October 2007, the Federal Funds rate rose from 1.25 percent to 4.75 percent … and the Dow exploded higher, launching from 7,992 to 13,930, a 74.2 percent gain! In this case, stocks and interest rates went higher together.

Then the markets collapsed ? and so did interest rates, to record lows.

Think those are oddball, freak occurrences? Think again …

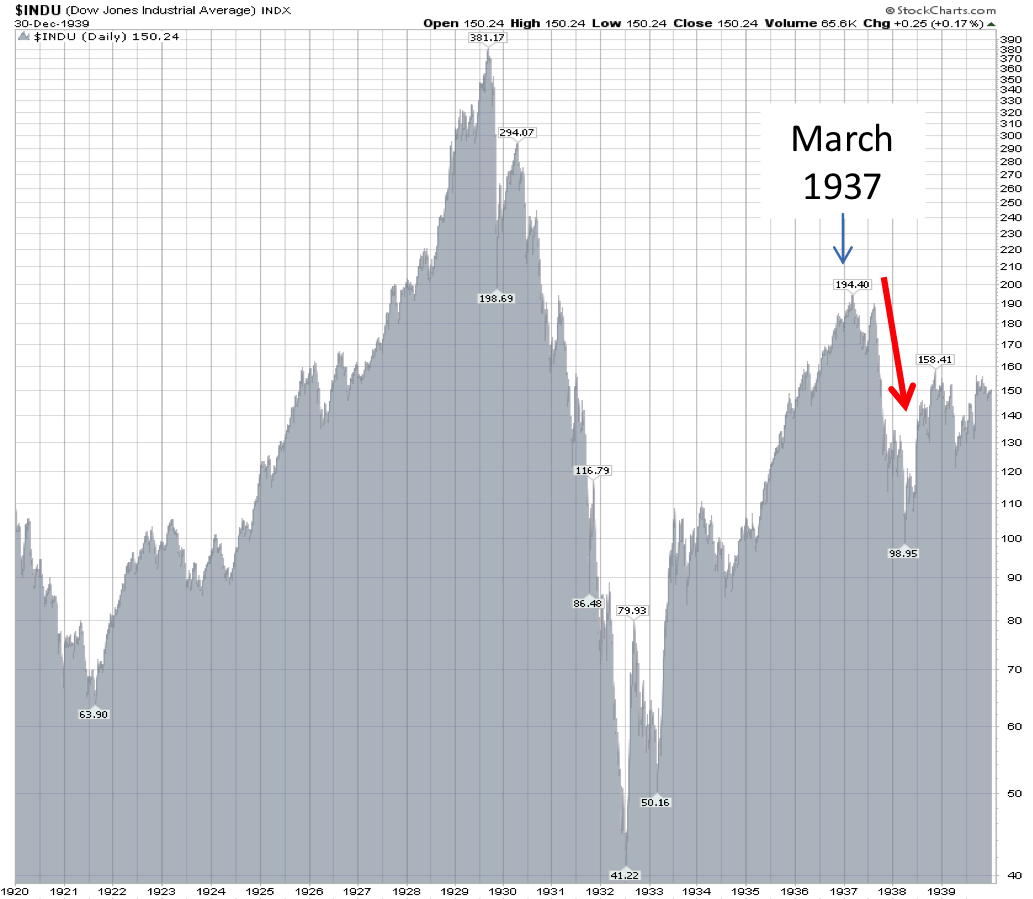
 From August 1929 to July 1932, the Fed’s discount rate fell from 6 percent to 2.5 percent, and the Dow Industrials plunged a whopping 87 percent.

 In Japan, from December 1989 to March 2003, the Bank of

Japan’s discount rate fell from 4.25 percent all the way down to 0.10 percent. And Japan’s Nikkei 225 Index? It plunged from nearly 40,000 in 1989 to 7,824 in March 2003, a loss of 80 percent.

The fact of the matter is that the relationship between interest rates and stock prices is exactly the opposite of what almost everyone, even the pros, preach.

A little logic teaches you why. When the demand for money and credit is increasing, no matter what the reason, so is the cost of money (interest rates).

And when demand and the cost of money is rising, stock prices should also do well.

Conversely, when an economy is sliding, the cost of money is also falling, as demand for credit contracts. Makes sense then that stock prices should also be weak, right along with the deflating cost of credit.

Very logical, right? But oh, how so very wrong almost all analysts and investors are when it comes to interest rates and stock prices!

Right now, for instance, almost everyone is telling you that if interest rates go up, that spells the death knell for stocks.

But rates have been going up and the Dow Industrials and the S&P 500 are hovering just below all-time record highs.

Meanwhile, other indices such as the S&P MidCap 400 and the Russell 2000 Index are already at record new highs.

The fact of the matter is that we are entering a period where capital is on the move again, in its endless search for a return on investment.

It’s not to be had right now in the sovereign bonds of Europe’s busted countries, in Japan, or in the U.S. ? so naturally, there’s tons of money heading into equities.

So simply keep in mind the following: The biggest, strongest equity bull markets have always occurred in a rising interest rate environment.

Myth #1. Busted!

Myth #2: Rising oil and energy prices are bearish for stocks. 

Just like the myth about interest rates, we’ve all heard this one before, many times too. The claim: The increasing cost of energy is a tax on consumers and squeezes corporate profits as well. Therefore, rising energy prices are bearish for stocks.

Makes sense, right? But consider this: There is no consistent relationship between energy prices and stock prices.

Sometimes energy prices are rising along with stock prices, and sometimes they decline together. The myth exists simply because the oil crisis of the 1970s still remains fresh in many investors’ minds. And for those who were too young at the time, because that’s what’s taught to them (wrongly): That rising oil and energy prices kill stock prices.

chart1

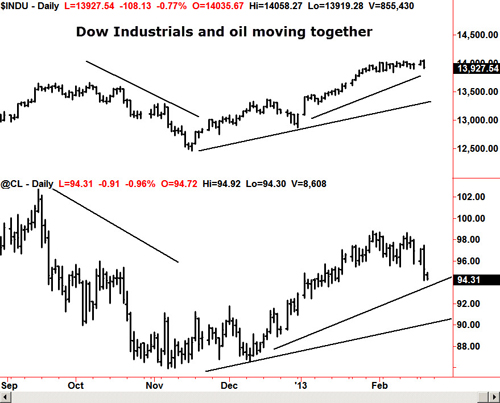
Click for larger version

The historical relationship between energy prices and stock prices tends to lean more towards a positive correlation.

Just like we’ve seen recently. You can see the clear positive correlation in the chart here.

As the Dow fell, so did oil prices. As it rose, so did oil prices.

Fact of the matter: Most strong equity markets are positively correlated to strong oil prices, and vice versa ? weak equity markets are associated with bearish energy prices.

Myth #2: Busted!

Myth #3: Rising interest rates are bad for gold.

As a gold bug, I love this one. It is true only some of the time, while a majority of time, the opposite is true: Rising interest rates are not negatively correlated with gold, but positively correlated!

Screen shot 2013-02-25 at 4.18.43 PM

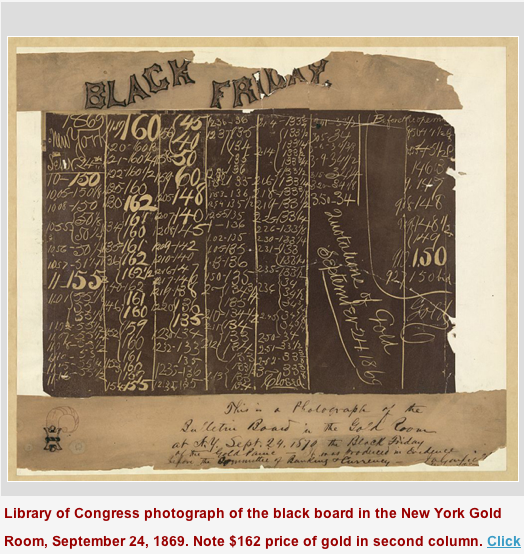
Consider the gold bull market of 1861 to 1869, where the price of gold soared in the free market from $20.67 to hit $162 on September 24, 1869 ? a 700 percent gain, and the equivalent of $2,760 in 2011 dollars.

All the while, long-term interest rates were rising, not falling, jumping from 5.24 percent in 1863 to 6.45 percent in 1869.

Or, consider the 1970′s gold bull market. Gold soared from just over $36 an ounce in 1970 to as high as $850 in 1980 ? precisely as interest rates exploded higher from 8.04 percent in 1970 to over 13 percent on the 10-year bond in 1980.

Guess what happened from 1980 on? As interest rates plunged, so did the price of gold.

Bottom line: The strongest bull markets in gold occur in rising interest rate environments, not in declining rate environments.

There are times when interest rates do matter in gold (and in other markets too). That’s when interest rates vastly exceed the inflation rate. When the real interest rate is substantially above inflation, it can do damage to equities and commodities.

But the simple fact is that we are nowhere near that point now. Real interest rates are still very negative based on the true inflation rate, and they have a very long way to go on the upside before they will even make a dent in any of the markets.

Until that time occurs, rising interest rates should be your signal that equities and commodities have much more to go on the upside.

So then, what about gold right now? Why is it still caught in a downtrend? Why is it falling like a rock, threatening to take out my next sell signal and move below $1,500? And why am I still bearish on gold, silver and commodities in general?

It has nothing at all to do with interest rates. It’s simply because virtually all commodities need more time to work off their prior bull legs higher, time to chew up and spit out the weak buyers, and time to move lower and consolidate before moving higher again.

And let me assure you, gold and other commodities will blast off again, and when they do, they will do so with rising interest rates.

Myth #3: Busted!

So please, don’t get caught up in any of the three aforementioned market myths.

If you do, you are bound to either miss out entirely on huge opportunities, or worse, get caught on the wrong side of the markets, busted, with your pants down.

Best wishes,

Larry

P.S. A mere $89 a year will get you all, and I mean ALL, of my insights, analysis and recommendations, via my Real Wealth ReportTo join, simply click here now.


Gold & Silver: ” I Continue To Suggest a Sidelines Approach

Peter addresses Gold, Silver, Real Estate, Gold Exploration & your Children (From “Things” on Peter’s Grandich.com Website – Ed)
 
1. I continue to suggest a sidelines approach to gold until further notice. The bears are on offense and while the bulls defense has
    stopped them in the pass, that was then and this is now (and Bill Murphy is not Ray Lewis-lol).
 
 
3. Donald Coxe: Total Disconnect in Gold Exploration Funding 
    BMO advisor Don Coxe has coined the expression “Weakness is Strength” to  
    describe the current economic situation.


Attention American and Canadian Readers

by Peter Grandich

I’ve often spoken about the belief that traditional financial planning (what 99% of all investors use some version of) is a flawed process and can’t end up working in the long run for most.

I touch on this in my book “Confessions of a Wall Street Whiz Kid” in chapter 12. Here’s a link to a free pdf copy of the book.

Another hot-button topic of mine is about retirement and the illusion the financial industry has created about it in order to capture your assets under their supposed “care” to make your latter years nothing but joy. You may not like what I’m about to say but I find it to be 100% true – THERE’S LITTLE OR NO GOLD IN THE GOLDEN YEARS! And much of the strategies used by the financial services industry are very much more likely to benefit them far more than you!

If you’re a resident of North America, I may be able to assist you in a process that’s best suited for household incomes of $150,000+ a year and (or) a net worth of $1M+

We’re about to enter a period unlike any other and besides death and taxes being a sure thing, I know in my heart the masses will be seriously impacted by it. If I’m right and you’re doing what the masses are doing thanks to the financial industry north and south of the border, what does that say about your future?

Please email me at peter@grandich.com to learn more about a process that offers increased wealth, with less risk and no sacrifice to lifestyle. Please note American or Canadian resident.


test-php-789