
Energy & Commodities
When I was a kid, I used to watch the World Wrestling Federation religiously.
I couldn’t wait for the show to air at 4 o’clock on Saturday afternoons…
My favorite wrestler was Rowdy Roddy Piper. He wasn’t exceptionally gifted as an athlete, but man, he was a great entertainer. My favorite quote from him is: “Just when you think you know the answer, I change the question.”
That phrase can be applied to the current state of the American oil and gas industry.
It’s changing at an exponential rate. Here’s what I mean…
I want you to take a good, long look at this picture:

What you see are well pads, leveled and cleared to make way for drilling equipment.
My untrained eye tells me there are at least 100 pads being prepared in this photo. And this is just a snapshot of a much bigger picture.
Oil drillers are gearing up for an absolute bonanza here. And if they hit paydirt, this region of the globe could become one of the most prolific oil-producing regions the world over.
So, where was this photo taken?

Believe it or not, it’s in our own backyard.
It’s the Permian Basin in West Texas.
As I told you last month in an article published in Energy and Capital, the Permian has been a cradle of oil drilling since 1921, producing 32 billion barrels to date.
However, experts forecast that with the discovery of the Cline Shale within the Permian — coupled with the application of multi-well pad drilling — the Permian has the ability to produce another 32 billion barrels. Or even more.
The March 2013 cover of National Geographic says it all:

No offense to National Geographic, but we scooped them seven years ago.
The fracking boom started in earnest in 2008, but it’s just starting to heat up…
Last month the EIA published new numbers for U.S. oil production for the month of January 2013. The EIA report showed Texas produced an average of 2.26 million barrels per day (bpd) in January, the highest daily output for Texas since 1986. (I was a junior in high school that year… now my oldest son is the same age. That’show long ago it was.)
At that production rate, Texas alone produced more oil than OPEC members Algeria, Libya, Angola, Ecuador, Nigeria, and Qatar — and it’s closing in fast on Kuwait, Venezuela, and the UAE.
But even this fact doesn’t represent how dramatic and swift the reversal of fortune has been for the Texas oil industry…
You see, Texas oil production increased by 30% in January from a year earlier — and by 75% from two years ago. In fact, oil production in Texas has achieved a clean double in the last three years!
Texas is literally booming. And the positive effects are being felt everywhere. The state added over 80,000 jobs in the month of February.
This trend is accelerating at light speed, and it’s having an impact not just in the States, but globally. According to CNBC this past Monday:
Without fanfare, China passed the United States in December to become the world’s leading importer of oil-the first time in nearly 40 years that the U.S. didn’t own that dubious distinction. That same month, North Dakota, Ohio and Pennsylvania together produced 1.5 million barrels of oil a day–more than Iran exported.
As those data points demonstrate, a dramatic shift is occurring in how energy is being produced and consumed around the world-one that could lead to far-reaching changes in the geopolitical order.
U.S. policy makers, intelligence analysts and other experts are just beginning to grapple with the ramifications of such a change, which could bring with it both great benefits for the U.S. and potentially dangerous consequences, including the risk of upheaval in countries and regions heavily dependent on oil exports.
Most agree the U.S. would be the big winner, in position to reshape its foreign policy and boost its global influence.
Like I’ve said before, technology and innovation always win the day.
And multi-well pad drilling is a game changer.
Because oil and gas companies can drill 8 to 24 (sometimes more than 50) wells from a single pad site, more oil and gas are accessible from a single drill rig, reducing time and costs.
Just how is this playing out in the real world?
The United States is producing more natural gas today with less than 400 drill rigs than it did in 2008, when there were over 1,600 drill rigs in operation in the United States. This is the drilling equivalent of Moore’s Law.
But here’s the deal: There’s no sign that it’s about to stop any time soon…
Multi-well pad drilling is becoming the new normal. Here’s how we’re playing it.
Forever wealth,

Brian Hicks
Brian is a founding member and President of Angel Publishing and investment director for the income and dividend newsletter The Wealth Advisory. He writes about general investment strategies for Wealth Daily and Energy and Capital. Known as the “original bull on America,” Brian is also the author of Profit from the Peak: The End of Oil and the Greatest Investment Event of the Century, published in 2008. In addition to writing about the economy, investments and politics, Brian is also a frequent guest on CNBC, Bloomberg, Fox, and countless radio shows. For more on Brian, take a look at his editor’s page.

After the panic in Cyprus and ongoing worries over Ben Bernanke’s commitment to print ourselves into oblivion, gold and silver will be among the best investments going forward.
And while holding physical metals is prudent, I’ve uncovered a secret “gold loophole” that allows you to grab much bigger, faster gains in the gold market today.
Understand, this has nothing to do with options or ETFs …
But everything to do with how China is buying its gold and silver on the open market today.
You see, China implemented a very simple plan to ensure global domination.
And for their first step, they’re taking steps to monopolize the gold supply around the world.
China is smart. They know that they will soon have the economic power to take over the role as the world’s reserve currency, but …
They also know the Chinese currency — the yuan — will never beat the U.S. dollar if it’s nothing more than another “fiat” currency … that is, a currency backed with nothing but empty promises.
So instead, during the last few years China has been secretly stockpiling gold with the intent of creating something that’s been missing from the global economy for 30 years … a gold-backed reserve currency.
According to a recent Forbes article, “China is preparing for a world beyond the inconvertible paper dollar — a world in which the renminbi, buttressed by gold, becomes the dominant reserve currency.”
A Golden Tsunami
China is importing so much gold that they can’t purchase any more on the open market for fear of bidding up the prices.
But that hasn’t stopped them for a second.
They’ve even found a new way to add to their reserves … buying gold mines across the globe.
Let me give you some examples:
- In August 2010, China Gold International put in a $742 million bid to buy Skyland Mining …
- In November 2011, Zijin Mining Group put in a $227 million bid to buy Gold Eagle mining …
- In August 2011, Stone Resources put in a bid to take control of Crescent Gold, an Australian gold miner.
- In November 2011, Baiyin Nonferrous Metal Group bid on the South African miner, Gold One International.
- And in April 2012, Sovereign Gold partnered with Jiangsu Geology & Engineering to buy two gold mines in Australia.
This is just a sampling of the moves I’ve uncovered that Chinese national gold miners have engaged in.
How Can You Profit?
Find out TODAY — Thursday, April 4 at noon Eastern.
That’s when our in-house resource expert Sean Brodrick is hosting an intimate teleconference with one of the premier precious metals investment managers of our time, Rick Rule.
And as an Uncommon Wisdom Daily subscriber, you can join them for free. Don’t miss out on this intimate chat on the future of gold and other precious metals prices that includes …
Rick’s Outlook on Gold Prices: It’s clear gold’s in a long-term bull market but prices have recently pulled back. So, where are we in the current bull market and where are prices headed over the next few months?
Reckless Money Printing: Will the dollar crash and burn over the next few months … and how will a re-emerging European crisis affect gold prices?
How will the price of gold impact the gold miners? And where are the best opportunities right now in this explosive sector?
Plus, Sean will ask Rick to reveal the top five gold companies he’s buying right now!
If you’ve already signed up to attend this premier investing event, you’re all set. Now, all you have to do is …
//www.gliq.com/cgi-bin/click?weiss_uwd+JRM-PGF-countdown+UWD1300+vgbb@shaw.ca+g446+5573101“>Click on this link shortly before noon and you’ll be tuned in to this private teleconference between Sean Brodrick and Rick Rule when it begins!
All the best,
Brad Hoppman

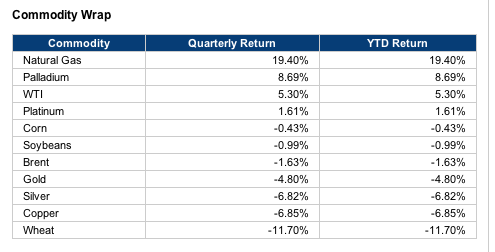
We examine the latest developments in commodity markets.
Commodities saw notably divergent performance during the first quarter of the year. Natural gas, palladium and WTI performed particularly well, while gold, silver, copper, and wheat tumbled. Stocks, as measured by the S&P 500, advanced an impressive 9.7 percent in the period.
Macroeconomic Highlights
The quarter was a strong one from the perspective of investor appetite for risk. Catapulted by the resolution of the U.S. “fiscal cliff” at the start of the year, stocks climbed steadily throughout the period. Though the “sequester,” or $85 billion worth of automatic government spending cuts, went into effect, it did little to derail the rally. With political intransigence no longer an issue, investors were able to focus on the emerging strength in the U.S. economy.
The data have been unquestionably bullish. Housing indicators for sales, construction and prices are at the highest levels since 2008 or 2009, while the unemployment rate is similarly at the lowest level in four years.
At the same time, the Federal Reserve has maintained its ultra-loose monetary policies, pledging to continue its $85 billion worth of monthly bond purchases until the unemployment rate falls even further.
But while the U.S. has been a bright spot in the global economy, elsewhere, things aren’t as rosy. China’s growth remains rather tepid, with expectations that the Asian giant will grow somewhere in the range of 7.5 to 8 percent this year. That has dampened demand growth for commodities such as copper, oil and soybeans and is likely why prices suffered thus far this year.
Europe is also a drag. The banking crisis in Cyprus is just the latest indication that the eurozone is not out of the woods when it comes to its debt problems. While far from the record levels set in 2011, Italian and Spanish bond yields are relatively high near 5 percent, suggesting that markets remain concerned about the debt burden in those countries.
…….read page 2,3,4,5 or Full Article
Farmers have been taking on mounting debt, creating an unsustainable increase in land prices and risking a crash that would ripple through our economy.
Eeyore should have been a farmer. It’s almost impossible to find a farmer happy about his situation. The weather’s too hot, cold, wet, or dry, and prices are too low or too high, depending on whether we’re buying or selling. We can’t, at least in front of our peers, admit to prosperity or even the chance of prosperity. Although we’d never admit it at the local coffee shop, the last few years have been good, at least for Midwestern grain farmers. Prices have been strong — strong enough to make up for much of the production lost to last year’s drought. That’s terrible news for livestock producers, who’ve been faced with drought-damaged pastures and high feed costs, but for farmers producing corn and soybeans, it has been a profitable few years.
…..read the entire article HERE

Last week’s chart illustrated how the US stock market (as measured by the S&P 500) has outperformed other major international stock markets since the financial crisis. For some further perspective on the post-financial crisis rally, today’s chart illustrates how much of the downturn that occurred as a result of the financial crisis has been retraced by each of the five major US stock market indexes. For example, the S&P 500 peaked at 1,565.15 back in October 9, 2007 and troughed at 676.53 back on March 9, 2009. The most recent close for the S&P 500 is 1,570.25 — it has retraced 100.6% of its financial crisis bear market decline. As today’s chart illustrates, each of these five major stock market indices has recouped all losses incurred during the financial crisis (i.e. all are above 100% on today’s chart). However, it has been the often overlooked S&P 400 (mid-cap stocks) that has been the star performer. The S&P 400 has recouped over 140% of its financial crisis decline — a very impressive performance.
Notes:
Where should you invest? The answer may surprise you. Find out right now with the exclusive & Barron’s recommended charts of Chart of the Day Plus.

Quote of the Day
“Over every mountain there is a path, although it may not be seen from the valley.” – Theodore Roethke
Events of the Day
April 08, 2013 – NCAA men’s basketball championship
April 09, 2013 – NCAA women’s basketball championship
April 11, 2013 – Masters golf tournament begins (ends April 14th)
April 15, 2013 – Personal income taxes due (US) – Pulitzer Prizes announced – Boston Marathon
Stocks of the Day
— Find out which stocks investors are focused on with the most active stocks today.
— Which stocks are making big money? Find out with the biggest stock gainers today.
— What are the largest companies? Find out with the largest companies by market cap.
— Which stocks are the biggest dividend payers? Find out with the highest dividend paying stocks.
— You can also quickly review the performance, dividend yield and market capitalization for each of the Dow Jones Industrial Average Companies as well as for each of the S&P 500 Companies.
Mailing List Info
Chart of the Day is FREE to anyone who subscribes.
To ensure email delivery of Chart of the Day, add mailinglist@chartoftheday.com to your whitelist.


-
I know Mike is a very solid investor and respect his opinions very much. So if he says pay attention to this or that - I will.
~ Dale G.
-
I've started managing my own investments so view Michael's site as a one-stop shop from which to get information and perspectives.
~ Dave E.
-
Michael offers easy reading, honest, common sense information that anyone can use in a practical manner.
~ der_al.
-
A sane voice in a scrambled investment world.
~ Ed R.
Inside Edge Pro Contributors

Greg Weldon

Josef Schachter

Tyler Bollhorn

Ryan Irvine

Paul Beattie

Martin Straith

Patrick Ceresna

Mark Leibovit

James Thorne

Victor Adair