
Stocks & Equities
With the S&P 500 hitting an all-time high, stocks have been stealing the headlines. But behind the scenes, there is a market that is just as hot.
And when this market accelerates as it did in early 2008, prices can easily jump 50% in a few months. Take a look at the big move below.

This is a chart of West Texas Intermediate [WTI] crude oil prices. Crude oil just logged its best five-day run in eight months, trading near the key $100 level.
That bullish movement has been driven by big institutional investors sending capital into commodities, with hedge and fund managers increasing their net long positions across a basket of 18 U.S. futures and options markets by 10% in the week ended March 26. That mirrors a larger trend, with bets on commodities up 67% in the past three weeks, the biggest gain since May 2009. And one of the biggest destinations of those bets is into crude.
That’s because peak consumption in the spring and summer is right around the corner, and the smart money is betting prices will move higher. With monetary stimulation from the central banks of the world fueling potential inflation, the stage is set for crude to make another run to its all-time high above $147 per barrel this summer.
Buying a crude-oil exchange-traded fund such as Powershares DB Oil (NYSE: DBO) is a good way to profit from rising oil prices, as demonstrated in the chart above. But there’s a better way: Buyshares in exploration and production (E&P) companies that own and extract the commodity from the ground. [These are the special kinds of stocks and opportunities that my colleague Nathan Slaughter looks for in his Junior Resource Advisor newsletter.]
Exploration companies provide unparalleled leverage to crude prices, reaping huge gains in sales andearnings when prices surge higher.
But the group has been under pressure in the past two years after energy stocks collapsed in the spring of 2011. That has E&P stocks trading at record low valuations and carrying big-time dividend yields.
Here are seven E&P stocks with yields up to 9%.

From this group, I like Breitburn Energy Partners (Nasdaq: BBEP)because of its outsized dividend yield, and Atlas Resource Partners (NYSE: ARP) because of its earnings power.
Breitburn Energy Partners
Breitburn explores and produces oil in Texas, California, Wyoming, Indiana and Kentucky. The company also explores for natural gas, providing additional leverage to another growing segment of the global energy market.
Despite the S&P 500’s big gains in the past two years, Breitburn’s shares are down 7% during the same period. No doubt that has a lot to do with crude trading mostly sideways and natural gas falling sharply. But with both markets on the mend, higher crude and gas prices would be a boon to the company.
Analysts are looking for earnings per share [EPS] of 86 cents in 2013 and 96 cents in 2014. That has shares trading with a forward price-to-earnings (P/E) ratio of 23, a slight premium to its peer average of 19. But when you add in the dividend yield of 9.4%, Breitburn offers strong growth and income.
Atlas Resource Partners
Atlas Resource Partners explores and produces with interests in some of the biggest and most lucrative energy properties in the country. That includes assets in the Barnett and Marcellus shale plays, two of the largest shale formations in the country. Atlas has also been struggling, with shares down 17% in the past year.

But with analysts expecting EPS of $1.15 in 2013 and $1.61 in 2014, that has sweetened the valuation picture considerably. As it stands, Atlas’s forward P/E of 21 is a sharp discount to its 10-year average of 33. And when you throw in a hefty dividend yield of 8%, there is compelling value and income to be had.
Risks to Consider: Oil E&P stocks are some of the most sensitive energy stocks in the market. Any signs of slower GDP growth or weakness in the global economy will weigh on the group heavily.
Crude just logged its best five-day run in eight months. That’s a bullish signal heading into spring and summer, which are peak seasons for consumption. These seven E&P stocks stand to benefit the most from higher crude prices, but the group still trades at historically low valuations after falling sharply in the past two years. My favorites are Breitburn Energy Partners because of its outsize dividend yield and Atlas Resource Partners because of its bullish earnings growth projection.
Get BTE articles by email alert HERE

The cyclical bear market in Silver is serving its purpose. Its correcting and digesting the 6-fold advance that took place in less than two and a half years. A similar correction took place in the mid 1970s that led to the parabolic move to $50. Amazingly, if you line up Silver’s performance from its 1971 low to 1980 high with Silver’s performance since its 2008 bottom, you’ll notice strong parallels.
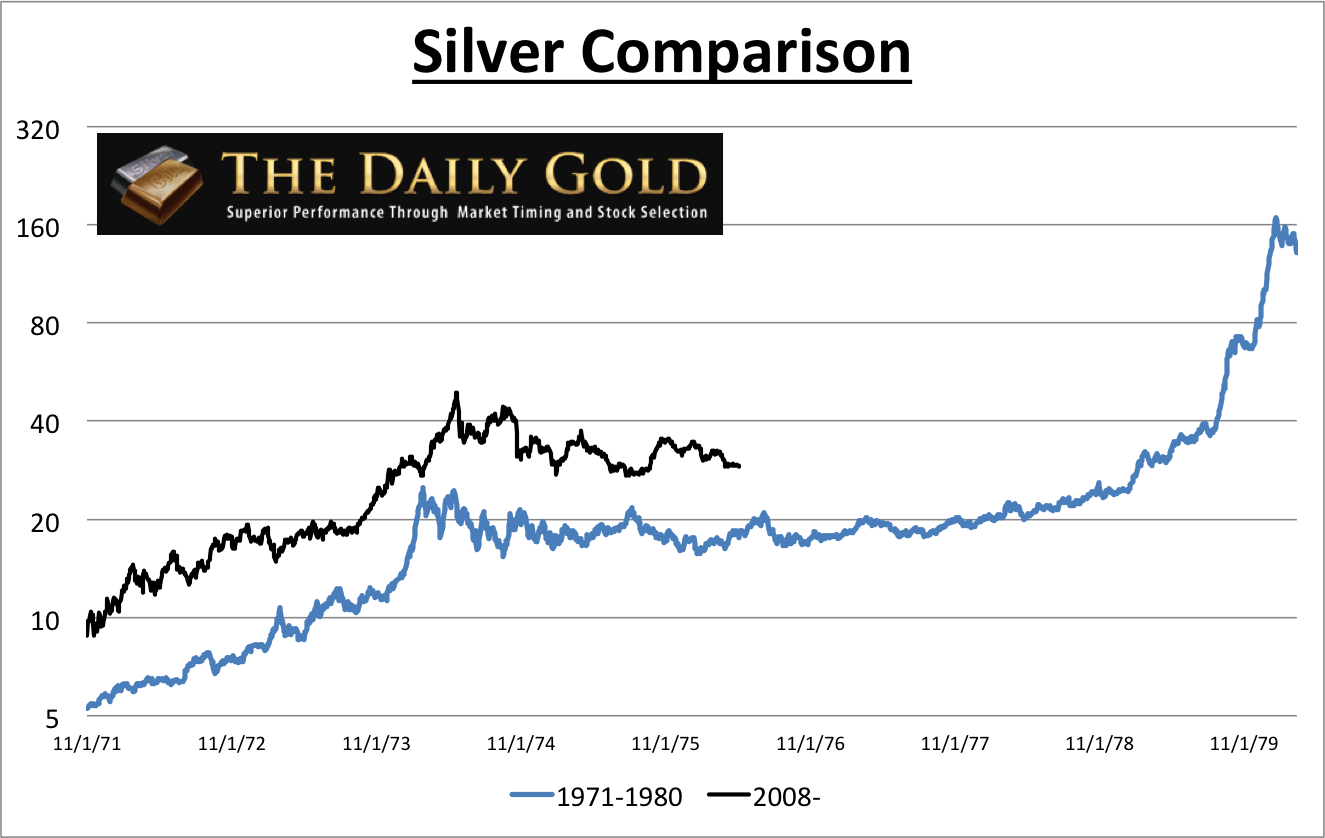
(Note that the blue prices are rescaled). The initial bull run was stronger, lasted a few more months and that could be why the current correction is slightly deeper. Nevertheless, look at how similar the two are!
Its important to note that huge moves require long periods of digestion and correction. Commodities typically encounter near vertical moves that are sprung from deeply oversold conditions or multi-year consolidations. The two initial advances on the chart are quite similar and that is a reason why the ensuing corrections are similar.
Moving along, Silver is at an interesting juncture as it continues to hang above multi-year support at $26 amid persistent extreme bearish sentiment. This chart from Tiho Brkan shows that gross speculative short positions are at their highest levels in decades. The short positions are potential fuel for a sharp rebound.
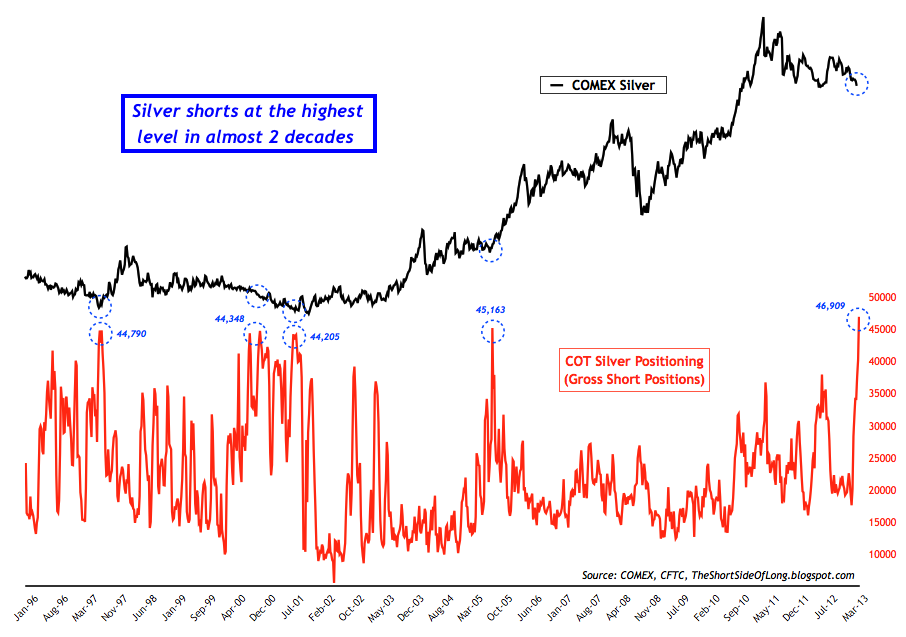
Furthermore, last week public opinion (an amalgamation of a handful of surveys courtesy ofsentimentrader.com) reached the lowest level since at least 2004.
Following its run in the early 1970s, it took Silver three and a half years to begin its next run and five years to make its next high. It has been about two years since Silver’s last peak. Huge advances require quarters and years of digestion. This is how markets work. It’s not manipulation or a fake market as some say.
The good news is the short-term outlook is favorable. Precious metals markets have yet to put in a bottom but each new day brings us closer. While Silver won’t touch $50 anytime soon (or even $40), a rebound to $35 would be quite substantial in percentage terms. Most Silver stocks would rise well over 50%.
The long-term trend and fundamentals remain intact for both Silver and Gold. Day traders and reporters will tell you there is no sovereign debt bubble or threat of inflation but, as Kyle Bass recently pointed out that can change very quickly. Remember the financial crisis? Look at the charts of financial stocks. They were fine for many years and then fell off a cliff within a year. There were people who, in the middle of 2008 thought we weren’t even going to have a recession! Most never learn.
I suspect the major catalyst will occur when governments lose control of their own bond markets. They have to continue to print money for years and it will be a major catalyst for Gold & Silver when bond markets go the other way. This could be the catalyst for Silver eventually breaking $50 and reaching triple digits. Currently, quality gold and silver miners (mostly not in GDX or GDX) are trading well off their highs and at their lowest valuations in quite a while. If you’d be interested in professional guidance in uncovering the producers and explorers poised for big gains in the next few years then we invite you to learn more about our service.
Charts to provide perspective for gold bulls
 Most chartists use daily or weekly charts. Few look at monthly charts. I don’t know of anyone (myself included) who pays any attention to quarterly charts. We decided to take a look at the quarterly chart of the HUI gold bugs index. It is below and we note the two big downturns in the market. Also note the importance of 300, which has been support for the past seven years.
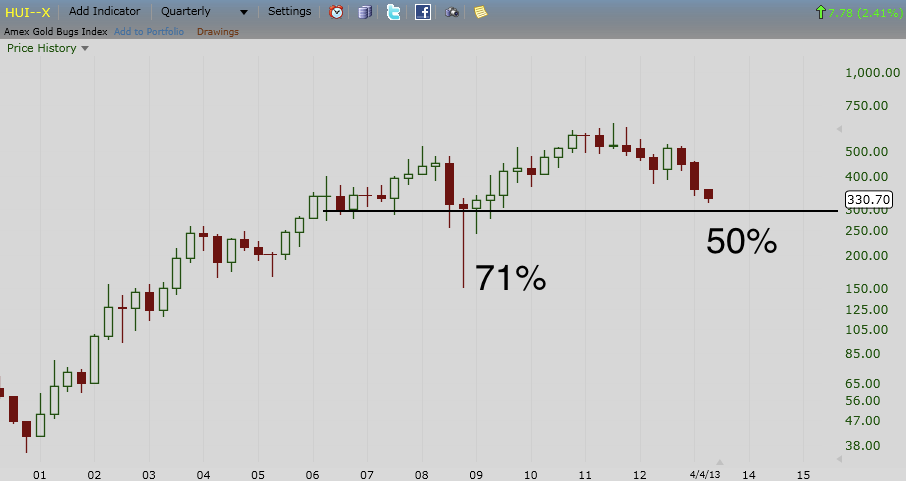
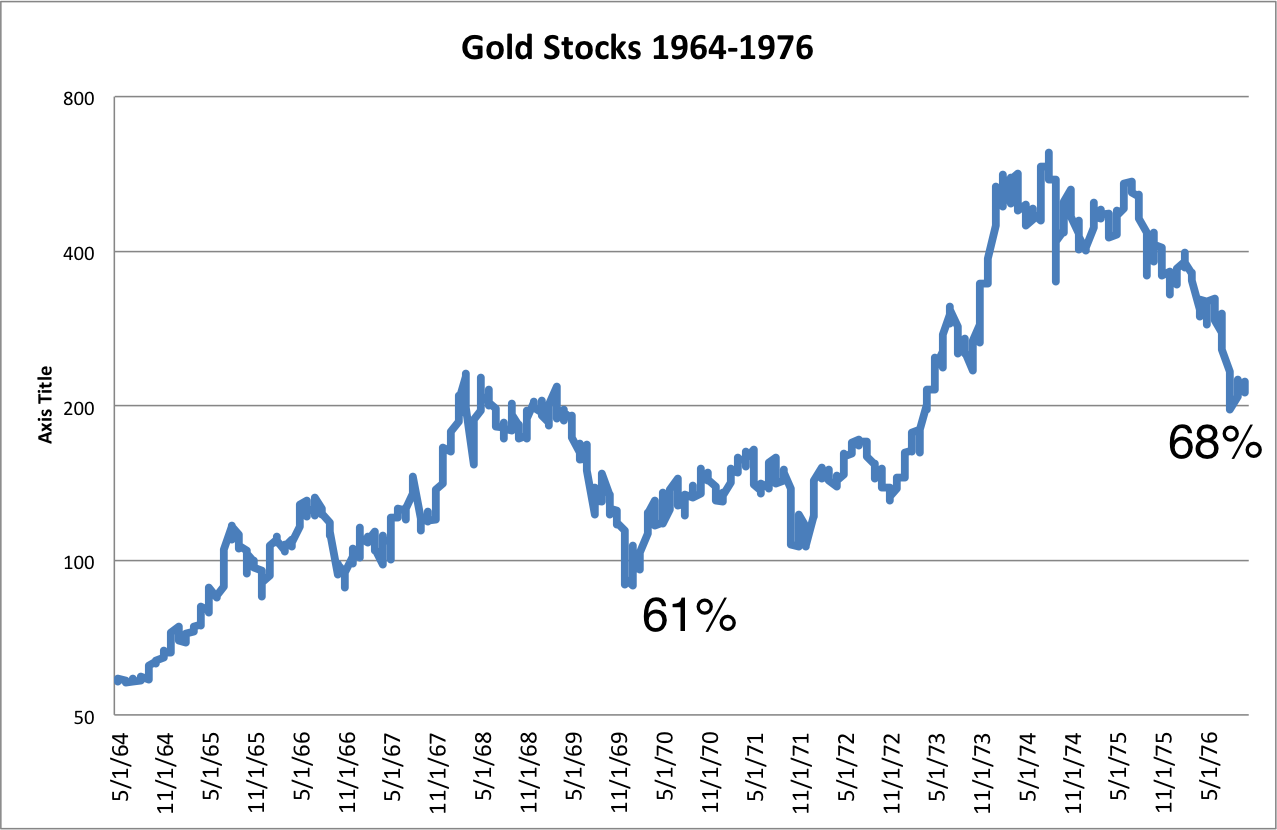
Some have chided your humble author for saying that the gold stocks are still in a bull market. After all, these two big downturns invalidate any assertion of a bull market. Right? Well, the previous bull market in gold stocks also included two large downturns. Within the 1960 to 1980 bull market, the first correction was 61% and lasted about two years. The next correction was 68% and also lasted about two years.
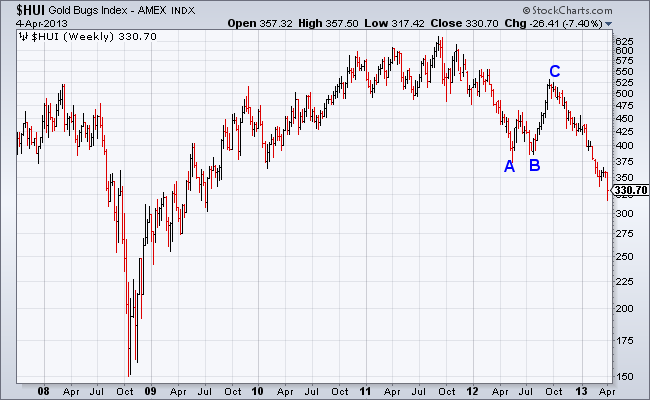
Even more intriguing is the similarities between the gold stocks over the past five years and the Nasdaq from 1987 to 1990. Both markets crashed and then quickly recovered to a new marginal high. Furthermore, note the price action in the Nasdaq during late 1989 to 1990 and compare it to the price action of the gold stocks over the past 15 months.
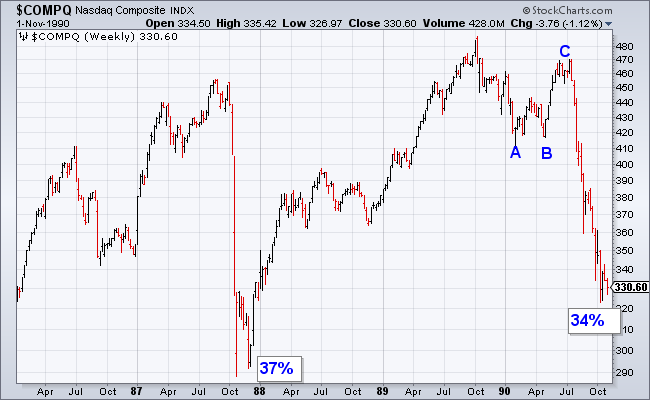
Like the Nasdaq, the HUI formed a bullish double bottom (A,B) and advanced quickly and strongly. Both markets then fell apart. The Nasdaq declined 31% in only a few months. That was almost as bad as the first crash! The gold stocks have declined about 40% in the last six months.
After its bottom in 1990 the Nasdaq gained nearly 16-fold over the next 10 years. Following its second massive downturn within the 1960-1980 secular bull market, the Barron’s Gold Mining Index advanced nearly 7-fold in the next six years. This is not to say that the gold stocks are likely to repeat the same pattern. This is to show that there is a strong historical precedent for the current downturn to occur in the context of a major bull market.
Ok, I know what you thinking. Jordan, why didn’t you provide this analysis weeks or months ago? The answer is, we’ve been aware of these charts and that is one of many reasons why we’ve slowly “scaled into” positions. We’ve told premium subscribers what our favorites are and how we plan to scale into and build those positions over the spring and summer months. On March 1 we wrote: As for the short-term, we began scaling into positions last week but maintain plenty of cash to be deployed (potentially) at our strong targets of HUI 336 and HUI 300.
Currently, the market remains in a bottoming process. We don’t know if Thursday’s low at 317 marked the bottom or not. Judging from the quarterly chart it looks like we could see a test of 300 or a temporary break of that level. On the other hand, Wednesday’s selloff occurred on record volume and Thursday’s reversal was quite strong. There is a chance a small head and shoulders bottom could be developing. Strong follow through on Friday would certainly raise the odds that 317 was an important low.
In any event, we are moving closer and closer to a major bottom and a large rebound in percentage terms. Weeks ago we noted the extreme pessimism in Gold was beyond the 2008 low by most metrics. Sentiment towards gold stocks is even worse. Traders and momentum players think the sector is one big joke. Mainstream funds who have the slightest interest in the sector are focusing on the metals and not the shares. I can’t recall a sector that has ever been this hated within a secular bear market. It is quite amazing. That aside, we are quite confident that the sector is days to a few weeks away from the start of a very strong rebound. Be advised that there are hundreds of mining stocks and stock selection is critical to achieving strong returns.
Good Luck!
Jordan Roy-Byrne, CMT


We are now at the point in the bull market where traders think that stocks are bullet proof. Back in December I warned this was coming. I said at the time that this round of QE was going to be different. That it would have a much bigger effect on the market than the analysts were expecting. I remember at the time analysts were claiming each round of QE was having less and less effect.
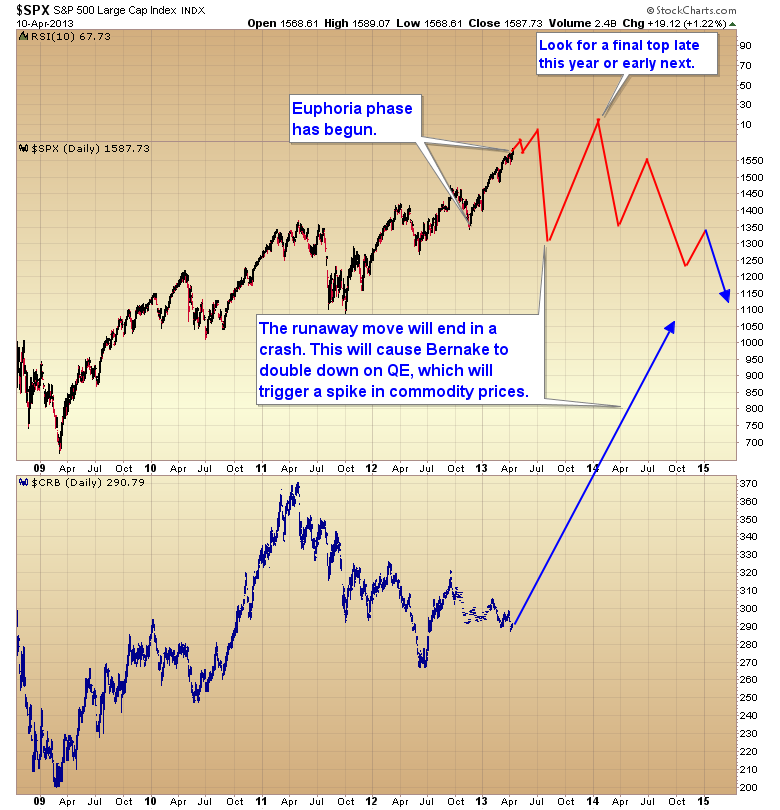
I was confident that QE3 & 4 would usher in the euphoria phase of the bull market. Actually Bernanke is putting in place the final components to bring about the end of the bull. Let me explain….read it all HERE
…..


The regular readers of this newsletter will know that I have been bullish on the markets for some time, but that is changing. The S&P 500 reached an all time intra-day high on April 10th, but the rally may not last long and could possibly top out at the end of April or the beginning of May, as it has done in the last two years.
We are in the process of completing a three-peat – a strong market in the first four months of the year with the defensive sectors outperforming the cyclical sectors, for a third year in a row. We all know what happened in the last two summers. It has been interesting to note how many commentators have been on TV talking about how the defensive sectors have been outperforming the cyclicals and that this is bearish for the markets. I have discussed this phenomenon over the last three years, in the beginning part of each year. There is no question that it general, when the defensive sectors outperform, the market is becoming more conservative. This is true at any time of the year.
Seasonal analysis not only provides insight into the sectors of the market that are poised to outperform, but it also provides valuable information on the health of the market. When sectors of the market do not perform as expected, by following their seasonal trends, astute seasonal investors can use the information to determine if the market is poised for a rally, or setting up for a correction. In my April market video I discuss the phenomenon of the defensive sectors outperforming at the beginning of the year and state that is a concern and indicates a possible market correction, but we cannot tell if the correction is going to be next week or in the near future. In other words, defensive sector outperformance cannot be used as a timing indicator to make a portfolio decision. Nevertheless, it is valuable in raising concern to possible unfolding events.
Over the last two years and this year, at the beginning of the year, the defensive sectors have outperformed when the cyclical sectors typically outperform. So what is the big deal? The market is telling investors that the big money is “scared” as it is seeking safety at a time of the year when it would typically be chasing beta. The market cannot proceed higher over the long-term on the back of the defensive sectors alone. One of two events must happen: either a rotation out of the defensive sectors into the cyclical sectors must take place, which will keep the market moving higher, or the market must correct.
So what should we expect? How do the seasonal trends help us at this point? Currently, the cyclicals have had a couple of days of strong performance, outperforming the defensive sectors. This is very typical in the month of April (see the Thackray Sector Thermometer, Thackray’s 2013 Investor’s Guide, page 42). It is very possible that we will see a continuation of this trend in the next couple of weeks, which would not be out of the ordinary. If the defensive sectors gain control once again at this time, it would be indicating that a correction is close at hand. If the cyclicals continue to outperform, it would be a signal that the market still has a bit of life left and might rally into May.
Should we expect a massive rotation from the defensive sectors to the cyclical sectors over the next few months – NO. Although anything is possible, the seasonal trends do not support a sustained rotation into the cyclical sectors past the first week in May. In fact, if the cyclicals do outperform in the next few weeks, when they start to roll over, it will probably be a sign that the market is setting up for a correction. Investors beware.


-
I know Mike is a very solid investor and respect his opinions very much. So if he says pay attention to this or that - I will.
~ Dale G.
-
I've started managing my own investments so view Michael's site as a one-stop shop from which to get information and perspectives.
~ Dave E.
-
Michael offers easy reading, honest, common sense information that anyone can use in a practical manner.
~ der_al.
-
A sane voice in a scrambled investment world.
~ Ed R.
Inside Edge Pro Contributors

Greg Weldon

Josef Schachter

Tyler Bollhorn

Ryan Irvine

Paul Beattie

Martin Straith

Patrick Ceresna

Mark Leibovit

James Thorne

Victor Adair