

The cyclical bear market in Silver is serving its purpose. Its correcting and digesting the 6-fold advance that took place in less than two and a half years. A similar correction took place in the mid 1970s that led to the parabolic move to $50. Amazingly, if you line up Silver’s performance from its 1971 low to 1980 high with Silver’s performance since its 2008 bottom, you’ll notice strong parallels.
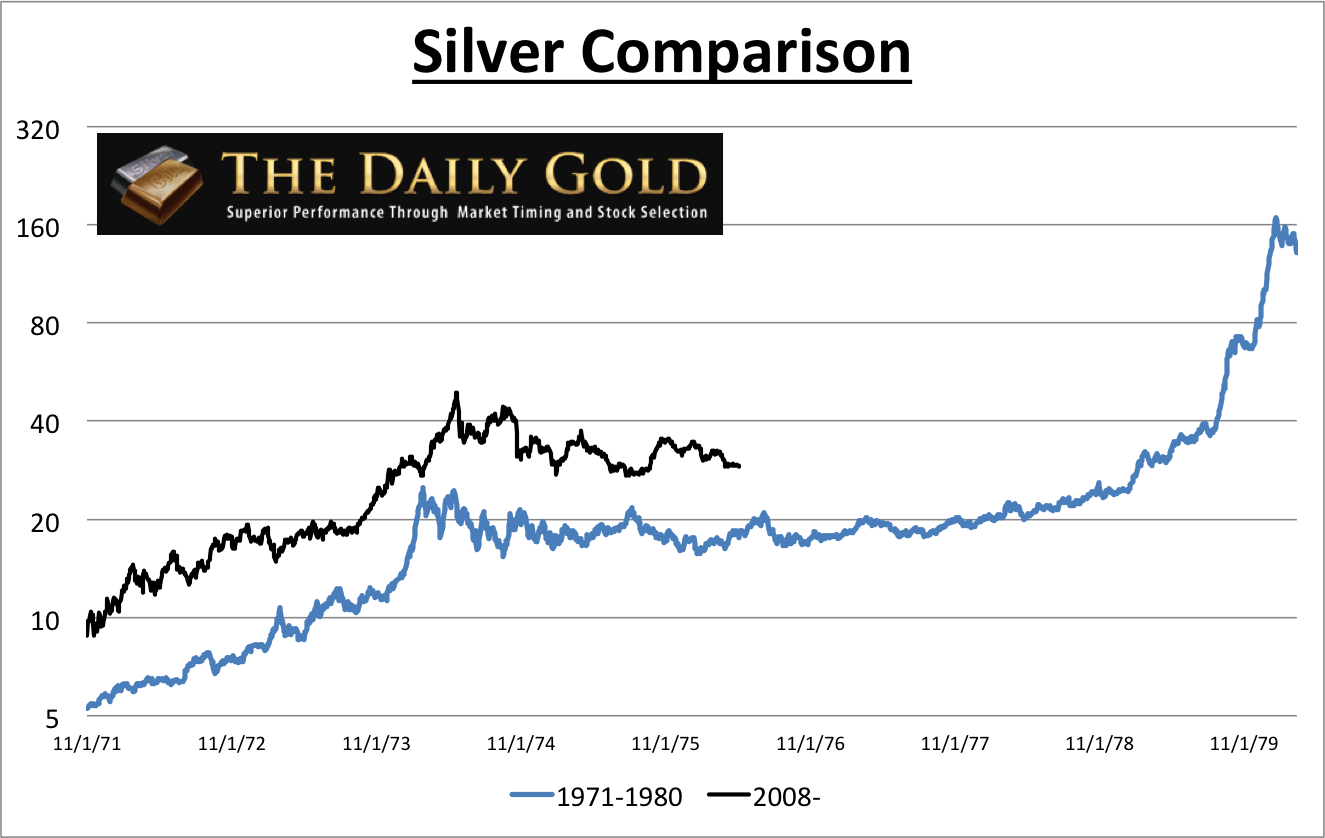
(Note that the blue prices are rescaled). The initial bull run was stronger, lasted a few more months and that could be why the current correction is slightly deeper. Nevertheless, look at how similar the two are!
Its important to note that huge moves require long periods of digestion and correction. Commodities typically encounter near vertical moves that are sprung from deeply oversold conditions or multi-year consolidations. The two initial advances on the chart are quite similar and that is a reason why the ensuing corrections are similar.
Moving along, Silver is at an interesting juncture as it continues to hang above multi-year support at $26 amid persistent extreme bearish sentiment. This chart from Tiho Brkan shows that gross speculative short positions are at their highest levels in decades. The short positions are potential fuel for a sharp rebound.
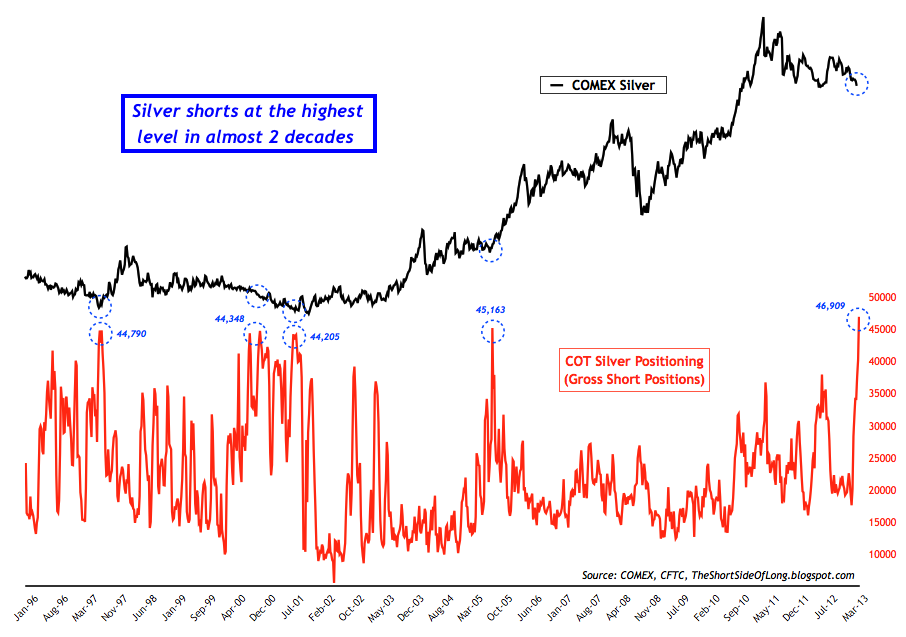
Furthermore, last week public opinion (an amalgamation of a handful of surveys courtesy ofsentimentrader.com) reached the lowest level since at least 2004.
Following its run in the early 1970s, it took Silver three and a half years to begin its next run and five years to make its next high. It has been about two years since Silver’s last peak. Huge advances require quarters and years of digestion. This is how markets work. It’s not manipulation or a fake market as some say.
The good news is the short-term outlook is favorable. Precious metals markets have yet to put in a bottom but each new day brings us closer. While Silver won’t touch $50 anytime soon (or even $40), a rebound to $35 would be quite substantial in percentage terms. Most Silver stocks would rise well over 50%.
The long-term trend and fundamentals remain intact for both Silver and Gold. Day traders and reporters will tell you there is no sovereign debt bubble or threat of inflation but, as Kyle Bass recently pointed out that can change very quickly. Remember the financial crisis? Look at the charts of financial stocks. They were fine for many years and then fell off a cliff within a year. There were people who, in the middle of 2008 thought we weren’t even going to have a recession! Most never learn.
I suspect the major catalyst will occur when governments lose control of their own bond markets. They have to continue to print money for years and it will be a major catalyst for Gold & Silver when bond markets go the other way. This could be the catalyst for Silver eventually breaking $50 and reaching triple digits. Currently, quality gold and silver miners (mostly not in GDX or GDX) are trading well off their highs and at their lowest valuations in quite a while. If you’d be interested in professional guidance in uncovering the producers and explorers poised for big gains in the next few years then we invite you to learn more about our service.
Charts to provide perspective for gold bulls
 Most chartists use daily or weekly charts. Few look at monthly charts. I don’t know of anyone (myself included) who pays any attention to quarterly charts. We decided to take a look at the quarterly chart of the HUI gold bugs index. It is below and we note the two big downturns in the market. Also note the importance of 300, which has been support for the past seven years.
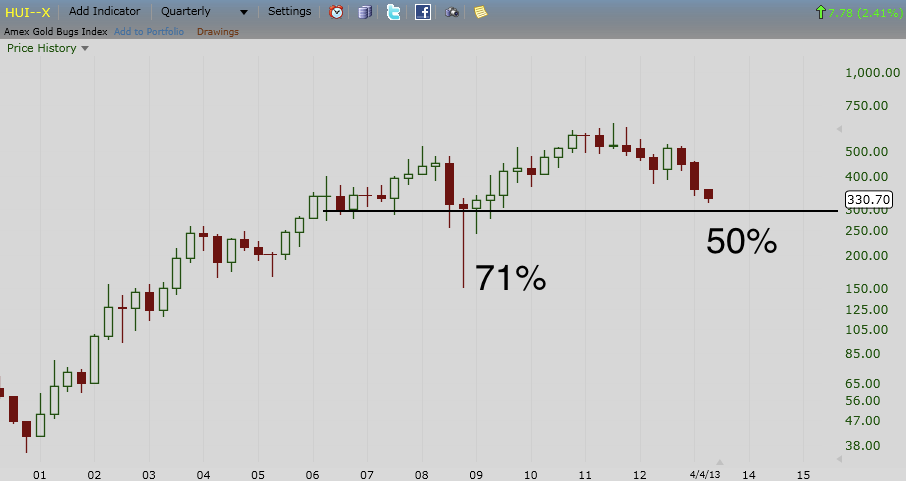
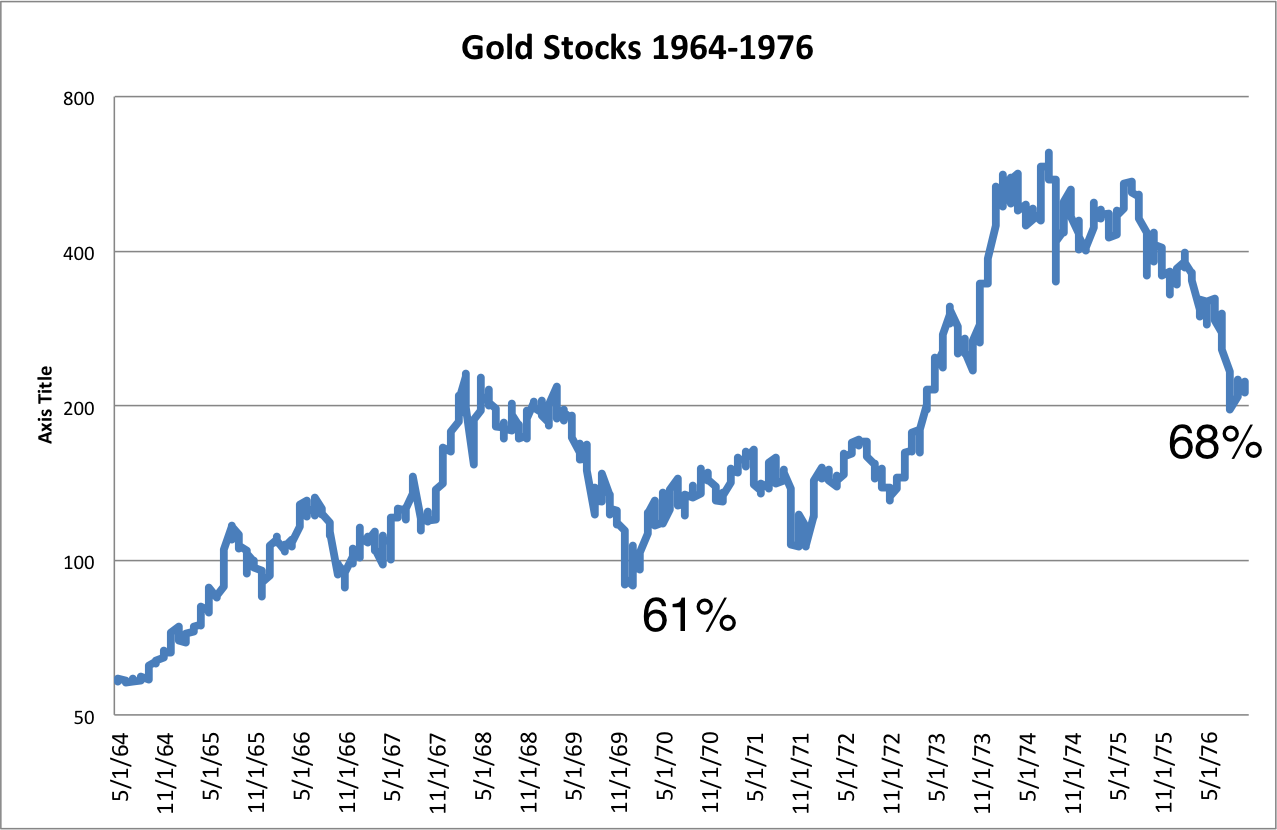
Some have chided your humble author for saying that the gold stocks are still in a bull market. After all, these two big downturns invalidate any assertion of a bull market. Right? Well, the previous bull market in gold stocks also included two large downturns. Within the 1960 to 1980 bull market, the first correction was 61% and lasted about two years. The next correction was 68% and also lasted about two years.
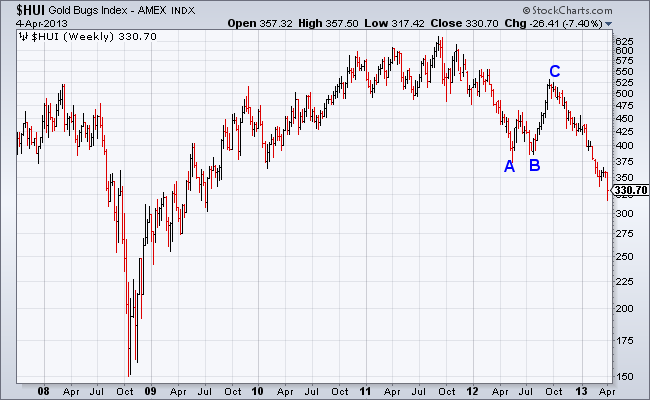
Even more intriguing is the similarities between the gold stocks over the past five years and the Nasdaq from 1987 to 1990. Both markets crashed and then quickly recovered to a new marginal high. Furthermore, note the price action in the Nasdaq during late 1989 to 1990 and compare it to the price action of the gold stocks over the past 15 months.
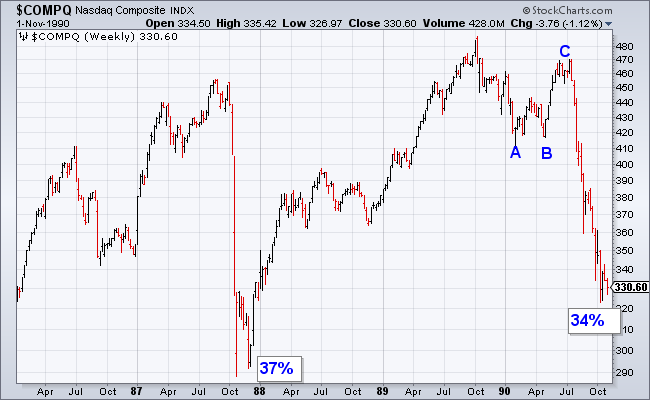
Like the Nasdaq, the HUI formed a bullish double bottom (A,B) and advanced quickly and strongly. Both markets then fell apart. The Nasdaq declined 31% in only a few months. That was almost as bad as the first crash! The gold stocks have declined about 40% in the last six months.
After its bottom in 1990 the Nasdaq gained nearly 16-fold over the next 10 years. Following its second massive downturn within the 1960-1980 secular bull market, the Barron’s Gold Mining Index advanced nearly 7-fold in the next six years. This is not to say that the gold stocks are likely to repeat the same pattern. This is to show that there is a strong historical precedent for the current downturn to occur in the context of a major bull market.
Ok, I know what you thinking. Jordan, why didn’t you provide this analysis weeks or months ago? The answer is, we’ve been aware of these charts and that is one of many reasons why we’ve slowly “scaled into” positions. We’ve told premium subscribers what our favorites are and how we plan to scale into and build those positions over the spring and summer months. On March 1 we wrote: As for the short-term, we began scaling into positions last week but maintain plenty of cash to be deployed (potentially) at our strong targets of HUI 336 and HUI 300.
Currently, the market remains in a bottoming process. We don’t know if Thursday’s low at 317 marked the bottom or not. Judging from the quarterly chart it looks like we could see a test of 300 or a temporary break of that level. On the other hand, Wednesday’s selloff occurred on record volume and Thursday’s reversal was quite strong. There is a chance a small head and shoulders bottom could be developing. Strong follow through on Friday would certainly raise the odds that 317 was an important low.
In any event, we are moving closer and closer to a major bottom and a large rebound in percentage terms. Weeks ago we noted the extreme pessimism in Gold was beyond the 2008 low by most metrics. Sentiment towards gold stocks is even worse. Traders and momentum players think the sector is one big joke. Mainstream funds who have the slightest interest in the sector are focusing on the metals and not the shares. I can’t recall a sector that has ever been this hated within a secular bear market. It is quite amazing. That aside, we are quite confident that the sector is days to a few weeks away from the start of a very strong rebound. Be advised that there are hundreds of mining stocks and stock selection is critical to achieving strong returns.
Good Luck!
Jordan Roy-Byrne, CMT


