
Personal Finance
Where’s the bottom in Gold?
The price action in gold and silver in the past couple weeks has definitely tested the resolve of the bullish camp. According to Dorsey Wright & Associates gold bullion experienced it’s third worst sell-off in history and its worst day in 30 years! There were several headlines that helped precipitate the decline however the price charts suggest that the decline in gold has been underway for more than 7 months and that maybe we are getting close to a trading low?
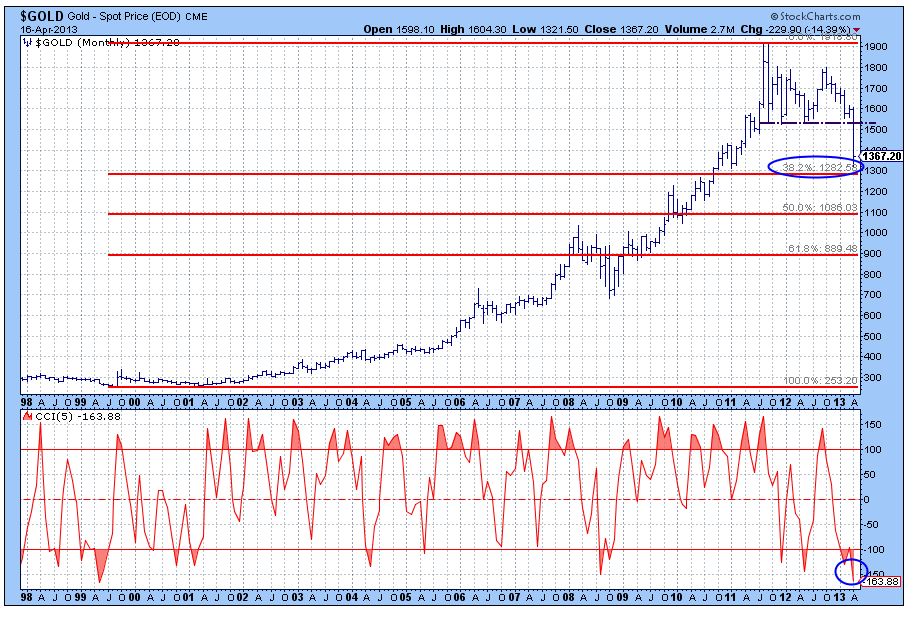
The long-term chart of gold shows a spectacular move from $250 to $1900 over a 10 year period. Since peaking at $1900 in 2011 the price action has been defined by a sideways trading pattern with major support at $1526. Once that level was breached a few days ago, supply quickly overwhelmed demand resulting in panic selling that drove the price down to $1321.
The big question is where will gold make a bottom and what’s the long-term implications? While the near term picture looks promising the long-term outlook is a little more clouded according to the charts below. The monthly chart indicates a key Fibonacci retracement level at $1282. Yesterday gold traded down to $1321 which is within close proximity to this level so we may have made the low already but we would need to see a bounce followed by a retracement that holds above $1321 to confirm the low. In addition, we see that the price oscillator has become very oversold at a level similar to previous bottoms which adds to our near-term bullish scenario. Once the selling has dissipated we would be looking for a move back up to the break of support area at $1526 which is now a heavy resistance level.
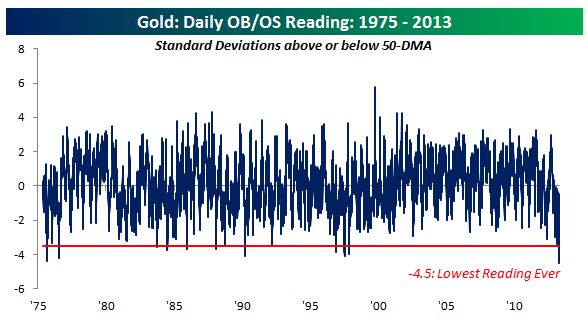
On Monday, Bespoke Investment Group posted the second chart below which shows gold trading at more than 4.5 standard deviations below its 50-day moving average, the lowest reading since 1975! This is an historic data point and supports our view that we should see a pretty good recovery rally.
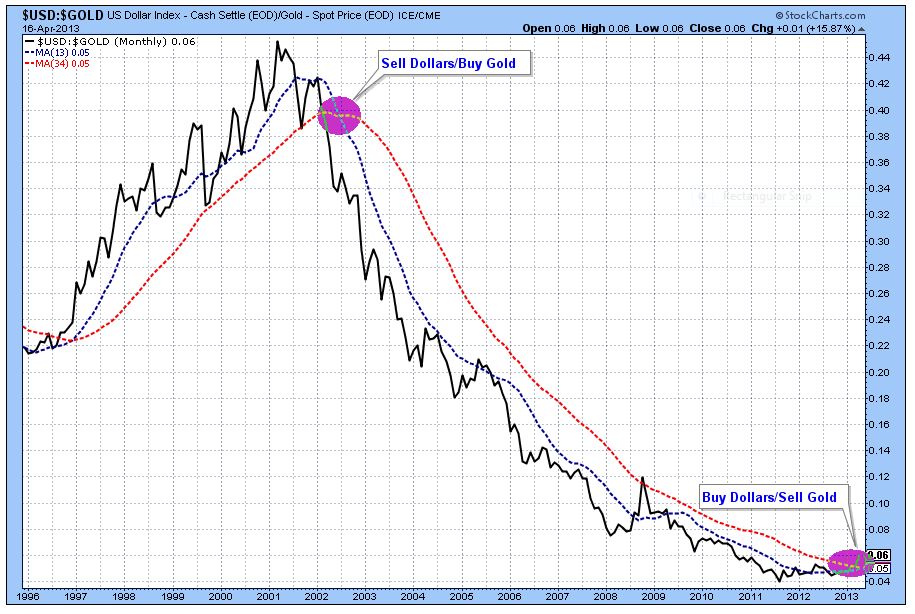
The third chart suggest that the long-term trend is changing. The chart is the $U.S. Dollar relative to Gold. Back in 2001 the dollar peaked relative to gold and went into a long-term downtrend while gold experienced a spectacular rise. For the past 18 months capital has been seeking a home in the dollar as a refuge to the political and financial turmoil that’s been raging across Europe. This is a long-term shift in capital flows that’s not about to reverse anytime soon so it appears that gold will likely remain an underperforming asset for at least the next couple of years.
Strategically we would be looking for a low in the next few weeks followed by a rally up to the $1526 level but would be looking for an exit once this price point has been achieved.
Information provided is not a solicitation and although obtained from sources considered reliable, is not guaranteed. The views and opinions contained in the article are those of the author, not Raymond James Ltd. Raymond James Ltd. Member-Canadian Investor Protection Fund
BRENT WOYAT, CIM, CMT
Portfolio Manager
OceanForest Investment Partners
Raymond James Ltd.
Independent Financial Services
Suite 102-2168 Marine Drive
West Vancouver, BC V7V 1K3
604.921.9222 Work | 604.921.9212 Fax | 1.888.589.9591 Toll Free
brent.woyat@raymondjames.ca

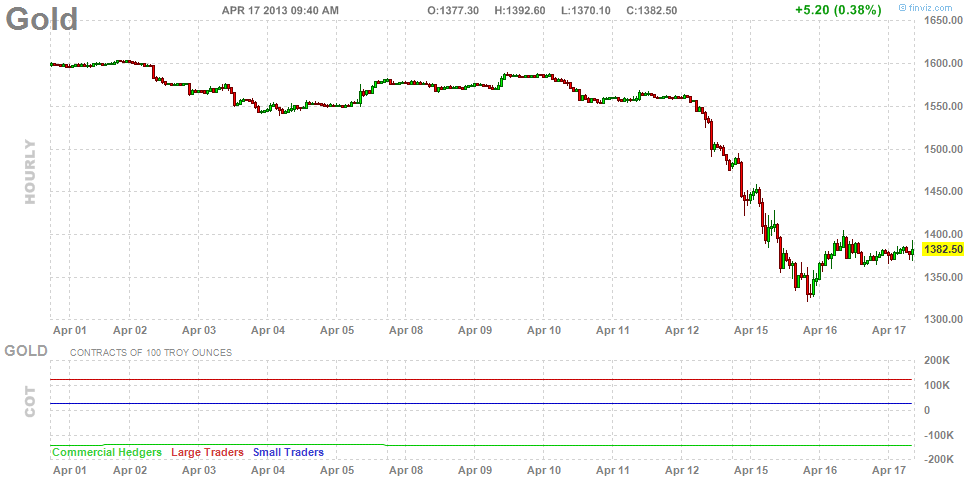
 Gold has been taking a battering all day (written Monday April 15th). Gold is off 8.5% to $1,373.80 an ounce.
Commodities guru Jim Rogers isn’t buying gold yet.
He told Business Insider there were four key things driving the sell-off.
- India – The country hiked its gold import tax rate by 50% to 6% at the start of the year. This has curbed gold demand.
- Chartists – Technical analysts that have warned that gold prices will continue to fall.
- Cyprus – “Ms. Merkel is seeking re-election so she has told Cyprus and others that they should sell some of their gold to pay their debts. The Germans are tired of bailing people out and she needs to be tough.”
- Bitcoins – “The collapse of Bitcoin since most of them also own gold.”
Rogers said he hasn’t hedged his positions at the moment.
“I have repeatedly babbled about $1200-1300, but that is just because that would be a 30-35% correction which is normal in markets,” he told Business Insider. “But I am a hopeless market timer/trader.”
Rogers said he expects gold prices to fall further for the “foreseeable future” but expects “gold to eventually go higher over the decade.”
Read more: http://www.businessinsider.com/jim-rogers-normal-gold-price-correction-2013-4#ixzz2QT4nmXJv

This perspective identifies and expresses more evidence that Standard & Poors 500 index is trouble. This gentleman wrote about the market conditions two weeks that suggested to him that a correction was beginning. Now after the big drop on Monday April 13th, ONeil Trader isolates some more factors here:
I wrote about the market conditions two weeks ago, and said that we might be experiencing the beginning of a correction. The market largely ignored the current conditions and the S&P 500 (SPY) marched on to new highs. But the inter-market behavior is still not favoring risk on behavior, and the economic data coming out is weak and mostly below expectations.
Weak economic data
In the latest economic data reported, non-farm payrolls were very weak and below analyst consensus estimates, retail sales are down and below estimates, Empire State manufacturing index and Michigan consumer confidence were also lower. The NAHB housing market index is at its six-month low of 42, sliding two points in the latest report.
Gold (GLD) and silver (SLV) also broke down to their lowest levels in two years, as fear that Cyprus and possibly other European nations might sell their gold to finance their deficits. China’s first-quarter GDP also came in lower than expected, as the growth slowed down to 7.7%, and the consensus estimates called for an 8% rise. In addition to weaker GDP growth, industrial production grew 9.5%, down from 10% in Q1 2012. Retail sales rose 12.4%, also down from 14.3% a year ago. The news added to the overall negative sentiment in the markets, and especially in the precious metals.
Defensiveness in the market prevails
It is usually not good for the general market if the defensive parts outperform the broad indexes. And that is happening for some time now, although the S&P 500 managed to reach new highs recently. Bonds (TLT) and utilities (XLU) continue to go higher and outperform the S&P 500, while small caps (IWM) and homebuilders (XHB) faced a fierce sell-off. I wrote about the Homebuilders and their topping process two months ago, and they haven’t made much progress since, and have experienced distribution and little overall price progress.
On the charts below, you can see the price progress of defensive asset classes and their performance relative to the S&P 500 on the line chart below the price chart. The move of the line higher represents the outperformance of the chosen asset class relative to the S&P 500, and the reverse is true for the lower move of the line, and it means the asset class is underperforming the S&P 500. The utilities (XLU) are in a steep uptrend, and have outperformed the S&P 500 since early March. Bonds (TLT) are moving up for a month now, and started to outperform the S&P 500 again.


On the other hand, homebuilders have topped in mid-March and underperformed the broad market since. The index sliced the 50-day moving average line for the second time in above-average volume, and did not manage to reach new highs although the S&P 500 did. The Russell 2000 also topped in mid-March, and did not manage to reach new highs since. It too dropped below the 50-day moving average line, and the volume was highest in three months.


Conclusion
Weak economic data and poor intermarket behavior point to the elevated risk of an intermediate correction. With the indexes near all-time highs, and an already mature uptrend in its sixth month, a correction would not be that surprising. Defensive attitude is advised until the conditions improve.
More articles by ONeil Trader »
- First Solar: Is The Latest Move Just A Short Squeeze?Sun, Apr 14
- United Rentals: A Bet On Construction RecoverySun, Apr 14
- Silver Wheaton: Short-Term Pressure, Long-Term GainsFri, Apr 12
- ExOne: New Highs On Strong Revenue ForecastFri, Apr 12
- Turning Point For TeslaThu, Apr 11
There is no doubt that we are at a critical juncture in gold and silver and the first order of business is to drill down to how and why prices plunged so much Friday and Monday.

Certainly, more commentary (mostly on gold) is being written about the precious metals currently in regards to the price weakness than I can remember. Unfortunately, much of the analyses and commentary is wide of the mark, in my opinion. But the great thing is that everyone interested in what just took place with gold and silver prices can decide for themselves from the multitude of opinions offered as to what makes the most sense.
For me, explaining what took place is easy, since the price plunge occurred in the confines of how I analyze gold and silver. First, what exactly did happen? Basically, a neutron price bomb was detonated in certain NYMEX/COMEX markets that selectively targeted gold, silver, copper, platinum, palladium and crude oil prices. On just about every other market, like stocks, bonds, currencies, grains, meats, soft commodities yesterday was non-eventful pricewise. The importance of this distinction that only selected markets experienced unusual price weakness is that it eliminates many general knee-jerk explanations about prices being impacted by broad macroeconomic factors. How could broad economic factors influence certain commodities and not the stock or currency markets? Looking deeper, the commodities experiencing price weakness all have different supply/demand fundamentals relative to one another, so as to eliminate the possibility that all those unique fundamentals changed yesterday in synch. Commodity fundamentals change glacially; it’s impossible for the supply/demand equation of many various commodities to change overnight.
So, if it wasn’t abrupt change in the fundamental story in the various separate markets that were hit to the downside yesterday, then what the heck accounted for the steep declines in price? Stated differently, what was the common denominator present in the markets that plunged? The most visible common denominator was that the various big price declines occurred on the NYMEX/COMEX markets owned and run by the CME Group. But the most important common denominator was the nature of the buyers and sellers across all the markets that got smashed. Without exception, in any market that declined significantly, the big net buyers were the traders classified as commercials and the big net sellers were those traders classified as non-commercials, largely technical trading funds. Not only was this true yesterday, it has been true on every single big price decline throughout history, according to US Government data (COT reports).
This may seem elemental, but I ask you to contemplate this anew. In the highly-charged emotional state of significant price declines, it is tempting to accept fabricated stories as to what may be the cause of the declines. Because of that, it is more important than ever to rely on the known facts and only that which can be substantiated. COT data have and will show without question that the commercials are always the big buyers and the technical funds are always the big sellers and there was no exception this time. Once you know who the big buyers and sellers are (which is the beauty of the COT), only then can you proceed to the how and why of the big price declines.
Armed with the certain knowledge that in every market that declined substantially the big buyers were the commercials with the big sellers as the technical funds, how and why fall into place. Why is real easy – in order to make money. The way one makes money is by buying low and selling high, although not necessarily in that order. For instance, JPMorgan the big concentrated short seller and manipulator of silver and other markets, has made a boatload of money, many hundreds of millions of dollars, by short selling at higher prices than the prices they have been buying back at. I don’t begrudge JPMorgan for making large trading profits if they were doing so legally, but that is not the case. The trading profits being made by JPMorgan and the other commercials are as far from legal as is possible. That’s the only plausible conclusion a reasonable person could reach when answering the last open question – how do they do it?
Knowing who the buyers and sellers are and why, all that’s left is the how. Simply stated, JPMorgan and the commercials have captured control of the mechanism that sets short term prices, by means of High Frequency Trading (HFT), which dominates modern electronic trading. Whenever JPMorgan and the commercials wish to set prices for any market sharply higher or lower, they can and do set those prices. That is an incredibly powerful trading advantage. Since the technical funds, which are always the counter parties to JPM and the other commercials, rely on price changes to initiate their buying and selling, these funds are, effectively, controlled by JPMorgan and the commercials.
Sunday night was a classic example in that JPMorgan and the commercials kept setting lower and lower prices in the NYMEX/COMEX commodities mentioned to induce more and more technical fund selling so that JPM and the commercials could and did buy. The commercials knew there was residual margin call liquidation for Monday morning, following Friday’s rout, so rather than let panicky margin call sellers out with additional losses of 50 cents in silver or $20 in gold, the commercials rig prices lower in thin Sunday night Globex dealings by $3 in silver and close to $100 in gold. This is similar to the May 1, 2011 Sunday night $6 massacre in silver. The only difference is that this time the commercials took all other important NYMEX/COMEX markets down with silver.
The proof that this is how the market operates can be seen in current and historic COT data in that on big declines in price the commercials are always big buyers and technical funds are big sellers. In fact, I don’t know that there can be an alternative explanation based on actual data. Of course, there is no way a small group of large banks and financial firms could be continuously pulling this trading scam off without prearrangement and collusion. And of course, this collusion and price control is against the law and any sense of fair trade. We actually have in place a federal regulator, in the form of the CFTC and a self-regulator in the CME, specifically created to combat the trading operations I just described, who both refuse to end the ongoing scam.
Clearly, the main impetus behind Monday’s price decline is margin call liquidation by those holding long futures contracts. Although I’ve always warned not to hold silver on margin, at times like this I kick myself for not having warned more forcefully. The $200 gold and $5 silver move over the past two days has resulted in most holding long gold and silver futures contracts to be forced to immediately deposit $20,000 to $25,000 for each contract held or be sold out by their brokers. These demands for such large amounts of money have resulted in an avalanche of panic selling. And it matters little if you believe, like me, that there was an intent behind the extreme price declines or if the margin call selling was spontaneous and beyond intent. In the end, there can be no question that gold and silver (and copper, platinum, palladium and oil) are down today due to extraordinary trading activity on the NYMEX/COMEX, led by margin call selling.
If you accept the premise that massive margin calls are at the center of today’s price decline, the next question is when will the margin call selling end? We know from market history that such selling must burn itself out fairly quickly. This is particularly true in COMEX gold, copper and silver, since there was not a large relative speculative long position to begin with, following months of speculative net long liquidation and new short selling. I don’t think that technical funds are adding aggressively to short positions today since current prices are so far below the popular moving averages so as to make the normal stop loss points above too excessive for prudent risk taking. This looks like plain-vanilla leveraged long liquidation in which the selling pressure has reached a climax and, therefore, must soon end. Prices will stop going down when the margin call liquidation, principally on the COMEX, ends.
The next question is what happens when prices stop going down and the margin call selling burns itself out. In other words, what does the next price rally look like; will we go up slowly or with a rush? No one knows for sure, but the possibility exists that prices could rocket higher. Certainly, any market that can fall 10% in a day can rise by that amount (or more) as well. But what improves the odds of a rush to the upside is the incredible degree of commercial buying that has taken place in the markets that have been smashed. We’ll have to wait until this week’s COT report, but there appears little doubt that it will indicate more record net commercial buying as has been the case for weeks and months. Since I’m convinced beyond question that the price of silver has been manipulated by the big commercials on the COMEX, watching them buy aggressively suggests they could let the price rip to the upside with the same intensity that they’ve orchestrated to the downside.
With the record-setting trading volume Monday and on Friday, I would not be surprised if JPMorgan had eliminated its concentrated silver short position. I think it obscene that the CFTC and the CME have stood by and allowed JPMorgan and the other crooked commercials to disrupt the orderly functioning of the markets, but this is nothing new. The reality is that JPMorgan and their collusive partners are better positioned for a price rally in silver and other markets like never before.
As painful as the severe price declines have been, at least holders of fully-paid for silver retain the option of holding without having to deposit large sums of capital or lose their position. I know that I’m holding, in addition to holding call options. This is, unfortunately, not an option for holders of leveraged metal in the form of futures contracts. While it is true that a good number of leveraged longs have been forced from the market and are unlikely to buy anytime soon, that is not a factor necessary for silver prices to climb in the future. The ultimate resolution for silver prices has always depended upon the physical market. In terms of the physical market, the severe price declines would suggest the physical resolution should be accelerated.
Every free market economic principle holds that lower commodity prices increase demand and curtail supply. Clearly, the sudden price decline in silver is not causing miners to rush into increasing production. And as soon as prices stabilize (which I think is very soon), buying pressure will increase to take advantage of the sudden bargain prices.
Ted Butler
April 16, 2013
For subscription info, please go to www.butlerresearch.com
About Theodore Butler

 Good morning. Here’s what you need to know.
- Asian markets were mixed in overnight trading with the Nikkei up 1.2% on yen weakness. Europe is selling off and U.S. futures are lower.
- UK joblessness climbed by 70,000 to 2.56 million from December through February. The unemployment rate climbed to 7.9%. Meanwhile, average wage growth ex-bonuses fell to 1%, the lowest in over 10 years.
- Bank of America missed when it reported earnings of $0.20 per share, on expectations of $0.23 per share. Adjusted revenue came in at $23.85 billion, above expectations for $23.15 billion. Expects to begin capital plans in the second quarter. Gundlach tells bond bears they’re wrong >
- The Beige Book which contains anecdotal evidence on the economic conditions of local businesses is out at 2 p.m. ET. It is typically published two weeks before the FOMC meeting. Investors watch this report because it influences policy makers and interest rate policy. Follow the release at Business Insider
…….read the other 6 right HERE
![]()

-
I know Mike is a very solid investor and respect his opinions very much. So if he says pay attention to this or that - I will.
~ Dale G.
-
I've started managing my own investments so view Michael's site as a one-stop shop from which to get information and perspectives.
~ Dave E.
-
Michael offers easy reading, honest, common sense information that anyone can use in a practical manner.
~ der_al.
-
A sane voice in a scrambled investment world.
~ Ed R.
Inside Edge Pro Contributors

Greg Weldon

Josef Schachter

Tyler Bollhorn

Ryan Irvine

Paul Beattie

Martin Straith

Patrick Ceresna

Mark Leibovit

James Thorne

Victor Adair