

Where’s the bottom in Gold?
The price action in gold and silver in the past couple weeks has definitely tested the resolve of the bullish camp. According to Dorsey Wright & Associates gold bullion experienced it’s third worst sell-off in history and its worst day in 30 years! There were several headlines that helped precipitate the decline however the price charts suggest that the decline in gold has been underway for more than 7 months and that maybe we are getting close to a trading low?
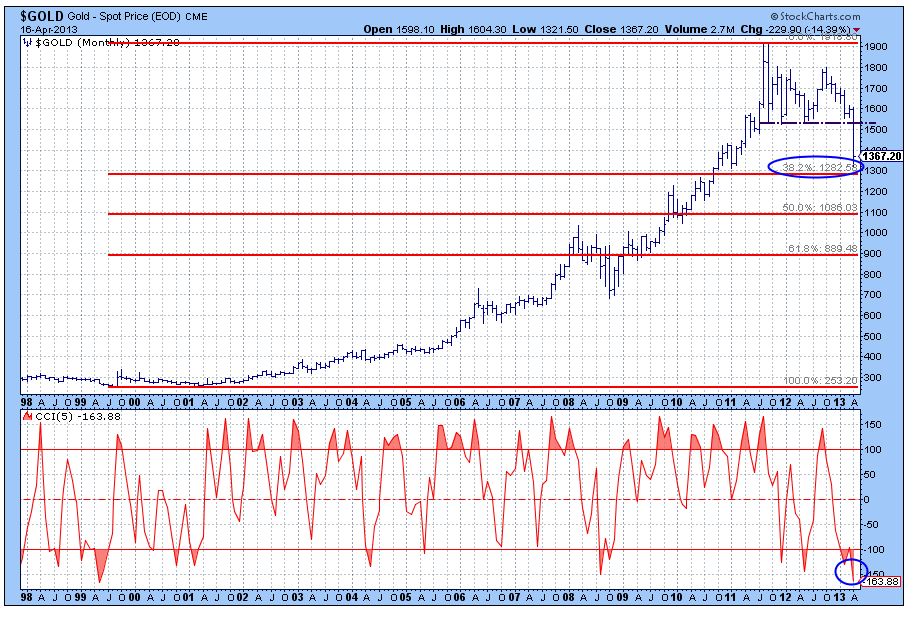
The long-term chart of gold shows a spectacular move from $250 to $1900 over a 10 year period. Since peaking at $1900 in 2011 the price action has been defined by a sideways trading pattern with major support at $1526. Once that level was breached a few days ago, supply quickly overwhelmed demand resulting in panic selling that drove the price down to $1321.
The big question is where will gold make a bottom and what’s the long-term implications? While the near term picture looks promising the long-term outlook is a little more clouded according to the charts below. The monthly chart indicates a key Fibonacci retracement level at $1282. Yesterday gold traded down to $1321 which is within close proximity to this level so we may have made the low already but we would need to see a bounce followed by a retracement that holds above $1321 to confirm the low. In addition, we see that the price oscillator has become very oversold at a level similar to previous bottoms which adds to our near-term bullish scenario. Once the selling has dissipated we would be looking for a move back up to the break of support area at $1526 which is now a heavy resistance level.
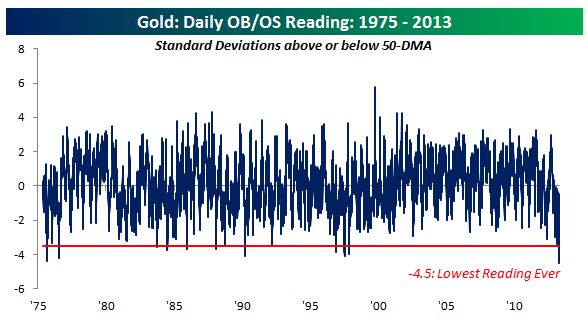
On Monday, Bespoke Investment Group posted the second chart below which shows gold trading at more than 4.5 standard deviations below its 50-day moving average, the lowest reading since 1975! This is an historic data point and supports our view that we should see a pretty good recovery rally.
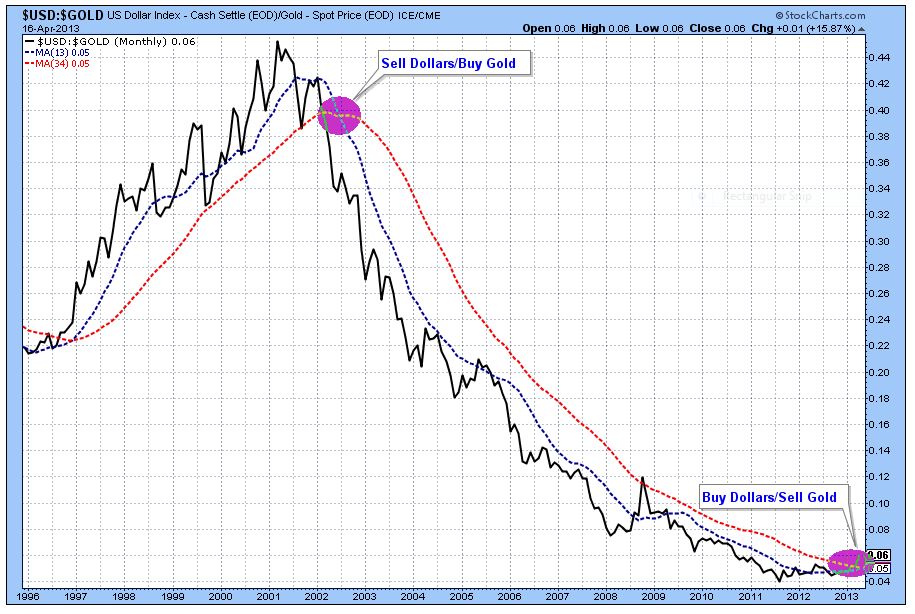
The third chart suggest that the long-term trend is changing. The chart is the $U.S. Dollar relative to Gold. Back in 2001 the dollar peaked relative to gold and went into a long-term downtrend while gold experienced a spectacular rise. For the past 18 months capital has been seeking a home in the dollar as a refuge to the political and financial turmoil that’s been raging across Europe. This is a long-term shift in capital flows that’s not about to reverse anytime soon so it appears that gold will likely remain an underperforming asset for at least the next couple of years.
Strategically we would be looking for a low in the next few weeks followed by a rally up to the $1526 level but would be looking for an exit once this price point has been achieved.
Information provided is not a solicitation and although obtained from sources considered reliable, is not guaranteed. The views and opinions contained in the article are those of the author, not Raymond James Ltd. Raymond James Ltd. Member-Canadian Investor Protection Fund
BRENT WOYAT, CIM, CMT
Portfolio Manager
OceanForest Investment Partners
Raymond James Ltd.
Independent Financial Services
Suite 102-2168 Marine Drive
West Vancouver, BC V7V 1K3
604.921.9222 Work | 604.921.9212 Fax | 1.888.589.9591 Toll Free
brent.woyat@raymondjames.ca


