
Timing & trends
For some perspective on the all-important earnings environment, today’s chart illustrates ‘as reported’ S&P 500 earnings growth (i.e. 12-month rate of change) since 1940. There are a couple of points of interest. For one, earnings growth has tended to peak in the 20 to 40% range and trough somewhere in the -10 to -20% range. At least that was the case up until this millennium. Since the dot-com crash (i.e. the 2001 – 2002 timeframe), earnings growth volatility has increased dramatically. In fact, the post-financial crisis spike to 793% is not even shown on today’s chart so as to allow the rest of the data to remain visible (i.e. not flattened out). It is worth noting that this historic post-financial crisis earnings growth spike is due in large part to the fact that earnings came in so low as a result of the financial crisis. That said, earnings growth has dipped into negative territory for the first time since the financial crisis.
Notes:
Where’s the Dow headed? The answer may surprise you. Find out right now with the exclusive & Barron’s recommended charts of Chart of the Day Plus.

Quote of the Day
“He who likes cherries soon learns to climb.” – German proverb
Events of the Day
May 15, 2013 – Cannes Film Festival begins (ends May 26th)
May 18, 2013 – Preakness Stakes – Armed Forces Day
May 20, 2013 – Victoria Day (Canada)
May 21, 2013 – French Open tennis tournament begins (ends June 9th)
May 26, 2013 – Indianapolis 500
May 27, 2013 – Memorial Day (observed)
Stocks of the Day
— Find out which stocks investors are focused on with the most active stocks today.
— Which stocks are making big money? Find out with the biggest stock gainers today.
— What are the largest companies? Find out with the largest companies by market cap.
— Which stocks are the biggest dividend payers? Find out with the highest dividend paying stocks.
— You can also quickly review the performance, dividend yield and market capitalization for each of the Dow Jones Industrial Average Companies as well as for each of the S&P 500 Companies.
Mailing List Info
Chart of the Day is FREE to anyone who subscribes. Chart of the Day

We thought we would share with our readership an important change in the positioning of large U.S. banks in the monthly futures-only Bank Participation Report(BPR) issued by the Commodity Futures Trading Commission (CFTC). The most recent report was published Friday, May 10 for positions as of the close on Tuesday, May 7.
The main reason we are going to the trouble of doing this short report is that there is a surprising dearth of accurate information about the new data available on the Web.
One of our members forwarded to us some coverage by others which we found utterly useless and inaccurate (showing a preconceived bias on the part of the author), so perhaps this report will provide some clarity for those who closely follow the CFTC commitments of traders reports as well as the positioning of banks in futures.
U.S. Banks Net Shorts Fall to Lowest Since Summer, 2008
Let’s start this review with our comments shared with GGR Subscribers on Sunday, May 12. After mentioning that the combined commercial traders – the Big Hedgers, which includes the U.S. banks in the Legacy COT reports – had reduced their collective net short positioning for gold to the lowest since the 2008 panic and at a “very fast pace,” we said:
“An aggressive pace of LCNS reduction with none more aggressive than U.S. banks. The Bank Participation Report (not to be confused with the weekly Legacy COT report, which is separate) shows that over the past month U.S. banks covered or offset a whopping 24,855 (60%) of their net shorts (from 41,666 to just 16,781 contracts net short). The number of U.S. banks reporting falls below 4, a tell. We have not seen the U.S. banks show so low a net short position since they briefly went slightly net long in the summer of 2008 during the panic.”
So in just one month, as gold fell a net $123.45 or 7.8% (from $1,575.67 on April 2 to $1,452.22 May 7), U.S. banks covered or offset 60% of their net short bets on gold, down to an extremely small 16,781 contracts net short. We have to go all the way back to the June 3, 2008 BPR to find a time when the U.S. banks, including bullion banks, showed a lower number of net short bets held.
In fact, in that June 2008 report the U.S. banks were actually net long gold then by 5,381 lots. (But as the graph below clearly shows they would not stay net long. By the next monthly report in July they had put on an amazing 82,228 contracts net short in just one month.)
Below is a graph showing the nominal net short positioning reported by U.S. banks to show it visually.
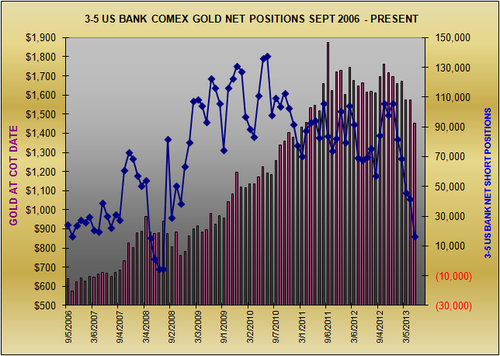
Interestingly, the U.S. banks net short positioning did not decline because they were reducing their short bets. Instead, 21,653 contracts of the change is attributable to the banks adding long contracts to their positioning for just this past month. They were not dumping their short contracts so much as adding longs in other words.
In just the five reporting months since December 4, 2012 as gold declined a net $245.10 or 14.4%, U.S. banks’ net shorts fell from 106,393 to 16,781, a plunge of 89,612 lots or a whopping 84.2%.
The net effect is clear to see in the graph above on a nominal basis. As gold fell down to test the $1,300s U.S. banks very strongly reduced their collective net short positioning and came within a whisker of becoming actually net long for the first time since the 2008 panic.
To standardize the results and show that there are no material anomalies in the data above, we compare the U.S. banks’ nominal net position with the total COMEX open interest in the graph below. From December 4 to last Tuesday, May 7, as gold fell from near $1,700 to as low as $1,321 before settling at $1,452, the U.S. banks’ net short positioning fell from a significant 24.5% to a miniscule 3.8% of all COMEX contracts open .

Clearly the U.S. banks, presumably including U.S. bullion banks, are not, that’s not, positioning as though they believe there is a great deal more downside left in gold futures.
If they did or do believe that gold could probe even lower than the $1,320s, they are not positioning for it in COMEX futures. That does not necessarily mean they are “right,” but it is a window into how the largest, best funded and presumably the best informed traders of gold futures on the planet – the U.S. banks – are positioning, both for their own book and for their clients.*
It is rare to see the U.S. banks put on 21,000 or more long contracts in a month.** We have to believe that the U.S. banks would not have done that unless they meant to reduce their collective net short positioning in a relative hurry.
(A long contract benefits if prices rise. A short contract benefits if prices fall.)
* The U.S. bullion banks trade for their own account and for clients, which include a broad cross section of businesses in the gold trade (large bullion dealers, large holders of physical metal, jewelry merchants and manufacturers, producers, some refiners, bullion management firms and other middlemen, etc.).
** This is the largest increase in our records going back to 2006. Before this report the largest one month increase in U.S. bank longs was with the September 2, 2008 report, when the U.S. banks reported adding 17,567 lots with gold then about $805. By the following report, on October 7, gold had moved 9% higher to the $880s.
(Source for data CFTC for bank positioning, Cash Market for gold, GGR.)

 With most of the world’s major economies running the printing presses to the point where it’s becoming absurd, there’s one country out there that is in the catbird seat when it comes to a strong, stable economy, growing export markets and strong stable companies.
And it’s only going to get better.
Yes, there’s a world of opportunity out there, but for all the good there are some serious risks in the usual investing suspects:
The U.S. stock market is busting out to new highs, but the U.S. economy remains below par and the federal budget deficit remains at staggeringly high levels.
In Japan, the government is doubling down on U.S. policies, with a budget deficit and monetary “stimulus” twice the size of the U.S. figures.
Britain and the EU are locked in recession, with “austerity” apparently not working and close to being abandoned, while monetary policy becomes looser and looser, with interest rates well below inflation.
The opportunity?
There is one country that runs a budget surplus, has interest rates above the level of inflation, and also has decent growth and a trade surplus.
BRICs Are a Bust
But it’s not one of the BRICs (the big emerging economies we hear so much about: Brazil, Russia, India and China).
Russia has oil, but a kleptocrat political system and inflation of 7% and rising.
China has growth but is another political system you wouldn’t want to live under, and a mountain of bad debt in its banks, which contains the real budget deficit, much larger than the official one.
India also has a mushrooming budget deficit.
Brazil is in many ways the worst of the lot, with growth slowing and a budget deficit that is way higher than the official figure because of all the financing hidden in state banks.
The Big Winner Isn’t a Small Nation
There are smaller emerging markets with decent figures, but the country I want to tell you about is a rich country with a large stock market.
It is in the epicenter of the world’s most dynamic growth and its balance sheet is stunning in a time of broad global malaise.
The country that’s got its economy firing on all cylinders is South Korea.
Along with everything else it has going for it, South Korea just elected a center-right president, Park Geun-hye, who should be in office till 2017 and has a solid majority in Korea’s congress.
But more compelling, South Korea isn’t benefiting from artificial fiscal stimulus – it runs a budget surplus.
Its short term interest rate is 2.75%, inflation is 1.3%, and it has a thumping current account surplus of 4.5% of GDP.
And it’s expected to grow at 2.9% in 2013 and 3.8% in 2014, which may not sound like much but is the fastest of any rich country.
Making What the World Wants
South Korea is a technological leader, especially in the areas of display systems (portable computers that can be rolled up like a newspaper!) and stem cell biotech innovation.
In genetic engineering its lead may become more strategic in nature, since Korean public policy does not place the limitations on biotech innovation that the United States does.
But what’s new is that South Korea is now also a cultural leader, with its “Gangnam Style” pop phenomenon sweeping the world. That’s small potatoes in terms of immediate revenues, but allows Korea to attract the young, style-conscious and footloose (among whom are many of the world’s innovators) in a way it could never have done 20 years ago.
The Korean market is valued at a moderate 16 times earnings, according to the Financial Times, compared with 17 times earnings in the slower-growing U.S.
However since Korea has not pursued the funny money or funny-budget policies of other countries, it’s much less likely to get in trouble. While North Korea is obviously a worry, overall South Korea is an excellent safe haven from the nasties that affect the rest of the world.
3 Ways to Buy into This Opportunity
There are a number of ways to play the South Korean market. Here are my top three:
The largest Korea-focused ETF listed in the U.S. is the iShares MSCI South Korea Index ETF (NYSE:EWY). With net assets of $3.2 billion and an expense ratio of only 0.61% it is an efficient way of getting exposure to the market as a whole. Currently it has a P/E ratio of only 10 times earnings but a yield of only 0.6%.
Korean banks are very reasonably valued in terms of net assets, yet are currently nicely profitable. The largest financial group is Woori Finance Holdings (NYSE:WF), the parent group of Woori Bank. This is currently trading at only 48% of book value and 5.7 times trailing earnings. Based on last year’s dividend it yields about 2.2%.
Apple Inc. is slowly losing market share in cellphones and tablets to Samsung Electronics (London GDR: SMSN). Regrettably, Samsung doesn’t trade ADRs, but its global depository receipts trade on London, albeit at a price of near $700.
Still, with a projected P/E of 7.6 times 2013 earnings and trading at 1.7 times book value, it’s a better deal than Apple because its margins are not so subject to erosion.
Related Story Links:
- Money Morning:
Why Hedge Funds Are a Lousy Investment - Money Morning:
Here’s the Surprising Winner of the Currency Wars - Money Morning:
The Eurozone Hangs On By a Whisker - Money Morning:
My Two Favorite Gold Mining Stocks

It’s been many years since a national political issue(s) impacted the markets. President Obama is facing some serious issues on several fronts and while he has up to now been a “Teflon” President, any one of these can have serious consequences for his Presidency (“despite” the vast major of the media being left-leaning).
U.S. Stock Market – The “rumor’ last week about an article to come out predicting an end to QE was IMHO a series of trail balloons to see how the markets would react to such a feat. I believe it’s a concentrated effort to lessen the blow if and when they actually attempt it (They also were able to snuff out a gold rally so they score some points).
Give the “Don’t Worry, Be Happy” crowd time, and they’re capable of spinning this to the point of its actually good for the market. TOUT-TV will lead the charge for them
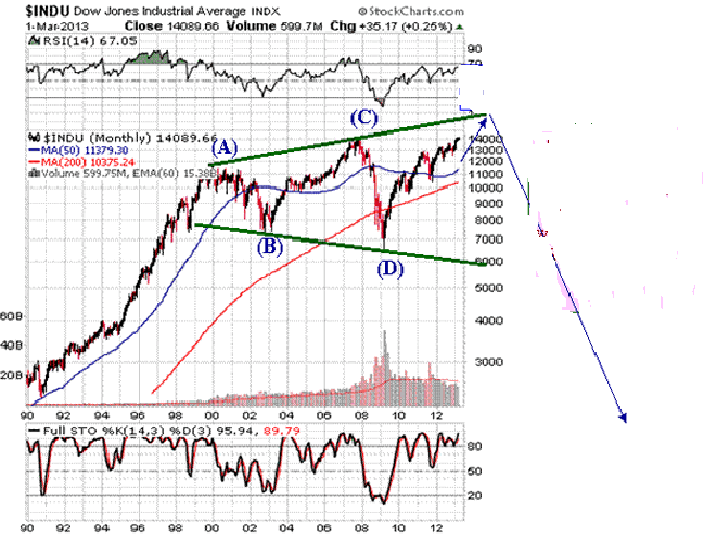
Megaphone Top
At the beginning of 2013, I used this chart to show why I continued to look for new, all-time highs in the DJIA. I stated it could rally to the top of the “Megaphone” resistance line, which is just under 16,000
We’re getting pretty close and given whet the downside target is afterwards, I strongly suggest not to look a gift horse in the mouth and hang around for the last 5% of the upside.
U.S. Bonds – Avoid! Any questions?
U.S. Dollar – Despite the air being let out of a tremendously overvalued Yen and the continuing saga in Europe, the U.S. Dollar is at best the “lesser-of-two-evils” at the moment.
Metals and Mining Shares – I spent yesterday at the “Metals & Mining Investment Conference” in New York City. I’ve been going to that show since the early 1990s. With no disrespect to the show organizers (they to a first-rate job), it was without a doubt the most depressing gold show I ever been to given its location and prices of metals themselves.
To start with, these shows are normally heavily-tilted to the bullish side. This time around, you could cut the bearishness with a knife. Ironically (and in my mind, a very bullish sign), two of the more ardent bears for the last decade (one of whom has made pretty much the same speech for the last decade that gold is over-priced by several hundred dollars… and has missed the first decade run-up), really piled on why they believe the bull market in gold has ended. Amazingly, the crowd which usually tends to be overly bullish was shaking their head in agreement and flocked to them after they were done speaking.
I appeared on a panel later in the day with one of them and while it was a very cordial exchange, I noted to the crowd this show had a bull’s versus bear’s debate every year and one could never find a bear. This time around, I was clearly the lone bull (and to those who say full of bull…).
The show also confirmed what I already experience by hearing from many readers interested in my alternative to traditional financial planning process and my own feelings – the retail mining and exploration shareholder is badly beaten up, depressed and looking for an out to end the suffering. This makes me think that even when we eventually have a rally, the rally will not induce new buying as much as it will be an opportunity to lessen this burden of ownership.
Only because I said it before and it proved to be just a “Gadhafi-like line in the sand move, I just can’t imagine the sentiment getting any worse. That’s the good news. The bad news is there’s nothing to say it can’t stay this bad and without a dramatic turnaround in the price of gold, I don’t see how the shares can rally much for the balance of 2013-UGH!
Ed Note: You Can Check out Peter’s Daily Update HERE


-
I know Mike is a very solid investor and respect his opinions very much. So if he says pay attention to this or that - I will.
~ Dale G.
-
I've started managing my own investments so view Michael's site as a one-stop shop from which to get information and perspectives.
~ Dave E.
-
Michael offers easy reading, honest, common sense information that anyone can use in a practical manner.
~ der_al.
-
A sane voice in a scrambled investment world.
~ Ed R.
Inside Edge Pro Contributors

Greg Weldon

Josef Schachter

Tyler Bollhorn

Ryan Irvine

Paul Beattie

Martin Straith

Patrick Ceresna

Mark Leibovit

James Thorne

Victor Adair