
Gold & Precious Metals
 Nearly 21 months ago, one of the world’s leading analysts and proponents of gold shocked the investment community with the announcement that the yellow metal was headed south.
Most of his colleagues in the industry scoffed. But his loyal followers took action according to his explicit instructions:
They bought gold hedges for protection against the decline.
They liquidated all their mining shares.
And then they waited — sometimes patiently, sometimes anxiously — for his next major “buy” signal.
That gold analyst is Weiss Research’s Larry Edelson.
This week, I talked to Larry at length and reviewed his fascinating, but practical, writings. Here’s Part I of our three-part interview …
![]()
 d
d
Martin Weiss: Larry, today I want to focus on the major pitfalls to avoid. But before we jump into specific instructions, please lay out the full dimensions of the opportunity.
Larry Edelson: My analysis tells me the next leg of the gold bull market will not end for three full years. It will not peak until the yellow metal is at $5,000 per ounce or more. And it will spin off a long series of trading opportunities in virtually every investment that’s tied to gold and other precious metals — bullion, shares, ETFs, plus unique trades that most investors are unfamiliar with. I’m talking about the biggest gold opportunities since the Great Depression.
Martin: Talking about the Depression, my father told me how much money he and his colleagues made in the gold market back then.
Their Homestake shares surged from $65 to $540 per share. The company’s dividends doubled, redoubled and doubled again, reaching $56 per share in 1935. So the dividends alone were almost enough to pay back the entire purchase price of the stock.
Their shares in Dome Gold Mines did even better — surging from $6 to $61 per share and throwing off dividends that added up to two and a half times the purchase price of the shares.
Is this the kind of opportunity you see here?
Larry: Yes, but not if you jump in prematurely, like so many gold investors have continually done in the past 21 months or so.
Martin: I know … and as you well know, we’re counting on you to give us the signal. Don’t get me wrong. I recognize no one can ever pick the exact bottom. But if you can just get your readers back into the market reasonably close to a good buying zone, I think they will be forever grateful.
Larry: I’ll do my best. But first, a warning: All too often, investors jump into the precious metals markets thinking that, just because metals are tangible assets, they can’t possibly get ripped off.
But the sad truth is that they often are fleeced by hidden charges, conflicts of interest and, sometimes, outright frauds. This is especially the case in a long-term bull market when investors get complacent and rising prices help camouflage the fraud. When people are making good money, they don’t notice how badly they’re getting clipped.
For instance, in October 2009, Chinese-made counterfeit gold coins flooded online gold auctions and even flea markets — and that was just one example of more than 1 million fake coins that were sold in the U.S. alone.
Even legitimate “replica”-type gold- and silver-plated coins have become a hotbed for scams. In fact,Coin World reported that up to 99 percent of the “replica” items sold into the U.S. market do not contain the required “COPY” markings to make them legitimate replicas.
Martin: Let’s say I’m buying an Australian Nugget or a British Sovereign or a Canadian Maple Leaf, or even an American Eagle. How do I know whether it’s real or counterfeit?
Larry: You don’t. But one way to protect yourself is to buy bars from the refiner. If I bought a Johnson Matthey bar, and Matthey told me it was the original, straight from their refinery, that would be very reassuring. Ditto for Engelhard.
Fortunately, bullion coins are much harder to counterfeit than bars, because the designs are more intricate. Still, even with the coins, counterfeits can be a problem.
It’s almost impossible to make a counterfeit gold bullion coin that’s not obviously different in weight, diameter or width. So the key is to compare its weight and dimensions against a coin you know is real. Even if you’re not experienced with coins, you can tell the difference.
Martin: Suppose I want to buy a piece of jewelry made with gold coins?
Larry: Then buy the coins separately and give them to a jeweler you can trust to make the piece for you.
Martin: In one of your reports, you warned about counterfeit coins made with tungsten.
Larry: Yes, tungsten has the same density as gold. Until recently, a tungsten counterfeit would show up obviously as a counterfeit because the strikes were so poor. Now, with better technology, tungsten counterfeits are almost impossible to detect visually. But you can still use the “ringing test” to see if it’s real or not. Drop it on a hard desk. Then do the same for a coin that you know is real. You’ll hear a distinct difference in the sounds the two coins make.
Martin: I always see ads about so-called “mint state” and “limited edition” bullion coins that are supposedly worth much more than a common bullion coin. What do you think about that?
Larry: It’s pure hogwash. Bullion coins are not rare coins. Period. The governments and marketing firms that sell them don’t seem to care the least bit about the losses investors eventually incur.
If you want to buy bullion, stick with bullion coins you can buy with fair premiums over their melt value.
Stay away from the “limited edition,” “proof” or “mint state” claims, whether it be on proof Pandas, proof Krugerrands, proof U.S. Eagles, proof Sovereigns, proof Australian Nuggets or any other.
As for numismatic coins, they can be great. But it’s a market no one should invest in unless they are an expert, or have one at their disposal.
Martin: A big issue you write about is the premium an investor pays for bullion coins — in other words, how much more they cost than the metal itself. How should I calculate that premium?
Larry: First, divide the price of the coin by the number of troy ounces of pure gold that it contains. That gives you the cost per ounce. For example, if a coin has 0.9999 troy ounces of pure gold and sells for $1,800. That’s $1,800 divided by 0.9999, or $1,800.18 per ounce.
But the spot price of gold at the time was $1,612. So you’d be paying $188.18 per ounce extra for the gold in this coin. That’s your premium.
Convert that to a percentage, by dividing the $188.18 by $1,612, and you get 11.67 percent.
Martin: That seems darn high to me.
Larry: Darn right it is! But if you consistently use this simple formula, you can more easily sniff out the rotten offers and find the good ones.
Martin: What’s a reasonable premium for gold coins?
Larry: Premiums have gone up quite a bit already in recent years. But if a dealer tries to sell you coins at more than 5 percent over the actual value of the gold content — the average premium levels for a particular coin — I’d go elsewhere. You’d be paying too much.
Each bullion coin producer — the U.S. Mint, Canadian Mint, South African Mint, Chinese Mint, Australian Mint, etc. — builds in a mark-up for its coins, a premium over the pure bullion value or “melt value” of the coin. In each case, this premium varies.
Wholesalers also add a small premium to cover their cost of money and to make a profit on their inventory.
The retailer — the company you buy the coin from — also adds a mark-up.
So the premium over melt can vary widely as each mint, wholesaler and retailer add their pre-determined mark-ups.
Martin: So the lower, the better.
Larry: Not always. Yes, sometimes quality dealers deliberately underprice coins as a way of attracting new customers — like a credit card company that offers an extremely low introductory interest rate. And taking advantage of these opportunities might seem to be a great way to save money on bullion.
But in my experience, most dealers that advertise such gimmicks are out to ensnare you in their marketing net. As soon as you buy that one coin, ingot or bar from them, you’re bombarded with all sorts of deals that aren’t so good. And some that are outright fraudulent.
Moreover, if the firm is consistently selling bullion with premiums that are far below the competition, it raises my eyebrows. They can’t do that for an extended period and remain viable as a business.
Martin: You have helped a lot of people save a lot of money with their gold coin transactions. Can you give us some concrete examples of how that’s possible?
Larry: Sure. Again, let’s say that spot gold bullion is at $1,612 per ounce. And let’s say you bought 100 units of 1990 gold Pandas, the bullion coin issued by the Chinese. You’d pay about $240,000.
But that same $240,000 would buy 133 Austrian Philharmonics. So you would get an extra 33 coins, containing a bit less than 33 ounces of pure gold.
The extra gold you get is a dramatic addition to your portfolio — it’s like a free bonus you get for investing intelligently.
Alternatively, you could simply buy 100 ounces of gold in the form of Krugerrands for roughly $166,830 and pocket the difference — a healthy $73,170.
Martin: I get that. When it comes time to buy in significant amounts, what should I be looking at?
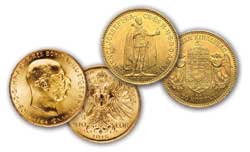 Larry: The Austrian 100 Corona and Hungarian 100 Korona are typically among the least expensive bullion coins (over spot) to buy.
They’re a beautiful reminder of the Austro-Hungarian empire. They’re both the same size, weight and alloy, but they have different designs.
I’ve also found that the South African Krugerrands can give a decent amount of gold for your dollar. It is synonymous in the public eye with 1 ounce of gold and, therefore, extremely liquid.
Martin: The importation of Krugerrands was banned in 1985, wasn’t it?
Larry: Yes. At the time, investors were bombarded with advertisements from dealers warning that severe losses were likely to befall Krugerrand owners.
These ads preyed on investors’ fears to try to get them to “swap” Krugerrands for Maple Leafs, Double Eagles or whatever the dealer happened to be pushing.
Martin: You warned our readers that this was pure poppycock. Were you right?
Larry: I was. And now, despite the fact the ban is over, we still hear of brokers who tell their clients that Krugerrands are dangerous. It’s complete nonsense.
The only reason a dealer would suggest switching your Krugerrands or recommending another product is pure profit. Krugerrand swaps can generate as much as an 8 percent net return for a dealer — between his buy-and-sell spread. And those who push other products are often receiving a higher net commission for those recommended products.
So if you own Krugerrands, sit on them. They still have international liquidity. They’ll always be worth the price of the gold that’s in them.
And for new gold holdings, the Krugerrands represent a cheap way to buy a single ounce of gold. But wait for my “buy” signal.
Martin: We definitely will. Plus, next week, please give us a series of other ways you recommend for buying precious metals.
Larry: Will do. In the meantime, you can get the video issue I’ve just released with my important new forecasts and recommendations for gold and silver. Just click //www.gliq.com/cgi-bin/click?weiss_mam+0102301-7+MAMw023+vgbb@shaw.ca+++3+4422655++“>here.
Martin: Great! I think I can speak for our readers in thanking you very much for providing so much valuable information.
Larry: My pleasure.
THIS WEEK’S TOP STORIES
Bond Market Bombshell: Fed Official Gives ‘Sell’ Signal
by Mike Larson
If there’s any doubt that the generation-long bond-market rally has come to a close, Federal Reserve Bank of Dallas President Richard Fisher just ended the discussion
How Much Longer Will This Bull Market Run?
by Douglas Davenport
“To buy when others are despondently selling and sell when others are greedily buying requires the greatest fortitude and pays the greatest reward.” — Sir John Templeton
The stock market is in trouble … but I’m not turning outright bearish
by Larry Edelson
The stock market is in trouble.
I believe that the interim top that I have been waiting for is finally here. I can see it in the thinning volume in the Dow Industrials and the S&P 500 stocks.
I can see it in the smaller and smaller number of stocks that have led the recent advance, compared to the number that are actually falling.


The Top of the Market bell ringing has begun in Vancouver but is not heard in Calgary or Toronto.
VANCOUVER average single family detached prices in May 2013 ticked up 0.4% M/M but remain 13.9% ($147,600) below their peak set last April 2012 (Vancouver Chart). On an annual basis, Vancouver is on a choppy sea of red (Scorecard) with combined residential prices down 4.3% Y/Y and detached housing taking most of the hit. Average strata units, for the commoners, continue to trade at 2007 prices but up in the penthouses it’s zenga zenga and who knows, maybe bunga bunga as a $25,000,000 condo sale get’s printed up in all the media as the biggest Canadian MLS condo sale on record, eg: CBC
Now that you have the May data, where do you think Vancouver SFD prices will be one year hence? VOTE HERE.
CALGARY average detached house and condo prices in May 2013 broke out again to new record highs (Calgary Chart) with townhouses not far behind. I have added the TSX Energy Index plot to the chart to see when correlations occur with housing prices, so far the correlation has been negative for the last 2 years. Although there is pricing joy in Calgary, it’s not showing up on the Momentum Chart. What is showing up is a different world of earnings in Alberta compared to the rest of Canada.
The sentiment in Calgary is the least bearish of the 3 markets polled with only 23% of the survey thinking Calgary SFD prices will be 20% lower in 12 months. What do you think? VOTE HERE.
EDMONTON average detached house prices in May 2013 also moved up on a rally of 3.9% M/M (Canada Chart), while condo prices sold off 2.4% M/M. Where Calgary has mostly positive sales numbers, Edmonton has red ink in the Y/Y column with single family detached sales down 14.4% Y/Y and townhouses down 20.3% Y/Y (Scorecard). The current enthusiasm from bidders puts Edmonton SFD prices within a mere 1.9% of the May 2007 peak price (Plunge-O-Meter).
TORONTO average detached house prices for the GTA in May 2013 broke out to new highs along with townhouse and condo prices for a trifecta record breaking month (Toronto Chart). For anyone keeping score, the gap between Vancouver and Toronto housing prices (Vancouver vs Toronto) is narrowing, especially condos and marketers should note that HNWI has fallen in love with Toronto.
Never mind the boom, polled sentiment here continues to suggest that prices will be down another 20% in 12 months. What do you think? VOTE HERE.
OTTAWA average detached house prices are not available, instead the chart on this site reflects Ottawa’s average combined residential prices. OREB’s report is sparse and opaque and the CMHC, records for Ottawa inventory remain one month lagging. In May 2013 Ottawa combined residential prices retreated 0.3% M/M from the record high price set the previous month (Scorecard). Month over month sales boomed 14.7% M/M but annually are down 4.9%.
MONTREAL median (not average) detached house prices in April 2013 (I WILL PUBLISH THE MAY DATA WHEN I GET IT – PROBABLY NEXT WEEK JUNE 10-14) ticked up 1.1% M/M in a narrow price channel just 0.7% shy of the peak set 10 months ago in June 2012 (Canada Chart). Prices are floating on sales resistance (Scorecard) with combined residential sales 11.4% below last year. In the 2011 Census, Montreal added 6.4% more dwelling units while only adding 5.2% more people. There is no shortage of housing, but there is a shortage of earnings; the Province of Quebec ranks 6th in Canada’s 10 provinces for earnings and prints an unemployment rate of 7.8% in April; 0.1% above Ontario’s.

 Drought is a normal recurring feature of the climate in most parts of the world. It doesn’t get the attention of a tornado, hurricane or flood. Instead, it’s a slower and less obvious, a much quieter disaster creeping up on us unawares.
Climate change is currently warming many regions, overall warmer temperatures increase the frequency and intensity of heat waves and droughts.
We can prepare for some climate change consequences with public education, water conservation programs, limiting pumping from our freshwater aquifers to recharge rates and putting in place early warning systems for extreme heat events.
Unfortunately some things cannot be prepared for…like the pervasiveness and persistence of a hundred year drought.
The collapse of the world’s earliest known empire was because of drought.
The Akkadians of Mesopotamia forged the world’s first empire more than 4,300 years ago. The Akkad’s seized control of cities along the Euphrates River and swept up onto the plains to the north –
in a short period of time their empire stretched 800 miles, all the way from the Persian Gulf to the headwaters of the Euphrates, through what is now Iraq, Syria and parts of southern Turkey.
Tell Leilan was a small village founded by some of the world’s first farmers. It’s located in present day Syria and has existed for over 8,000 years. The Akkad’s conquered Tell Leilan around 2300 B.C. and the area became the breadbasket for the Akkadian empire.
After only a hundred years the Akkadian empire started to collapse.
In 1978, Harvey Weiss, a Yale archaeologist, began excavating the city of Tell Leilan. Everywhere Weiss dug he encountered a layer of dirt that contained no signs of human habitation. This dirt layer corresponded to the years 2200 to 1900 B.C. – the time of Akkad’s fall.
The Curse of Akkad
For the first time since cities were built and founded,
The great agricultural tracts produced no grain,
The inundated tracts produced no fish,
The irrigated orchards produced neither wine nor syrup,
The gathered clouds did not rain, the masgurum did not grow.
At that time, one shekel’s worth of oil was only one-half quart,
One shekel’s worth of grain was only one-half quart. . . .
These sold at such prices in the markets of all the cities!
He who slept on the roof, died on the roof,
He who slept in the house, had no burial,
People were flailing at themselves from hunger.
The events described in “The Curse of Akkad” were always thought to be fictional. But the evidence Weiss uncovered at Tell Leilan (along with elevated dust deposits in sea-cores collected off Oman) suggest that localized climate change – in Tell Leilan’s case a three hundred year drought, desertification, was the major cause.
“Since this is probably the first abrupt climate change in recorded history that caused major social upheaval. It raises some interesting questions about how volatile climate conditions can be and how well civilizations can adapt to abrupt crop failures.” Dr. Harvey Weiss, Yale University archeologist
Ghost Empire
Perhaps the most notable empire decline due to drought, or altered precipitation patterns, was the Maya empire. At the peak of their glory the Maya ranged from Mexico’s Yucatán peninsula to Honduras. Some 60 Maya cities – each home to upwards of 70,000 people – sprang up across much of modern day Guatemala, Belize, and Mexico’s Yucatán Peninsula.
“The early Classic Maya period was unusually wet, wetter than the previous thousand years… Mayan systems were founded on those [high] rainfall patterns. They could not support themselves when patterns changed.” Douglas Kennett, an environmental anthropologist at Pennsylvania State University.
During the wettest centuries, from 440 to 660, Maya civilization flourished.
The ‘Big Dry’
Then precipitation patterns changed, the following centuries, to roughly 1000 A.D., did not treat the Mayas so kindly, they suffered repeatedly from drought, oftentimes extreme drought lasting a decade and more.
Between 1020 and 1100 the region suffered the longest dry spell in many millennia. The Maya’s suffered crop failure after failure, famine, death and eventually mass migration.
“Yucatecan lake sediment cores … provide unambiguous evidence for a severe 200-year drought from AD 800 to 1000 … the most severe in the last 7,000 years … precisely at the time of the Maya Collapse.” Richardson Gill, The Great Maya Droughts
After 200 years, in just an eye-blink of time, famine and drought held sway… and most people walked away leaving behind a ghost empire.
Drought Today
Currently the percentage of Earth’s land area stricken by serious drought is intensifying. Widespread drying has occurred over much of Europe, Asia, North and South America, Africa, and Australia.
“Desertification, along with climate change and the loss of biodiversity, were singled out as the greatest challenges to sustainable development at the 1992 Rio Earth Summit. Unfortunately, desertification, land degradation and drought (DLDD) have accelerated during the 20th and 21st centuries to date, posing fundamental problems and challenges for drylands populations, nations and regions in particular.
Severe land degradation is estimated to be affecting 168 countries around the world, according to a first-of-its-kind cost-benefit analysis (CBA) of the global effects of desertification released during the UNCCD Conference and Committee Meeting held this past April (April, 2013 – editor) in Bonn, Germany. That’s up sharply from 110 as of a previous analysis of data submitted by UNCCD parties in the mid-1990s.” Andrew Burger, ‘Global Warming is Real’

“In April 2013, short-term global drought conditions intensified on all continents except Antarctica with little relief worldwide. In North America, the intensification was seen in the Central and Southern Plains of the U.S. and down into central Mexico. In South America, drought conditions changed little with severe drought conditions remaining in eastern Brazil and along the leeward side of the Southern Andes. In Africa, drought intensified along the equator, especially in the eastern part of the continent and across Madagascar. In Europe, drought intensified across most of the central part of the continent. In Asia, drought continued to intensify in southern China and across Southeast Asia, as well as across southern Russia and northern Kazakhstan and Mongolia. In Australia, drought intensification occurred in many inland areas.” drought.gov
“Namibia, already the driest country in sub-Saharan Africa, is experiencing a severe drought, with some regions receiving the lowest seasonal rainfall in three decades.” June 3rd 2013, Newsday
“Australians are some of the world’s greatest energy consumers, and people in Perth use more water than any other city in Australia. Yet theirs is also the driest climate in the world, and Perth sits right on the edge of a vast desert. Perth sits above a vast ancient aquifer of 40,000-year-old water that has traditionally been the main source of drinking water. But in the mid 1970s there was a dramatic shift in climate that resulted in a decline of between 15% and 20% in winter rainfall. The combination of rising temperatures and a lack of wet winters has meant a steady decline in water levels in the aquifer and they are not being recharged. By the mid 1990s, scientists realized they were facing more than a prolonged drought, that this was in fact climate change.” News.bbc.co.uk
Conclusion
As the earth warms some regions will get wetter, many much drier.
Climate change, global warming, drought and desertification. What’s happening in your particular region should be on your radar screen. Is it?
If not, it should be.
Richard (Rick) Mills
Richard is the owner of Aheadoftheherd.com and invests in the junior resource/bio-tech sectors. His articles have been published on over 400 websites, including:
WallStreetJournal, USAToday, NationalPost, Lewrockwell, MontrealGazette, VancouverSun, CBSnews, HuffingtonPost, Londonthenews, Wealthwire, CalgaryHerald, Forbes, Dallasnews, SGTreport, Vantagewire, Indiatimes, ninemsn, ibtimes, businessweek.com and the Association of Mining Analysts.
If you’re interested in learning more about the junior resource and bio-med sectors, and quality individual company’s within these sectors, please come and visit us at www.aheadoftheherd.com
***
Legal Notice / Disclaimer
This document is not and should not be construed as an offer to sell or the solicitation of an offer to purchase or subscribe for any investment.
Richard Mills has based this document on information obtained from sources he believes to be reliable but which has not been independently verified.
Richard Mills makes no guarantee, representation or warranty and accepts no responsibility or liability as to its accuracy or completeness. Expressions of opinion are those of Richard Mills only and are subject to change without notice. Richard Mills assumes no warranty, liability or guarantee for the current relevance, correctness or completeness of any information provided within this Report and will not be held liable for the consequence of reliance upon any opinion or statement contained herein or any omission.
Furthermore, I, Richard Mills, assume no liability for any direct or indirect loss or damage or, in particular, for lost profit, which you may incur as a result of the use and existence of the information provided within this Report.

 “all politics ultimately comes down to violence — armed men paying you a visit to make sure you comply”
Ed Note: The quote above caught my attention given the Department of Homeland Security is presently under investigation for its plans to buy more than 1.6 billion rounds of ammunition over the next four or five years. This massive purchase coming on top of the 360,000 rounds of hollow point bullets (made illegal on the battlefield in the 1899 Hague Convention) and the 1.5 billion rounds of ammo it already bought in 2012.
It sure seems the Department of Homeland Security is getting ready for something involving a lot of heavy gunfire. Kevin Williamson thinks it is going to be “The End”. The “End” of Society as we know it and he describes what it’s going to look like his book on the right.
Where Kevin probably differs with absolutely everyone who lifts a pen and writes about the USA’s financial straits, is that he thinks “The End” is going to be Awesome and that America going broke will ultimately leave America Richer, Happier and more Secure!
Is The End Near, And Will It Be Awesome?
…….read more HERE

The U.S. Mint has resumed selling its 2013 American Eagle One-Tenth Ounce Gold Proof Coin at a hefty $195 per coin as of last week. The Mint has set a 20,000-coin production limit for the coin. Sales of its smallest gold coin was suspended by the Mint in late April as year-to-date demand had increased by more than 118% until inventories could be replenished.
Here are some interesting statistics. So far at close to the half-way point of the year, the U.S. mint has sold more one-tenth ounce gold coins than it did in all of 2012. About 50,000 such coins have been sold thus far for this month, with a total of 350,000 sold so far this year. This compares to total sales of 315,000 such coins sold for the entire year of 2012. The U.S. Mint will continue to limit purchases of the American Eagle one-ounce silver coins. Sales were suspended earlier this year due to record-breaking demand.
Reuters reported Wednesday that the appetite for U.S. American Eagle gold and silver bullion coins is still at unprecedentedly high levels almost two months after the historic sell-off in gold. The U.S. Mint’s acting director told Reuters that the mint is buying all the coin blanks they can get their hands on to fulfill the pent up demand for gold coins unleashed by the decline in price.
The facts above suggest that there is fundamental strength in the gold market. On the other hand, some developments this week hint at its short- and medium-term weakness.Let’s move on to today’s chart section to see how the situation looks like. We’ll start with the USD Index short-term chart as we believe that what has happened on the U.S. currency market is the most important event this week (charts courtesy byhttp://stockcharts.com).

The reason for this is the price action seen on Thursday when the index declined sharply, pulling back a bit before the session closed to end the day very close to the level of the May low. In fact, it is possible that we have seen the final bottom for this correction. The breakdown which we see here below the rising support line was so dramatic that it just might be the decline that the breakdown was supposed to generate.
The most important and interesting implications are seen when we look at the reaction of the precious metals to Thursday’s decline in USD Index. Specifically, it is the lack of reaction in these markets that is most striking, even though the dollar index declined by about 1.5 index point and closed the day about 1 point lower. A huge rally in gold, silver, and the precious metals mining stocks would normally accompany such a significant move in the USD Index (say, a $30 – $50 rally in gold), but barely any move to the upside was seen. This is a very bearish indication for the precious metals sector.
Let’s see how the euro reacted to Thursday’s developments in the USD.

In the short-term Euro Index chart, recall that we have had a head-and-shoulders pattern underway and not yet completed. The question now is “Was this pattern invalided on Thursday with the decline in the USD Index and the move to the upside which was seen here?” Quite simply the answer is no. The move higher did not take the index above the final Fibonacci retracement level. Drawing parallel lines based on the local bottoms, we see that the upper line has not been reached and it emphasizes that the shape of the head-and-shoulders is still intact.
The index level is not too high above the last shoulder as the formation is skewed. This is due to both higher lows and higher highs. The last shoulder (September-October) has a double top pattern so it’s really not so striking that the right shoulder just formed a second top. All-in-all, this pattern could still be completed and if it is, it will have bearish implications for the euro and the precious metals and bullish implications for the dollar.
Now, let us take a look at the yellow metal to see whether any reaction to the dollar’s weakness was seen. (click image for larger view)

We see that gold has rallied a bit more than $20 this week, really not much of a rally at all. The outlook continues to be bearish and the trend remains down. Gold could still decline heavily based on the long-term cyclical turning point, which is due approximately next week. In both 2008 and 2009, local tops formed slightly after the cyclical turning point, so it is possible that the reversal in the downtrend won’t be seen until after the cyclical turning point once again, leaving a number of days in which further declines could be seen.
Summing up, the most important development in the currency markets was the heavy decline of the USD Index on Thursday and the striking lack of reaction in the precious metals sector. The implications are bearish for gold, silver and the precious metals mining stocks and we think that this sector will need to decline once again before another big rally begins.
To make sure that you are notified once the new features are implemented, and get immediate access to our free thoughts on the market, including information not available publicly, we urge you to sign up for our free gold newsletter. Sign up today and you’ll also get free, 7-day access to the Premium Sections on our website, including valuable tools and charts dedicated to serious Precious Metals Investors and Traders along with our 14 best gold investment practices. It’s free and you may unsubscribe at any time.
Thank you for reading. Have a great and profitable week!
Przemyslaw Radomski, CFA
Founder, Editor-in-chief
Gold Investment & Silver Investment Website – Sunshine Profits
* * * * *
About Sunshine Profits
Sunshine Profits enables anyone to forecast market changes with a level of accuracy that was once only available to closed-door institutions. It provides free trial access to its best investment tools (including lists of best gold stocks and silver stocks), proprietary gold & silver indicators, buy & sell signals, weekly newsletter, and more. Seeing is believing
Disclaimer
All essays, research and information found above represent analyses and opinions of Przemyslaw Radomski, CFA and Sunshine Profits’ associates only. As such, it may prove wrong and be a subject to change without notice. Opinions and analyses were based on data available to authors of respective essays at the time of writing. Although the information provided above is based on careful research and sources that are believed to be accurate, Przemyslaw Radomski, CFA and his associates do not guarantee the accuracy or thoroughness of the data or information reported. The opinions published above are neither an offer nor a recommendation to purchase or sell any securities. Mr. Radomski is not a Registered Securities Advisor. By reading Przemyslaw Radomski’s, CFA reports you fully agree that he will not be held responsible or liable for any decisions you make regarding any information provided in these reports. Investing, trading and speculation in any financial markets may involve high risk of loss. Przemyslaw Radomski, CFA, Sunshine Profits’ employees and affiliates as well as members of their families may have a short or long position in any securities, including those mentioned in any of the reports or essays, and may make additional purchases and/or sales of those securities without notice.

-
I know Mike is a very solid investor and respect his opinions very much. So if he says pay attention to this or that - I will.
~ Dale G.
-
I've started managing my own investments so view Michael's site as a one-stop shop from which to get information and perspectives.
~ Dave E.
-
Michael offers easy reading, honest, common sense information that anyone can use in a practical manner.
~ der_al.
-
A sane voice in a scrambled investment world.
~ Ed R.
Inside Edge Pro Contributors

Greg Weldon

Josef Schachter

Tyler Bollhorn

Ryan Irvine

Paul Beattie

Martin Straith

Patrick Ceresna

Mark Leibovit

James Thorne

Victor Adair